INTRODUCTION
Anorexia nervosa (AN) is a debilitating psychiatric disorder that commonly presents during adolescence and primarily affects girls and young women.1 Characteristic features of AN include malnutrition, an intense fear of weight gain, disturbed body image and behaviors associated with a drive for thinness, such as severe dietary restriction, laxative and diuretic usage, and excessive physical activity.2 The exact etiology of AN is unknown and it is currently considered multifactorial, involving the interplay between genetic and environmental factors.3 As is true with many psychiatric disorders, the course of AN is heterogeneous. Some patients have relatively short-term illness and recover quite quickly, while other patients have a prolonged illness with multiple hospitalizations and long-term impairment.4,5 The mean duration of AN is 4.5 years and 20% of all individuals with AN remain chronically ill.5 Recovery rates vary depending on the specific criteria used. Generally, weight recovery occurs faster (i.e. 11.3 months) than eating disorder symptomatology (i.e. 22.6 months).6 Patients with AN, clinicians and researchers have stated that the identification of predictors of treatment outcome and illness duration is one of the highest priorities for research into adolescent AN.7,8 A range of possible predictors of illness course in AN have been identified. Social-cultural and behavioral predictors for a worse outcome include purging, compulsivity, interpersonal and social problems, rumination, impulsivity, autistic traits, a history of suicide attempts, alcohol and/or drug abuse, earlier specialized treatments, longer duration of inpatient treatment and a longer duration of AN before treatment.9–16 Also, patients with an illness onset before 17 years-of-age tend to have a better outcome than both patients with an onset in adulthood and patients with a prepubertal onset.17 Eating disorder characteristics, including a low body mass index (BMI) and body image disturbances, and more social and psychological problems have been shown to predict a worse outcome.9,10 Two studies reported that greater levels of exercise during treatment or shortly after discharge were associated with relapse,11,13 while another study did not find an association between exercise and the one-year recovery rate of AN.18
Neuroimaging studies help improve our understanding of neurobiological underlying processes of AN and the way brain functions drive behavior in general.19 Both structural and functioning neuroimaging studies have been used to predict treatment course and outcome in AN.20,21 In young people with AN, only one study investigated the predictive value of structural imaging data. This study showed that cortical gray matter and (sub)cortical white matter volumes at admission were positively associated with the BMI-Standard Deviation Score (BMI-SDS) at one-year follow-up.22 While global decreases in grey and white matter have been shown to be associated with malnutrition,20 the pattern of regional brain differences in restoration appears to predict outcome, as shown by studies investigating the entire age range of AN.23,24
No known studies to date have investigated the predictive value of resting state fMRI on eating disorder related features in clinical populations. However, in healthy young adults, Chen and colleagues found that high levels of eating disorder pathology were associated with lower functional connectivity, specifically in the executive control network, the basal ganglia network, and in the default mode network.25
Three studies have assessed the predictive value of task-based functional neuroimaging studies on eating disorder related features in young people and found associations between brain activity and different aspects of social and emotional functioning.26–28 These studies differed in study design, sample characteristics and had paradigms that make it difficult to draw general conclusions.
Several studies have focused on the possible predictive value of different cognitive domains on the severity of AN symptoms. Using a cross-sectional design, Harrison et al.29 showed that participants with AN who had a greater combination of fragmented perseverative cognitive style, less global flexible cognitive style, and more socio-emotional difficulties had a more chronic and severe form of AN. Moreover, poor set shifting skills were associated with prolonged illness duration.30
Results regarding the predictive value of physical health measures on treatment outcome are mixed. A lower BMI at admission and a higher rate of weight loss predict a poorer long-term outcome in patients with AN.10,31–34 Also eating behavior during the treatment phase was found to be a predictor: high diet energy density and high diet variety were found to positively predict a better one-year treatment outcome.35 Studies on the endocrine system showed that the presence of endocrine abnormalities, such as hypoglycemia, osteoporosis, irregular menses, amenorrhea, and high serum leptin levels at discharge appeared to increase the risk of a poor clinical outcome.14,32,36 Moreover, body composition is a significant predictor for treatment outcome according to some studies37–39 but these results are in contrast with results from others.31
Methodological limitations, such as small sample sizes, heterogeneous samples and differences in analysis strategies, make it difficult to draw general conclusions about predictors of the illness course of AN. We expect that measuring multiple predictors simultaneaously in one larger sample will lead to broader, more reliable and potentially more precise findings about factors that predict the illness course of AN. The identification of prognostic factors can not only help with treatment planning, but can also provide important insights into the neurobiological mechanisms of AN. A better understanding of the underlying mechanisms can in turn direct and improve current treatment approaches. Given the importance of the identification of predictive factors of AN, our goal was to capture multiple measurement domains, including physicial health, cognitive functions, neuroimaging, and behavior to best predict outcome in the face of considerable heterogeneity.
The BRAVE cohort
Currently, clinicians, relatives, or other individuals involved in the care of someone with AN cannot predict their clinical course. This lack of predictability is distressing for the individual, their relatives, and the clinicians involved. Identifying predictors of treatment response and illness duration is therefore a top research priority in the field of eating disorders.7,8 It is within this framework that we initiated a first-onset study recruiting girls and young women who fit the broader spectrum of first-onset AN. We also recruited a similar number of typically developing (TD) girls and young women without AN. The aim of the BRAVE study is twofold: 1) To identify predictors of one-year treatment response; 2) To investigate over time the association between clinically significant changes in the symptoms of AN with the underlying behavioral, neurobiological, cognitive and physical health changes. Eating disorder symptoms and BMI-SDS are defined as the primary longitudinal outcomes.
The results of this study will allow us to develop different treatment strategies to help curb what are deeply rooted neurobiological and cognitive processes in girls who require longer-term treatment. Based on what is both known and not known from the AN literature, a wide-array of measurements were selected to cover four specific domains: 1) behavior: general psychopathology, comorbidity (including autism spectrum disorder features, depression, anxiety and obsessive compulsive symptomatology), and eye gaze patterns; 2) neurobiology: structural and functional neuro-imaging; 3) cognitive domains (including intelligence, attentional bias, set shifting abilities, inhibitory control, visual spatial skills and decision making); and 4) physical health measures (including body composition, microbiome, cortisol measure in hair, muscle strength, and biobanking blood for DNA isolation and blood and serum measures). Our approach for the selection of measures was built on previous research, but also is hypothesis-driven to conduct exploratory analyses using advanced techniques, including machine learning. In addition, we will use epidemiological principles of data collection to collect biobanked measures for future use, and we welcome collaboration with other researchers in this field.
The goal of this paper is to provide an overview of the study design, measures, the rationale for the measures selected, and an overview of the collaborative network.
METHODS AND ANALYSIS
Study design and management
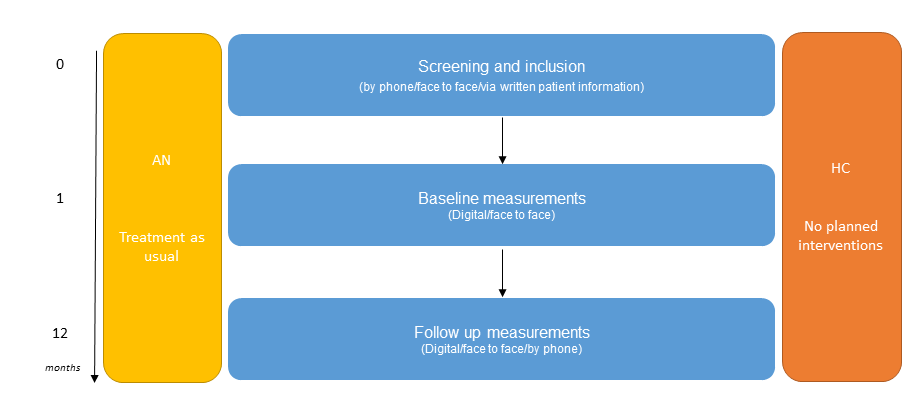
The BRAVE study is a multisite study initiated within the Erasmus Medical Centre – Sophia Children’s hospital (Erasmus MC-Sophia) in Rotterdam, the Netherlands. BRAVE is the abbreviation of the full title of this project ‘Brain functions and attention processing in adolescent anorexia nervosa: predictors of its differential course’. The study employed a case control repeated-measures design with a baseline visit and the first follow-up visit taking place one year after intake (see Figure 1 for a schematic overview). We are currently seeking permission from the medical ethics committee to add a third wave to our study design.
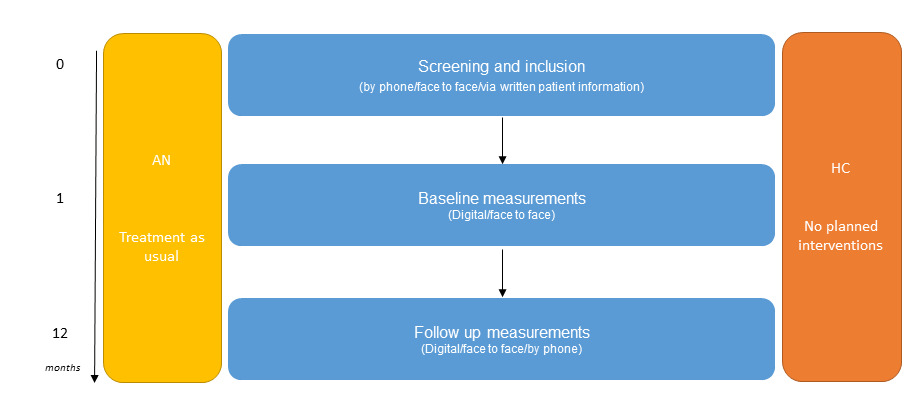
The study population consisted of female young people between 12 and 22 years-of-age with a first-onset DSM-5 classification of AN or atypical AN classified in the past 12 months and 12 to 22-year-old TD females. The age range 12-22 years was chosen because AN rarely presents before the age of 11 and rarely appears for the first time in adulthood. ‘First-onset’ referred to an initial diagnosis of AN obtained within the past 12 months, as confirmed by the involved clinician. Participants were required to fulfill the criteria for active AN at the time of screening and if they had received a diagnosis of AN prior to one year, they were excluded from the study.
Measurements were collected at baseline and at one year follow-up. During the time between baseline and follow-up, participants with AN received treatment as usual (i.e. family based interventions, cognitive behavioral therapy and somatic evaluations).
Participant eligibility, recruitment and ethical issues
To assure that the recruitment of AN participants is representative of the Dutch population, patient recruitment included not only our university-based AN inpatient and outpatient clinics, but we also formed collaborations with a wide network of national partners located in different parts of the Netherlands, both rural and urban settings. The partners included: Altrecht-Rintveld, Bravis Hospital, Curium-LUMC, Elisabeth-TweeSteden hospital, Emergis, GGNet-Amarum, GGZ Delfland, GGZ-Rivierduinen, GGZ-WNB, Franciscus Gasthuis hospital, Franciscus Vlietland Hospital, Ithaka, Reinier de Graaf Gasthuis, Stichting Human Concern, and the Van Weel Bethesda hospital. In addition, patients were recruited though advertisements via patient organizations, relevant websites and social media.
A control group of typically developing (TD) adolescent girls without AN, comparable in age and educational level to the AN group, was also recruited to compare cases versus controls and to adjust for typical developmental trajectories between the TD and AN youth. No additional aims were formulated for the TD group. Recruitment of the TD group was performed by inviting female friends of the young women with AN, advertisements in schools, sports clubs and via social media.
Exclusion criteria for both AN and TD included significant motor or sensory disorder(s), substance related disorders, neurological disorders, schizophrenia or other psychotic disorders, a poor command of the Dutch language, an IQ below 70 as measured by an intelligence test in the past, or the inability to fill in questionnaires independently. Controls were required to have a healthy weight (range BMI-SDS -1.3 to 1.3). Participants with contraindications for MRI scanning or with dental braces were invited to participate in all measures except for the MRI component of the study.
The research protocol and the collaboration with organizations in child and adolescent psychiatry/psychology were approved by the medical ethics committee of the Erasmus Medical Center in Rotterdam (MEC 2016-194/NL55175.078.16). Informed consent/assent has been obtained from every participant and informed consent was obtained from the parents in cases where the participant was younger than 16 years of age.
Recruitment procedure
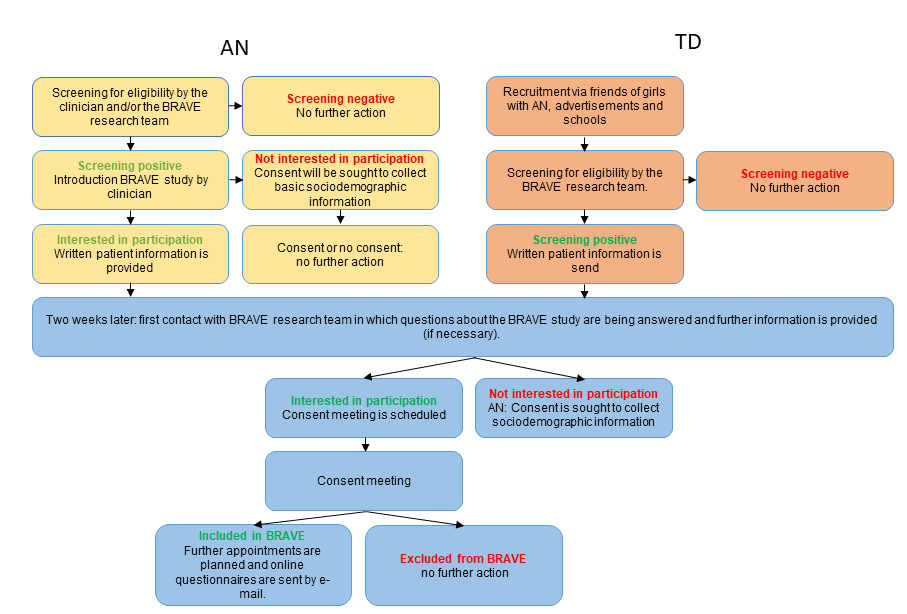
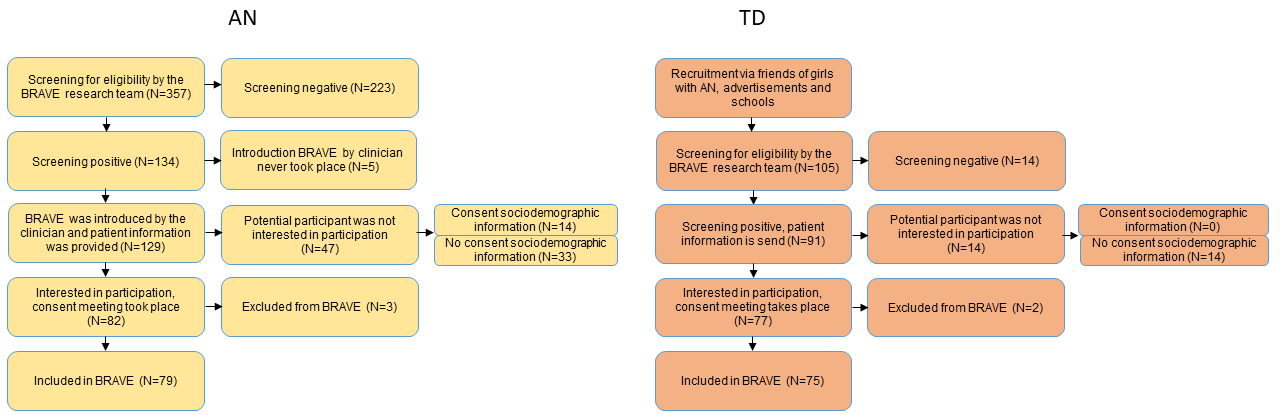
A schematic overview of the recruitment procedure is shown in Figure 1. In Figure 2, the BRAVE Study design is presented. Figure 3 presents a flow chart of the recruitment of the study sample.
Young people with first-onset AN were informed about the BRAVE Study through their care coordinator or clinician, who provided a short explanation about the study. If the study came to their attention via social media, patient organisations, or otherwise, they had the opportunity to ask for further information by returning a reply card or to request additional information via our website (https://www.erasmusmc.nl/nl-nl/sophia/pages/b/brave-onderzoek). Written information about the study was provided to the adolescent and their parents prior to the visit. The TD group learned about the BRAVE Study via our social media site, sportsclubs, or participants with AN (e.g. classmates, friends, acquaintances). If they were interested in receiving more information about the study they could send us an e-mail, fill in their personal details on our website, or by completing a reply card via mail. Shortly thereafter, a member of the BRAVE team contacted the young people or their parents, depending on the age of the adolescent, to check screening criteria. If eligible, written information about the study was sent to the adolescent and her parents at home. This information was comparable to information that was sent to the participants with AN. We contacted each potential participant two weeks after they received the written information to answer any questions about the study. If the adolescent was interested in participating, a consent meeting was planned. At the consent meeting, informed consent was obtained and inclusion and exclusion criteria were assessed via diagnostic interviews. If eligible for participation, two additional appointments were planned in random order.


One appointment consisted of the assessment of imaging, eyetracking and physical health measures. In the other appointment cognitive assessments were performed. Questionnaires regarding eating disorder related characteristics, socio-demographic features, psychopathology and quality of life were sent digitally to all participants and to the primary caregiver. In cases of participants with AN, we also sent a digital questionnaire to the mental health professional. If young people said that they were not interested in participation after learning more about the study, we asked if they were willing to provide basic sociodemographic information to be able to assess recruitment bias.
The baseline measurements were repeated at the one-year follow up visit. The interviews that were administered at the consent meeting are repeated approximately one year after the baseline measurement at a time that suited the participants. Our follow-up and retention strategies are presented in supplementary figure 1.
Measures
The assessments are obtained both at baseline and repeated a year later in both AN and TD individuals, unless explicitely mentioned otherwise.
Behavioral measures
In the BRAVE Study, psychiatric symptoms were measured using both interviews and questionnaires. The interviews were performed face to face. When face to face appointments were not possible due to COVID-regulations, interviews were carried out using Microsoft Teams or Skype for Business. At follow up the participants also had the choice to perform the interviews by phone. The questionnaires were filled out by the participant, the caregiver, and/or the clinician digitally on a secured website using Gemstracker (Gemstracker, copyright©, Erasmus MC and Equipe Zorgbedrijven, latest release at 2022, version 1.9.1p7, open source (new BSD licence), https://gemstracker.org). In Table 1 psychometric properties and a description of the measures are presented.
Eating disorder related measures
The Eating Disorder Examination, version 12.0 (EDE) is a semi-structured interview that is considered to be the gold standard for the assessment eating disorder pathology.56 The participants were interviewed about dieting patterns and the extent to which they worry about food, body shape and weight. The EDE-BRAVE also includes questions about the duration of symptoms in order to gain more information about the onset of the disorder. The Readiness and Motivation Questionnaire (RMQ-Dutch)41 was completed only by the AN participants to gather information about the readiness and motivation to recover from 12 AN symptoms. We translated the RMQ into Dutch, with permission of the original developers, to make it suitable for our participants. The Eating Disorder Inventory – third edition (EDI-3)57 is a self-report questionnaire that was used to assess eating disorder symptoms, i.e. drive for thinness, bulimia and body dissatisfaction, and psychological features of eating disorders, i.e. ineffectiveness, perfectionism, interpersonal distrust, interoceptive awareness, maturity fears, ascetism, impulse regulation and social insecurity. Lastly, participants filled in the Body Shape Questionnaire – Dutch version (BSQ-Dutch), that measured body shape concerns over the previous 4 weeks. With permission, we translated the English version43 into a Dutch version.
General psychopathology
We use two versions of the Mini-International Neuropsychiatric Interview (MINI-KID/MINI-PLUS) to assess general psychopathology in our participants, based on DSM-IV criteria*.* For those below 18 years-of-age we use the MINI-KID. For participants of 18 years and older we use the MINI-PLUS.
The Achenbach System of Empirically Based Assessment (ASEBA) questionnaires (44, 45) were also used to assess general psychopathology. For participants younger than 18 years-of-age, the Child Behavior Check-List (CBCL) (parent report) and Youth Self Report (YSR) (self-report) were administered. For participants aged 18 years and older, the Adult Behavior Check-List (ABCL) (parent report) and Adult Self Report (ASR) (self-report) were used.
Autism
The Social Responsiveness Scale (SRS)58 is a parent-reported questionnaire that obtains information about autistic traits. We used the SRS-2 for participants younger than 18 years old. For participants ages 18 years and older we used the SRS-A.
Anxiety
The Screen for Child Anxiety Related Disorders – Dutch (SCARED-NL)50,59 assesses anxiety symptomatology. We used both the child and the parent version of the SCARED-NL for all participants, irrespective of their age.
Obsessive Compulsive Behaviors and Thoughts
The (Children’s) Yale-Brown Obsessive Compulsive Scale ((C)Y-BOCS)51,60,61 is a semi-structured interview that assesses obsessive compulsive behaviors and thoughts in adults. We used the Y-BOCS in participants aged 18 years and older. For participants aged 17 years and younger we used the CY-BOCS.
Depression
The Beck Depression Inventory-II NL (BDI-II NL)53,62 is a self-report questionnaire that measures depressive symptomatology. It is one of the most widely used tests for measuring the severity of depression. The BDI-II NL was suitable for the entire age group of our participants.
Quality of life
The KIDSCREEN-2763,64 is a parent and self-report questionnaire that assesses the quality of life of our participants in general and on several domains
Eye gaze patterns
A Tobii 120 eyetracker (Tobii Technology, Danderyd, Sweden) was used to investigate eye gaze patterns in our participants, while they performed a free viewing and a dot probe task, both described below. The paradigms were programmed in E-prime (version 2.0.10.252, including extensions for Tobii, Psychology software tools, Pittsburgh, PA, USA).
Neurobiological measures
We used multimodal neuroimaging that included structural MRI, diffusion tensor imaging (DTI), and both task and resting state fMRI. The imaging procedure took place at Erasmus MC-Sophia. An overview of the sequences and parameters is shown in Table 2.
Neuroimaging measures and procedure
Magnet resonance imaging (MRI) was conducted using a GE Discovery 750w 3.0 Tesla system (GE Healthcare, Milwaukee, WI, USA) using an 8-channel head coil. The imaging protocol and sequences were harmonized with those obtained in the Generation R Study,65 which is a Dutch longitudinal prospective cohort study (See reference 52 for an overview of the imaging protocol and sequence parameters).
Researchers involved in neuroimaging data collection underwent an extensive safety-training course to become certified to work in the MRI setting. These researchers also underwent intensive training to master operating the GE Discovery 750w MR system.
The MRI scanning procedure was performed as follows. Prior to entering the MRI environment, all participants completed a MRI contra-indication form (including their parents of participants younger than 16 years old if they wanted to accompany their child into the control or MRI room). For those without contra-indications, a check was performed to assure that they were safe to go into the MRI (i.e., lack of jewelry, anything in their pockets, metal in their clothing, history of surgeries, etc.). If the participant was excluded from MRI scanning for any reason, the participant was still able to undergo the cognitive, behavioral and physical health measurements of the study.
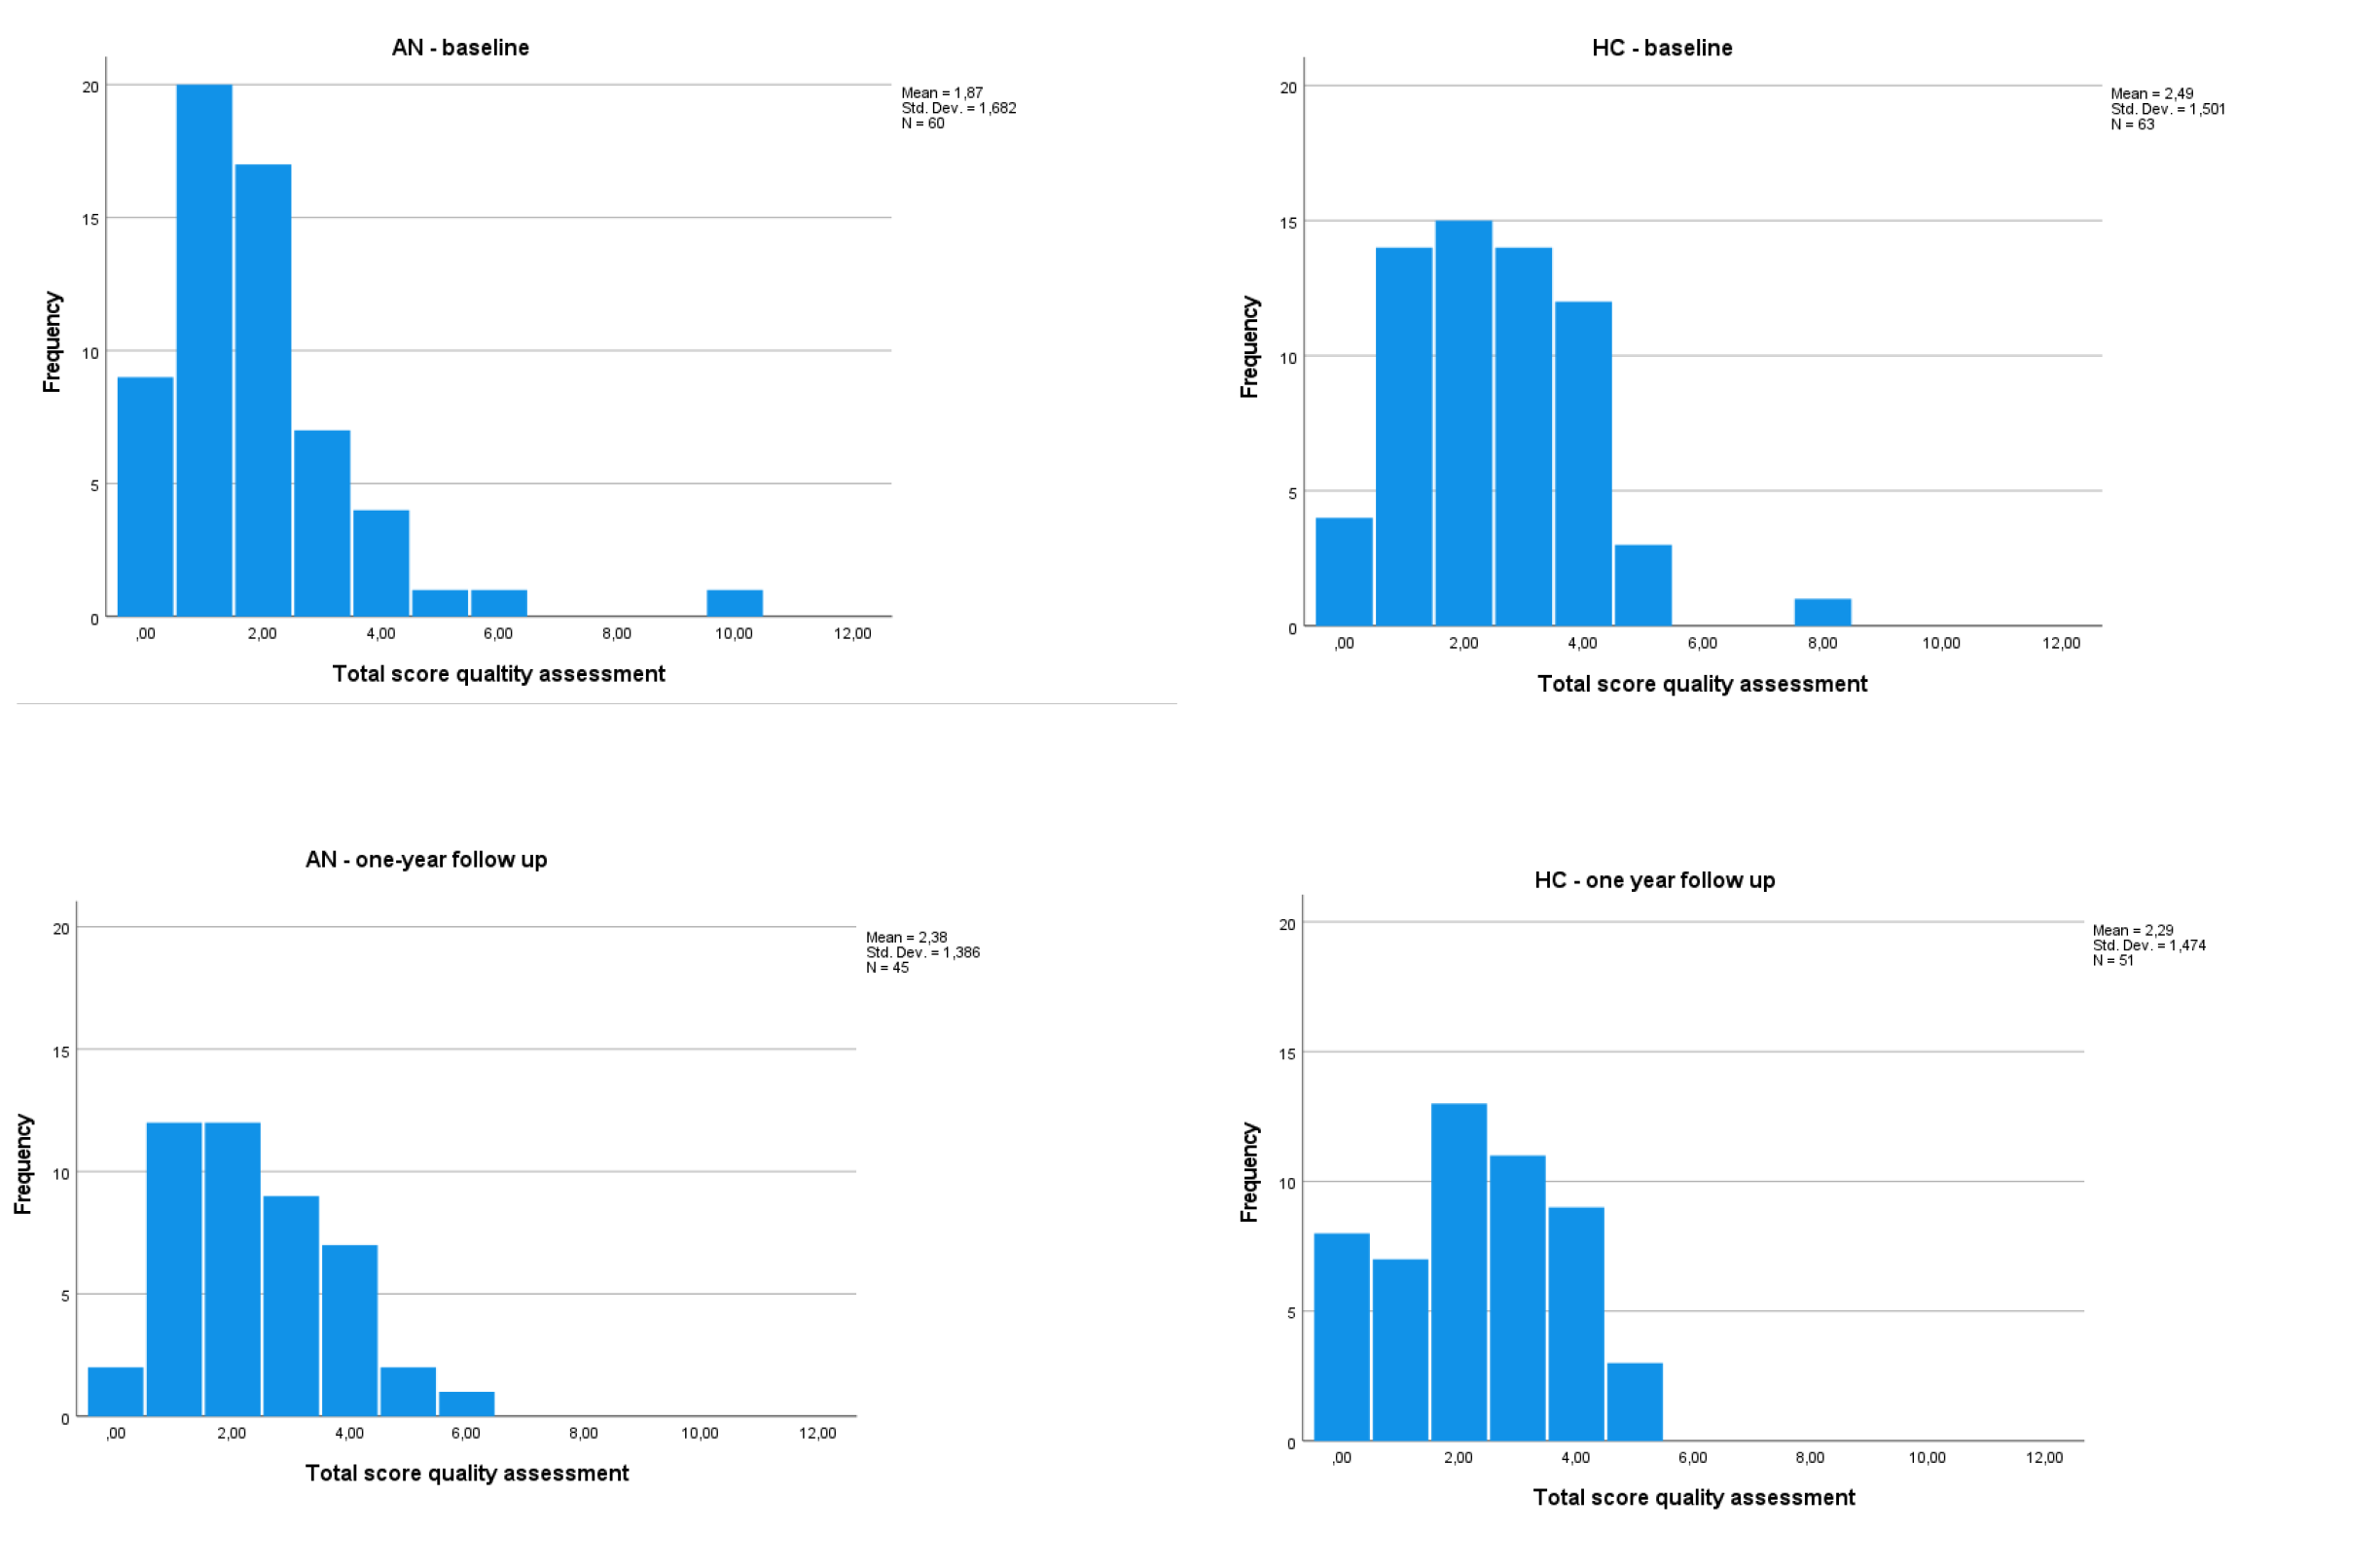
Following the MRI, all scans were evaluated for both data quality (see Figure 4 for the quality assessment ratings and Table 3 for movement parameters of the BRAVE MRI data) and incidental findings, initially performed by trained PhD students (see66 and67 for a decription of the quality rating procedures). If abnormalities were identified, the findings were then discussed with a neuroradiologist. If clinically relevant, the participant (and parents if the participant was younger than 16 years of age) was informed about these findings and the participant was referred for follow-up

Cognitive measures
Cognitive tasks were performed face to face with using testing materials, including a laptop, two-button (yellow/blue) Curdes response box, computer mouse, keyboard, a pencil, and a stopwatch.
The dot probe, go/no go and set shifting tasks were programmed in E-prime and practice trials were performed prior to the execution of the experimental trials to ensure that the tasks were understood by the participants. The paradigms that were performed in the MRI were practiced on a laptop with the same two-button response box as used in the MRI, approximately 20 minutes before MRI scanning. In all practice trials, each paradigm ended automatically when the participant reached a correct response rate of 80%. The same timing characteristics were applied in the practice trials as in the experimental tasks, but different stimuli were used to keep the testing effect as small as possible.
In Table 4, a description of the measures and their psychometrics are shown.
Intelligence
Measures of Intelligence are obtained with the Wechsler Abbreviated Scale of Intelligence-II, Dutch version (WASI-II NL).91 With this test we gained measures of verbal, non-verbal and general cognitive abilities.
Attention bias
The Dot Probe Task (DPT) is a broadly used paradigm to assess attention bias. Originally, it was developed by MacLeod and colleagues.92 Our DPT was based on the version of Werthmann and colleagues.93 In the BRAVE Study, two DPTs were developed, with both containing images of food and neutral stimuli. One of the paradigms was administered during fMRI scanning and the other during eyetracking. See Supplementary figure 2 for the timing characteristics of both DPTs.
Visual spatial abilities
We used three tasks to assess visuo-spatial abilities in our participants: 1) The Rey Complex Figure test (RCFT)94 measures visual spatial organization, visual spatial memory and visual spatial recognition. 2) The Motor free visual perception test, 4th edition (MVPT-4)76 assesses visual-perceptual abilities 3) The Navon task is a computerized paradigm that assesses global versus local processing of visual stimuli. Our Navon Task was based on the original version as developed by Navon,95 with adaptions implemented by Stoet.96
Set shifting
We used three versions of the same set shifting task to obtain measures of set shifting abilities. In the first set shifting task, neutral stimuli were used. In a second version, rather than neutral stimuli, we used images with individuals participating in physical exercise; and in the third version, which was performed in the MRI, food stimuli were used. The paradigms were based on the plus-minus task as described by Miyake and colleagues97 and the category switch paradigm of Wolf and colleagues.78 Similar tasks have been used by Van Autreve and colleagues98,99 in patients with AN. A schematic overview of the paradigms is shown in Supplementary figure 3.
Inhibitory control
We programmed three go/no go paradigms in order to measure proactive inhibition, i.e. the ability to suppress or interrupt motor responses.100,101 A version with neutral stimuli was performed on a laptop. A second version in which stimuli of female bodies with a normal BMI was performed during eyetracking and a third version with stimuli of female bodies with a very low and very high BMI was performed during fMRI. Our paradigms were based on the go no go task as used by Wolf and colleagues.78 See Supplementary figure 4 for a schematic overview of our paradigms.
Decision making
Three computerized paradigms were used to measure decision making, which were a Balloon Analogue Risk Task (BART), the Iowa Gambling Task (IGT) and a Probabilistic Reversal Learning Task (PRLT). The BART task has previously been used previously in studies by Pleskac and collegues.84 The IGT was developed by Bechara and collegues.102 Our PRLT was adopted from Hooper and colleagues.88
Passive information processing
We developed two computerized paradigms in which the participated was instructed to passively view a computer screen that presented a wide array of varying stimuli (e.g. bodies, food, eating situations, emotions (pleasant and scary), flashing checkerboard, video and sound of hands playing the piano, visual versus serial search, memory for faces). The participants performed this paradigm during fMRI scanning (passive task) and another version during eyetracking (free viewing task). The goal of this task was to actively drive different brain networks, including the shifts between networks. The passive task was also performed during the eyetracking session.
Executive functioning
The Behavior Rating Inventory of Executive Function (BRIEF)103 (self-report and parent/informant report) examines executive functioning of the participant. The BRIEF was used for participants younger than 18 years old and the BRIEF-A was used for participants aged 18 years and older.
Physical health measures
The measurements in this section included height, weight, and other measures of physical health and were collected in the Erasmus MC-Sophia Children’s Hospital. Table 5 provides a complete description of the measures and the data collection procedure.
Body material
Four blood tubes were collected at baseline and at follow-up to gain insight in the biological changes in AN with regard to the DNA profile/methylation patterns, hormonal assays, liver, kidney function, glucose levels and hematology abnormalities (leukocytes and thrombocytes). These data have been biobanked with the goal to engange or participate in large consortia, making it possible to perform large (i.e., GWAS, EWAS, etc.) studies in which large sample sizes are needed to draw meaningful conclusions. A hair sample was collected for cortisol analysis. Also participants provided a stool sample, collected at home with the goal to analyze intestinal flora (microbiome).
Body composition
Body composition was assessed by using the BODPOD (COSMED, the Metabolic Company, Italy), which is a a safe and non-invasive Body Composition Tracking System that provides measures of total body mass, fat mass (grams), fat-free mass (grams) and total body fat (%).
Muscle strength
Muscle strength was measured with a hand grip instrument JAMAR®-plus+ Digital Hand Dynamometer (Patterson Medical ®, Warrenville, IL, USA and Sammons Preston ®, Bolingbrook, IL, USA). The circumference of the upper arm of the participant was measured using a measurement tape (Seca 201).
BMI-SDS
The BMI-SDS uses the body mass index, defined by the equation BMI=weight/length2 (kg/m2), with a further adjustment for age and sex. For the BMI-SDS measure, the growth curves of the Dutch Organization of Applied Research (TNO) were used.106
General physical health
The physical health interview was perfomed on each participant, the caregiver and/or the clinician. Data regarding current and past physical health including history of diseases, smoking and drinking behavior, medication and vitamin supplement usage was collected. Also information regarding prior mental health treatment. We also collected information on the use of tube feeding tubes.
Additional measures
An overview of additional measures collected is provided in Table 6.
Prediction
We developed a short questionnaire that was filled in digitally by the clinician of a participant with AN at baseline and follow-up to asses their predicted treatment duration, types of treatment(s) needed, and treatment response.
Socio-demographic characteristics
In this questionnaires socio-demographic features such as native language, national origin, family characteristics, socio-economic status, including education level of the parents and the participant, were collected.
Appetite
Before the MRI scanning and eyetracking sessions, the participant filled out a questionnaire about their current appetite and the timing of their previous and next meal. She was asked to give an indication of the time of day she was planning to have her next meal and the time of day she had her last meal.
Sample description and descriptive analyses of the mean variables
The data collection has been finalized. The inclusion period lasted from 3 May 2017 to 14 October 2021.
The follow up data were completed on 16 January 2023. A total of 79 females with AN (typical=93.67%; atypical=6.33%) and 75 TD girls were included in the study. The retainment rate at time 2 was 72% (n=57) for the AN group and 88% (n=66) for the TD group. To investigate a possible selection bias in both the AN and TD groups, we compared the dropouts from the participants who also fulfilled data point 2 on the following variables: age, mother’s ethnicity, BMI-SDS, eating disorder characteristics (EDE and BSQ). The drop-outs in the AN group did not differ in sociodemographic and main variables from the AN participants who fulfilled both data collection points. In the TD-group, the drop-outs were slightly older compared to the TD girls who also fulfilled the measurements at time 2. The mean time between the two data collection points (reference BMI-SDS measurement) was 13.48 (SD=3.72) months for the AN group and 13.03 (SD=1.64) months for the TD group. Part of the data collection took place during the COVID-19 pandemic. Of the participants with AN, 49 were enrolled pre-pandemic and 30 peri-pandemic. For the TD group, 38 participants were enrolled pre-pandemic and 37 peri-pandemic. Enrolment was lower than expected during the pandemic and we did not reach our target goal of 90 participants per group. However, we did achieve a substantial sample size that exceeded most studies in this area.
The baseline characteristics of our sample are presented in Table 7.Compared to the TD girls, the girls with AN were younger in age (Mean Difference (MD)=0.82, (t=2.28, (df)=152, p=0.02). By definition, they had a lower BMI-SDS (MD=1.72, t=9.36, df=129.92, p<0.001), had more general eating disorder symptomatology (Mann-Whitney U (W)=193.0, Z=-10,01, p<0.001), showed more restrictive eating behavior (W=248.0, Z=-10.86, p<0.001) and worried more about food (W=34.0, Z=-10.86, p<0.001), weight (W=160.5, Z=-10.2, p<0.001) and body shape (EDE subscale body shape concerns: W=105.0, Z=-10.35, p<0.001); BSQ total score: W=125.5, Z=-9.65, p<0.001). They also fulfilled more DSM-IV criteria for comorbid psychiatric disorders than the TD group (total number of DSM-IV classifications: Chi-square (χ2)=56.24, df=5, p<0.001; eating disorders: χ2=70.69, df=1, p<0.001; OCD χ2=15.2, df=1, p<0.001; mood disorders: χ2=38.87, df=1, p<0.001; anxiety disorders: χ2=21.72, df=1, p<0.001). There were no group differences in race or background, highest education level of the mother, or in the number of developmental disorders, i.e. ADHD and ASD.
Correlations between sociodemographic and main variables are presented in Supplementary Tables 1 and 2.
Data management, analyses and sharing
All research data are stored under a de-identified Research ID and visit number (T1/T2) on a secure server within Erasmus MC. A link between research ID and personal details is only made in our Trial Master file, which is only accessible to key members of the research team and can be made available to the Dutch Public Health Inspectorate.
Blood samples were also stored using the Research ID and visit number. Written informed consent forms were scanned into electronic database and stored on protected servers seperate from the clinical report forms (CRFs). CRFs are manually entered into an electronic database. Questionnaires are administered online and stored in an electronic database. (f)MRI data are transferred to two separate dicom servers, one being archived by the department of radiology and the other a secure XNAT server within the department. Eyetracking data and neuropsychological computer tasks were stored on the testing laptop and back-ups were made on two separate storage devices. Blood samples and feces were biobanked within the Erasmus MC awaiting further analyses.
For data analysis, we will examine whether our four potential predictive domains can predict BMI-length/weight SDS and AN symptomatology after one year of treatment. Additionally, we aim to assess the association between clinically significant alterations and changes in these four predictive domains during the initial year of treatment, contrasting individuals with (atypical) AN against TD participants. To accomplish this, we will conduct linear mixed-model analyses. Access to data and requests for collaboration are welcome and will be conducted under the rubric of the European Union’s General Data Protection Regulation (GDPR).
STRENGTHS AND LIMITATIONS
The study has several strengths, including the use of objective measures in addition to self-report data, a longitudinal design, and a matched reference group based on age, gender, and education. The study also had several limitations. First, the BRAVE Study was not pre-registered, since as when the study was set up, preregistration was not a common practice in the Netherlands. Second, it’s noteworthy that this study encountered a slightly higer dropout rate among participants with AN during follow-up compared to those in the TD group. The dropout rate observed aligns with rates documented in other longitudinal studies focusing on AN.5 There are no indications for a selective drop out in the AN group. However, it remains unclear whether individuals who discontinued participation exhibited a more favorable or severe disease trajectory compared to those who continued, given the available follow-up data. The drop-outs in the TD group were older compared to those who also fulfilled the measurements at time 2. No other disparities in sociodemographic or clinical variables were discerned between TD participants with and without follow-up data at the time of enrollment.
Third, considerable data were collected as a part of the BRAVE Study, and thus there is the potential of Type I errors resulting from different statistical analyses. To mitigate the risk of false positives, pre-registration of papers will be implemented, when possible, and the correction for multiple testing (i.e. by using the Benjamini-Hochberg approach) will be applied.
CONCLUSION
The duration of illness of AN varies from several months to life-long, with an average treatment course of 4.5 years and 20% remaining chronically ill.5 At the moment, clinicians are unable to predict treatment outcome and illness duration for an individual patient, which is confusing and difficult to understand for the patients, caregivers and involved clinicians. Identifying predictors of treatment response has therefore been set as one of the most important priorities in eating disorder.,7,8 but also since greater symptom reduction during the early stages of treatment is an important goal for achieving better treatment response, especially in young people. Moreover failure to treatment response early may be a risk factor for less favorable long-term outcomes.107,108 Within this framework, we have set up the BRAVE Study with the primary goal to identify predictors of (immediate and long-term) treatment response in young women with AN. The goal is that we will be able to identify predictive patterns for treatment response within the heterogeneous presentation of symptoms of AN and co-morbid symptoms of psychopathology in adolescent girls. By recruiting young people who have recently been diagnosed with AN, we envision we might be able to better detect the specific underlying mechanisms
ACKNOWLEDGMENTS
First of all, we would like to thank al participants, their parents and clinician for their effort to participate in the BRAVE Study. The BRAVE Study is conducted by the Erasmus Medical Center in close collaboration with Altrecht-Rintveld, Bravis Hospital, Curium-LUMC, Elisabeth-TweeSteden hospital, Emergis, Emergis-Ithaka, GGNet-Amarum, GGZ Delfland, GGZ-Rivierduinen, GGZ-WNB, Franciscus Gasthuis and Vlietland hospital, Reinier de Graaf Gasthuis, Stichting Human Concern and The Van Weel Bethesda hospital. We are very grateful for the willingness of the clinicians and researchers, working in those organizations, to introduce our study to eligible patients with AN. The work of Prof. dr. Stefan Ehrlich was supported by the Deutsche Forschungsgemeinschaft (EH 367/5-1, EH 367/7-1 and SFB 940), the Swiss Anorexia Nervosa Foundation and the Roland Ernst Stiftung. The later work of Prof.dr. Tonya White was supported by the Intramural Research Program of the National Institutes of Mental Health in Bethesda, Maryland, USA. We thank Liselot Wolters for developing our promotion material, including our logo, posters and folders. We also thank our colleagues from our medical library for their excellent literature searches. This study is made possible by financial support from the Sophia Stichting Wetenschappelijk Onderzoek (grant number S15-13). We are also very grateful for the financial contribution of the Stichting Vogelgezang, which made it possible to complete our follow-up measurements.
Conflicts of Interest
The authors declare that they have no competing interests.