Introduction
The first step in any kind of neuroscientific analysis is data curation. Completing quality assessment (QA) and quality control (QC), that is, ensuring the data was acquired correctly and that the quality of the data meets established standards set for the specific project is essential for reliable analysis. Specifically in neuroimaging, motion artifacts introduced in magnetic resonance imaging (MRI) acquisition can compromise the results in structural,1–3 diffusion,4 and functional5 analyses. While the effects of some acquisition artifacts can be minimized to some extent in preprocessing (e.g., intensity non-uniformity or radio frequency inhomogeneity), other artifacts like ringing patterns induced by motion or signal-loss might not be fixable. Such cases need to be identified and excluded from the analysis.
The visual inspection of data for the assessment of data quality is a painstaking and time-consuming process that is susceptible to inter-rater and test-retest variability. One of the first initiatives to address this problem was the Quality Assurance Protocol (QAP) by the International Neuroimaging Data-sharing Initiative (INDI).6 Aiming to identify potential sources of artifacts, noise and bias, the QAP comprises several image-quality metrics (IQMs) for structural and functional MRI data. Several automatic and semi-automatic QC tools have been developed for the assessment of MRI data. While automatic tools rely on algorithms and predefined criteria to automatically classify images based on their quality, semi-automatic tools combine similar algorithmic analysis with human inspection to arrive at a final decision. Pizarro et al. obtained 80% accuracy using a support vector machine algorithm to automatically categorize the structural 3D-MRIs into “usable” or “not-usable” after being trained on a set of volumetric and artifact-based IQMs combined with expert visual inspection as the ground-truth.7 Building upon the IQMs proposed in the QAP, MRIQC8 is a semi-automatic quality assessment tool that automatically extracts 64 IQMs from a T1-weighted (T1w) or T2-weighted (T2w) structural image and, from these metrics, yield a binary classification of the scan’s quality. MRIQC also includes a system of visual reports that aids manual investigation. The reports and their “Rating widget” can be used for detailed evaluation of the images flagged by the classifier or the identification of images that deviate from the group distributions of IQMs. Garcia et al. trained a Deep Learning model from a detailed manual QC-ed dataset to detect structural MRI artifacts.9 Their network, BrainQCNet, showed good performance in identifying good against poor quality scans while also reducing the computational resources required compared to other tools (1 minute to process a scan with BrainQCNet using GPU).
QA/QC does not apply only to the inspection of raw images; quality must also be verified after different processing steps such as image registration or tissue segmentation.10–12 Neuroimaging tools often have implemented features that aid the QA of their processing results: CAT12 offers the quantification of essential image parameters and a visualization tool that can be used to identify outliers13; analysis tools from FSL14 like FAST, SIENA, and FEAT produce HTML analysis reports for user inspection; FreeSurfer15 has the QA Tools script that can be used to verify all the steps in the FreeSurfer recon-all stream. FreeSurfer also produces the Euler number, a quantitative measure of the topological complexity of the reconstructed surface that out-performed other IQMs in identifying images deemed “unusable” by human raters.16 Qoala-T is a supervised-learning tool that works with Freesurfer’s segmentation and produces a single measure of scan quality ranging from 0 to 100.17 For the QC of image-to-template registration, DARQ18 and RegQCNET,19 two deep learning tools trained on expert manual QC, have proved to be effective in the identification of misregistered images based on the estimated distance to the stereotaxic space.
While automatic and semi-automatic tools reduce the significant time burden of QC in large datasets, most are designed specifically for a particular task (e.g., evaluating image quality or image registration) or imaging modality (e.g., diffusion or functional MRI), and they do not fully replace the need for visual inspection since some form of human evaluation is still needed to rate the uncertain results. For these cases and for the tasks where an automatic tool is not available (e.g., ROI segmentations performed outside FreeSurfer, inspection for incidental findings), manual curation is still the most reliable approach to QC.20
QA/QC protocols for the manual inspection of structural and functional MRI data have also been developed using a variety of tools like Freesurfer,21 pyfMRIQC22 and MRIQC together with fMRIprep.12 Even with the most detailed protocols, the usual strategy when doing visual inspection involves opening the QA tool or the generated report and logging the assessment in a separate file, conventionally a spreadsheet, repeating the process for each case to evaluate. When collaborating, individual QC files from each reviewer have to then be shared and merged. This process is both time-inefficient and difficult to do in a collaborative way.
VisualQC is a medical imaging library designed to assist the manual QA/QC of a variety of structural and functional MRI tasks.23 It was developed to assess raw scan quality, volumetric segmentation and cortical parcellation and spatial alignment. Another tool that addresses these processing steps is Mindcontrol,24 a web-based dashboard that permits the collaborative assessment of brain segmentation QC in real-time. Recently, experts have turned towards citizen science as a viable resource. Benhajali et al.,25 designed and validated a brain registration QC protocol that achieved good reliability by aggregating the ratings of non-experts recruited by a crowdsourcing platform. Similarly, Keshavan et al. used non-experts recruited online to amplify expertly labeled data for training a Deep Learning model that could predict data quality as well as specialized algorithms.26
In this paper, we introduce Qrater (Quality rater), a web-based Python application to aid QC by visual inspection. Qrater was designed to enable multiple users to simultaneously perform visual inspection of images in large databases from both local and remote computers quickly and easily.
Methods
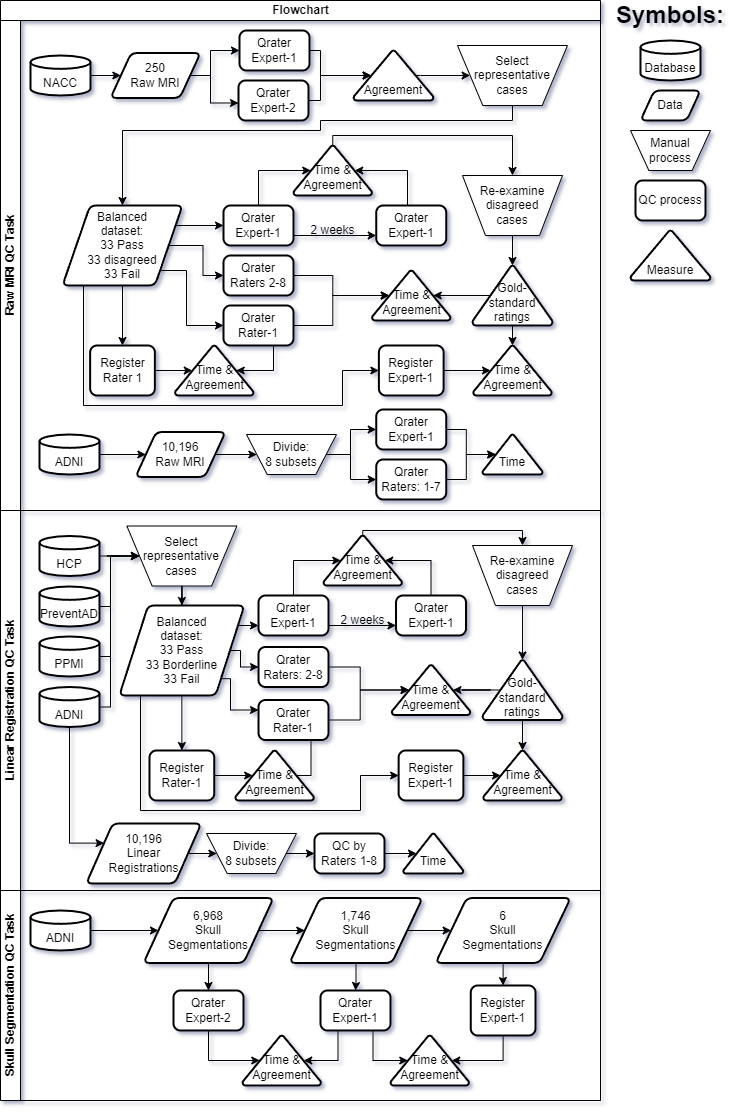
We present Qrater, a novel QA/QC tool for image data. We evaluated its performance in a series of tasks encompassing three distinct and common steps in the processing of MRI data: QC of raw MRIs, QC of linear registration of MRIs, and QC of tissue segmentation. A summary schema of the three QC tasks done in this project is presented in Figure 1.

Qrater
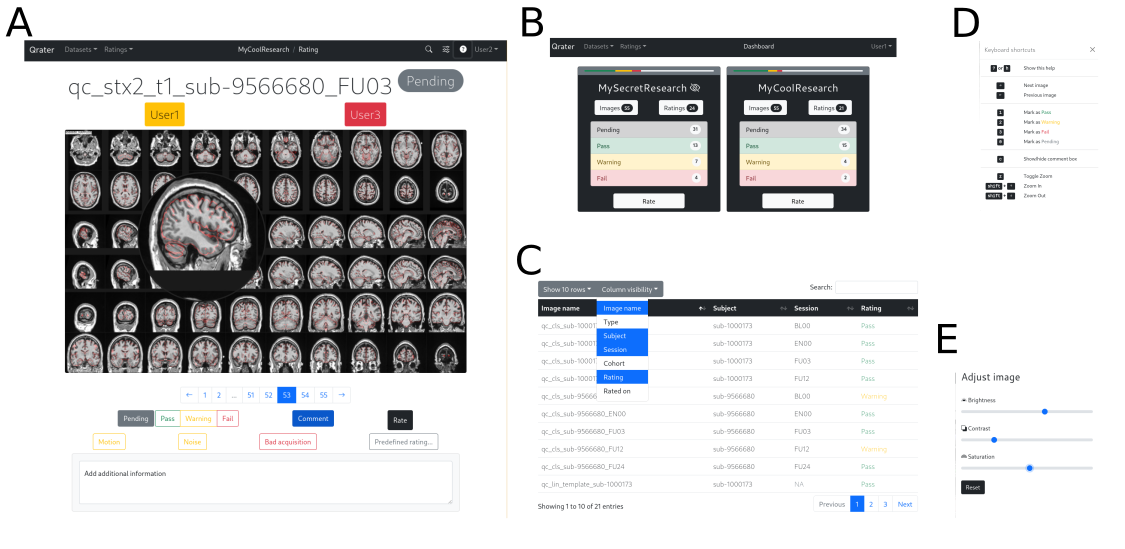
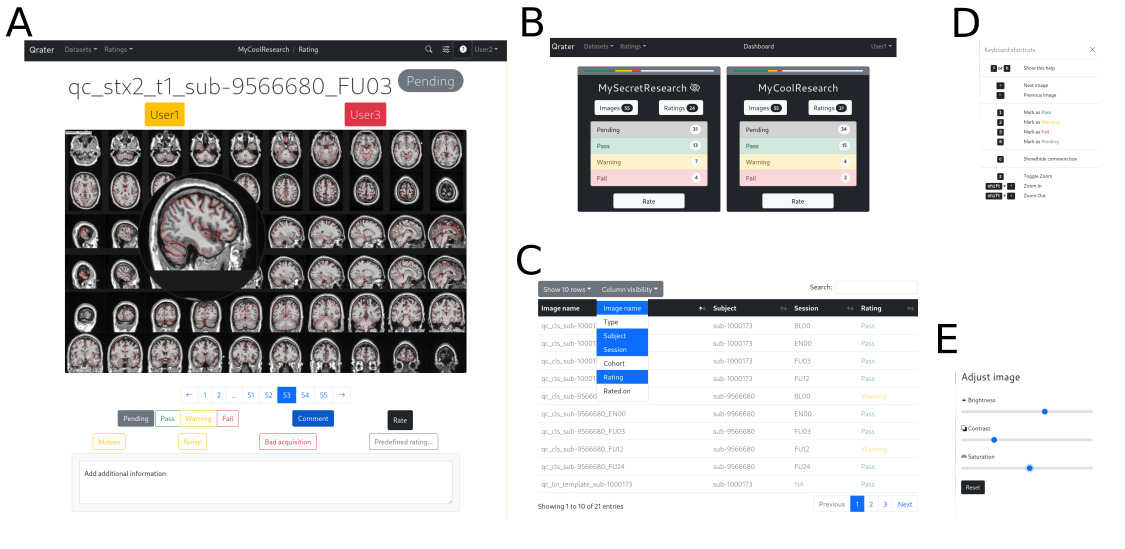
Built with Flask and managed with Docker, Qrater is a visual inspection tool from which the user can view, search, and inspect image files, record comments or notes in a user-friendly interface through the web browser. It includes image enhancement features that facilitate and speed up the visual inspection process including a magnifying glass, built-in image controls for brightness, saturation, and contrast, and key-bindings for navigation and rating (Fig. 2). All these features were implemented with JavaScript and remain consistent across all modern browsers. Its integrated WSGI HTTP server, MySQL database and Redis backend-server enables simultaneous rating by multiple users on datasets of tens of thousands of images without bottlenecks or latency issues. A detailed technical report describing Qrater’s architecture, deployment, and main features is included in the supplementary materials (S1).
Whether installed locally on a personal computer or in a High-Performing Computer (HPC) cluster, Qrater can be accessed remotely by multiple users simultaneously using a secure login procedure (e.g., SSH). Qrater works with personal user credentials to protect data and ease collaboration. Various users can visually inspect the same images without interfering with each other—up to eight users simultaneously rating the same dataset in our testing. Users can view the recorded QC rating given by others within the image viewer or on the searchable built-in database. In contrast, when working on private datasets, it is possible to restrict the visibility of the ratings to none, one, or more collaborators.
Qrater works with any kind of generated 2D image in any format supported by the web browser (e.g. JPEG or PNG) and thus it can be used for the QA/QC of raw structural, functional or diffusion MRI and PET or any processing step from which QC images or reports can be produced. This generalizability makes it highly interoperable, as it can easily integrate with other automatic or semi-automatic tools to streamline QA workflows.
Raters
Eleven raters, including two experts and nine trainees, participated in at least one of the tasks. The two imaging experts were highly experienced in MRI data processing and QC (Expert-1: 30+ years; Expert-2: 10+ years). All raters were members of the same research team and were familiar with the data and processing steps involved in the project.
The raters performed their QC remotely on their own personal computers, thus the hardware used was different for each rater. Raters could set the brightness and contrast as they saw fit, either by adjusting their monitor or using the built-in image controls.
Datasets
The MRI data used in the following experiments came from five open datasets:
1) NACC: The Uniform dataset from the National Alzheimer’s Coordinating Center (NACC) contains longitudinal data collected from the 29 Alzheimer’s Disease Centers funded by the National Institute of Aging with cognitive status ranging from cognitively normal to mild cognitive impairment to dementia. The Biomarker and Imaging dataset is a subset of the Uniform Data Set participants for which 1.5T and 3T MRI and biomarker data in the form of CSF values for aBeta, P-tau and T-tau are available.27 While there was an internal NACC QA committee and each center had an appointed QC officer responsible for ensuring data quality before submission, we were unable to find QA/QC process details specific for the imaging data.
2) ADNI: The Alzheimer’s Disease Neuroimaging Initiative (ADNI), led by Micheal W. Weiner, MD, is a multi-center and multi-scanner study of the progression of Alzheimer’s disease (AD). Launched in 2003 as a public-private partnership, ADNI intended to test whether MRI, clinical assessments and other biomarkers can be combined to accurately measure the progression of the disease28 (www.adni-info.org). ADNI data includes 1.5T and 3T scans of normal controls, individuals with mild cognitive impairment or AD patients. QC is done at the Mayo Clinic on two levels: ensuring adherence to the protocol parameters, and series-specific imaging quality. Scan quality is graded by trained raters following a 4-level scale: 1-3 are deemed acceptable and 4 as failure. We did not use this rating information in the experiments below.
3) PPMI: The Parkinson Progression Marker Initiative (PPMI) is a public–private partnership funded by the Michael J. Fox Foundation for Parkinson’s Research and other funding partners (www.ppmi-info.org/fundingpartners). PPMI is a multi-center and multi-scanner, observational and longitudinal study designed to identify Parkinson’s disease biomarkers.29 PPMI data includes 1.5T and 3T scans of normal controls and de novo Parkinson’s patients. Imaging data undergoes quality inspection that includes de-identification of the participant’s protected information, completeness of the image files, and adherence to the approved imaging protocol and parameters.
3) HCP: The Human Connectome Project (HCP) is a large-scale project aimed at mapping the structural and functional connectivity of the healthy, adult human brain. HCP data comes from healthy adults.30 All structural scans, FreeSurfer segmentations and surface outputs are manually viewed and their scan quality is rated by experienced raters. Brain anomalies are noted and further reviewed by a radiologist. As of release LS2.0, a subject QC measure is released that flags subjects and sessions with notable issues not severe enough to warrant exclusion. The possible issues include anatomical anomalies, surface imperfections, issues in the myelin map, FNIRT issues, and processing deviations done to improve processing results. We did not use this information in the experiments below.
4) PREVENT-AD: The Pre-symptomatic Evaluation of Novel or Experimental Treatments for Alzheimer’s Disease, (PREVENT-AD, http:// www.prevent-alzheimer.ca) aims to follow the clinical progression of healthy individuals with a parental history of AD dementia.31 A single rater performed visual QC of the raw anatomical images via de PREVENT-AD LORIS study interface32; QC status and comments were saved directly in this interface but were not used in the experiments below.
A summary table with the imaging parameters for these datasets is presented in Table 1.
Generated QC images
We generated a mosaic image using mincpik (from minctools v2.0, https://bic-mni.github.io/) in JPEG format for each volume to be inspected. For these images, 60 thumbnail sub-images of 256x256 pixels each were extracted from axial, sagittal, and coronal slices (20 thumbnails each) throughout the volume. The slices were selected to show representative views covering the brain from bottom to top (axial), left to right (sagittal), and back to front (coronal) for most general QC tasks. The 60 individual slices were concatenated in a single file of 2560x1536 pixels. Our anecdotal experience working with such mincpik generated images has shown that 60 images is sufficient for most whole brain QA tasks. Of course, custom QC images can be generated to facilitate specific QC/QA tasks.
This image generation process was used for the three QC tasks. The mosaic images for the linear registration task contained the registered volume in standard space with the contours of the stereotaxic template overlaid in red. For the skull segmentation task, the skull voxels were labelled in red. Additionally, 2D projections of three perspectives of 3D renderings of the segmented skull were included alongside the MRI slices. An example of the images for each QC task is shown in supplementary material S2.
QC training
While not specific to Qrater, the team of experts designed a protocol and developed training material for the QC of raw MRI data, linear registration, and skull segmentation (available in the supplementary materials S3-S5). For raw MRI, the QC criteria focused on field-of-view, noise, motion, and intensity uniformity. For the linear registration, QC criteria was based on the one used by Dadar et al.,33 which focused on symmetry, rotation, and scaling. A set of videos was created with instructions and examples of what artifacts to look for both tasks that the trainees could consult at any time. A set of transcripts of the videos extracted with summarize.tech are available as supplementary materials S6-8.
All trainees were introduced to Qrater and given time to familiarize themselves with the application and the available features that could be used (e.g. zoom, brightness, keyboard shortcuts, etc.). There were instructional meetings before the start of each QC task where the experts explained the protocol in detail and follow-up meetings in which the experts answered questions arising during the task and the questionable cases were reviewed by the whole team.
Rating Agreement
Intra- and inter-rater agreements between only two raters were assessed with Cohen’s chance-corrected kappa coefficient.34 By accounting for agreement by chance, Cohen’s kappa is stricter and yields lower values than the Sørensen-Dice coefficient often used to measure agreement in segmentations (e.g., for a Pass/Fail QC decision applied in a dataset of 100 images, if two raters agree on 75 of the images, Cohen’s Kappa would be equal to 0.5, whereas Dice Kappa would be equal to 0.75). For the inter-rater agreement of groups we used Fleiss’ Kappa, an extension of Cohen’s Kappa for evaluating the agreement of three or more raters.35 Like Cohen’s Kappa, Fleiss’ Kappa measures the degree to which the seen agreement exceeds what would be expected by chance. For both Cohen’s and Fleiss’ Kappas, we labeled the agreement according to the following standard ranges of values: “Slight”: 0.00-0.20; “Fair”: 0.21-0.40; “Moderate”: 0.41-0.60; “Substantial”: 0.61-0.80; and “Excellent”: 0.81-1.00.34
Time measurements
Raters were not aware that their timing would be measured, and they were allowed to complete the tasks at their own pace. Every rating had a timestamp marking the date and time it was recorded. Timestamps in Qrater have a discretization of one second. We used the time difference of successive timestamps as an indirect measure of the time spent rating one image, including any action in-between like zooming-in or recording a comment. Gaps longer than 15 minutes were assumed to be time spent away from the task and thus discarded. The time to finish a QC task was then defined as the sum of the time spent rating all images. Due to the non-normal distribution of the timing data in all QC tasks (statistically significant Shapiro-Wilk tests), we employed medians and non-parametric tests for their analysis. Multiple analyses on the same QC experiment were corrected for multiple comparisons with the False Discovery Rate (FDR), using the Benjamini-Hochberg procedure. When relevant, both uncorrected and corrected p-values are reported.
QC with Qrater
Raw MR images
The first QC task consisted of evaluating the quality of raw MR images. First, we assessed the inter-rater variability agreement between a group of trainees and an expert with a set of 99 pre-selected cases from the NACC, balanced to include clear passes, clear failures, and borderline Pass/Fail data. We also measured the usability of Qrater for collectively rating a complete dataset by doing QC on all the ADNI data. Both datasets are described below.
(Note that previous QC performed by the NACC and ADNI teams were not taken into account at any time during this task.)
Balanced dataset
Expert-2 first pre-selected 338 cases from the NACC dataset with varying degrees of quality marked in a previous QC process which Expert-1 QCed without prior knowledge of the distribution of Passes and Fails. Based on both experts’ ratings, Expert-2 selected the final 99 cases that would be evaluated by the trainees. The 99 selected cases included a balanced set of passing and failing images, i.e., the first 33 clear passes (agreed by both experts), the first 33 clear fails (agreed by both experts), and the first 33 borderline cases (where the two experts disagreed on the QC status). The images’ names with identifying information were changed before inspection.
Expert-1 reviewed the selected 99 images on two separate occasions using Qrater to estimate the intra-rater expert agreement. While Expert-1 was not blinded to the case identifiers between these two QC sessions, to minimize learning effects, the sessions were separated by a two-week delay. To arrive at a consensus ratings’ gold-standard, Expert-1 reexamined the images that had a different QC status between these two sessions.
The balanced dataset was loaded into 9 separate private datasets (i.e. datasets visible by only one rater) in Qrater to be evaluated by the trainees (Raters 1 to 9). None of the raters were informed of the Pass/Fail distribution of the cases until after all raters had completed the task. We measured the inter-rater agreement of the trainees and the expert’s gold-standard. We compared the median time it took to rate a single image and the QC sessions’ total times across raters and evaluated the time differences between “Pass” and “Fail” images using the Wilcoxon rank-sum test. Effect sizes were calculated using the Wilcoxon effect size r (Z statistic divided by the square root of the sample size). Finally, we examined if there was a relationship between the median time the trainees spent rating an image and the number of images agreed with Expert-1’s gold standard using Spearman’s rank correlation.
ADNI data
We used Qrater to perform QC on the 10,196 raw 3D T1w brain MRIs available from the ADNI dataset (ADNI-1, ADNI-2, ADNI-3, and ADNI-GO). Expert-2 divided the generated mosaic images into eight separate private sub-datasets (n = ~1275 images) to be inspected and rated by eight raters: Expert-1 and Raters 1 to 7 (Rater-8 and Rater-9 did not participate). The images were not stratified by diagnostic group and there was no overlap between each rater’s private sub-dataset.
To retain as much data as possible the QC protocol for this portion only was slightly modified allowing raters to assign “Warning” to the cases containing artifacts that might be correctable in downstream processing steps or that would not interfere with specific analysis.
We measured the median time spent rating a single image and the time taken to complete the exercise by each rater. Using the Kruskal-Wallis test by ranks, we also determined whether there was a difference in the median times per image across QC labels. The effect size for this difference was measured with eta squared (η2).
Linear registration of MR images
The second QC task consisted of evaluating the usability of Qrater in assessing the quality of the linear registration of the minimally processed brain MRIs into stereotactic space, a common step in many preprocessing pipelines. Like the raw MRI task, QC was done on a subset of data representing a balanced proportion of passing and failing images and the complete data available from ADNI.
All the linear registrations in this task were done using the Revised BestLinReg algorithm from the MRITOTAL technique.33 As standard space we utilized the MNI-ICBM152-2009c template.36
Balanced dataset
Using the QC records from data analyzed in another project,33 Expert-2 selected 99 cases from the ADNI, PPMI, HCP and PREVENT-AD databases randomly to build a balanced set of passing and failing images: 33 clear passes, 33 clear fails, and 33 borderline Pass/Fail cases. The latter were defined as datasets with prior QC status that differed between experts. Expert-1 inspected these selected images in two separate sessions separated by a two-week delay to estimate the expert intra-rater agreement. Expert-1 re-examined the images with differing QC status between the two sessions to obtain a consensus gold-standard.
The balanced dataset was loaded in Qrater as private datasets to be evaluated by the trainees (Raters 1 to 8). None of the raters were informed of the Pass/Fail distribution of the cases until after all raters had completed the task. We measured the inter-rater agreement between the expert’s gold standard and the trainees.
We measured the median time spent rating a single image and the QC sessions’ total times across all raters and evaluated the time differences between “Pass” and “Fail” images using the Wilcoxon rank-sum test and Wilcoxon effect size r. Finally, we examined if there was a relationship between the median time the trainees spent rating an image and the number of images agreed with Expert-1’s gold standard using Spearman’s rank correlation.
ADNI data
Eight trainees (Raters 1 to 8) evaluated the linear registrations to standard stereotaxic space of the same 10,196 T1w brain MRIs from the ADNI dataset. Expert-2 randomly divided the mosaic QC images into separate datasets to be visually inspected and QC-ed as “Pass” or “Fail”. We measured the median time spent rating a single image and the time taken to complete the exercise by each rater. We then compared the median time per image between “Pass” and “Fail” images using the Wilcoxon rank-sum test and Wilcoxon effect size r.
Skull segmentation from MR images
Lastly, we used Qrater to examine the performance of the segmentation of the skull tissue from T1w head MRIs. Using an adapted version of the random forest BISON tissue classification pipeline37 trained with simulated MRI data and manual labels from Brainweb2038 to segment bone, we segmented the skull on a subset of the ADNI dataset.
It was impossible to create a balanced dataset since this was the first time that a segmentation of this kind was QCed. For this reason, only the two experts participated in this task.
ADNI data
Expert-2 performed QC on the complete output from the skull segmentation pipeline (N = 6,968). A random subsample of 1,746 cases were also inspected by Expert-1 to evaluate inter-rater reliability. We calculated the median time taken by both experts to QC a single skull segmentation and compared the time between “Pass” and “Fail” images, using the Wilcoxon rank-sum test and Wilcoxon effect size r.
Comparison with a conventional image viewer
Finally, we compared the performance of our approach of rating mosaic images in Qrater against a more conventional/traditional visual inspection method of opening the MRI volumes in a viewer and recording the QC label in a spreadsheet in a separate window. Specifically, we explored the proportion of data that could be evaluated using this conventional method in the same amount of time that was needed when using Qrater.
The viewer used for these tasks was register (https://www.mcgill.ca/bic/software/visualization/register), a minc tool that enables the user to scroll through and view the transverse, sagittal and coronal slices of each 3D image volume.
Raw MRI
Expert-1 and Rater-1 rated again the 99 cases from the balanced dataset using register. Each rater recorded the time it took them to complete the dataset using Qrater. The timer started after the first volume was opened and the QC was done in one sitting until the timer stopped. For a fair comparison, the initial set-up of building a directory with all 99 volumes and preparing the QC spreadsheet was performed beforehand. We calculated the inter-rater agreement between expert and trainee using this method, as well as their intra-rater agreement with the ratings given using Qrater.
Linear Registration
We applied the Revised BestLinReg algorithm to the raw volumes of the 99 cases of the balanced dataset. Expert-1 and Rater-1 inspected the resulting registrations using register.
Specifically, they examined the transverse, sagittal and coronal slices of the MNI-ICBM152-2009c template in the first column, the synced registered dataset in the second column, and a mixed merged view of these two volumes in the third column. They could select the color map (grey, hot metal, spectral, red, blue, green) and the window/level for the template and registered data. In the overlap column, they could change the mixing level between the two volumes using a slider. All images were synced in their stereotaxic coordinates; placing the cursor in one image would show the same coordinate in all other images. A timer with their respective QC times using Qrater was set for each rater and the QC was done in one sitting until its end following the same procedure as with the raw MRI task.
Given that the reproduced registrations were significantly different to those used in the Qrater experiment (i.e. obvious failures on cases that were previously marked as successful, and vice versa) we only calculated the inter-rater agreement between expert and trainee using register.
Skull segmentation
Only Expert-1 evaluated the segmentations using register. The procedure consisted of using the image viewing tool register to simultaneous view the original full head MRI, the segmented voxels given by the algorithm, and the overlap between the two. Since we were interested only in the approximate relative magnitude of time saved, and not in the exact amount of time saved, a small subsample of 6 randomly selected cases was deemed sufficient. Timing was mesured with a stopwatch.
Data and code availability
Qrater is made available under the GNU General Public License (GPL) version 3.0 and the source code and documentation are publicly available online on Github (https://github.com/soffiafdz/qrater). There is also a Docker image of Qrater available on Docker Hub (https://hub.docker.com/r/soffiafdz/qrater).
The QC ratings, including the labels assigned to the complete dataset of ADNI, timing and agreement data together with the scripts required to reproduce all analyses in this paper are also uploaded to Github under a GPL-3.0 license (https://github.com/soffiafdz/qrater_analysis). The QA/QC protocols generated by the experts for the different tasks are included as supplementary material.
Given that we did not obtain from the dataset owners explicit permission to redistribute the data in any shape or form we cannot share the generated QC mosaic images. For similar reasons, since the training videos made by the experts include examples of ADNI data and we did not obtain consent from trainees, we cannot publicly share the training videos.
Results
QC with Qrater
Raw MR images: Balanced dataset
The balanced dataset of raw MRIs was constructed from the QC of a subset (n=338) of images from the NACC dataset QCed by Expert-1 and Expert-2. The experts showed fair agreement on their evaluation (K = 0.40; Z = 9.83, p < 0.001), and 99 images were selected from their agreements and disagreements. These selected images did not differ significantly in age, sex or proportion of neurodegeneration compared to the complete subset of inspected images (Table 2).
After visual inspection in two QC sessions, Expert-1 agreed with themself on 91/99 ratings, thus presenting an excellent intra-rater agreement with a Cohen’s kappa value of 0.81 (Z=8.14; p <0.001). Expert-1 re-examined the eight images that had discrepant ratings between the two evaluations and identified four as “Pass” and four as “Fail” as final decisions. The resulting gold standard for the raw MRI QC task consisted of 69 “Pass” and 30 “Fail”. The unbalanced Pass:Fail ratio is accounted for by using Cohen’s chance-corrected Kappa.
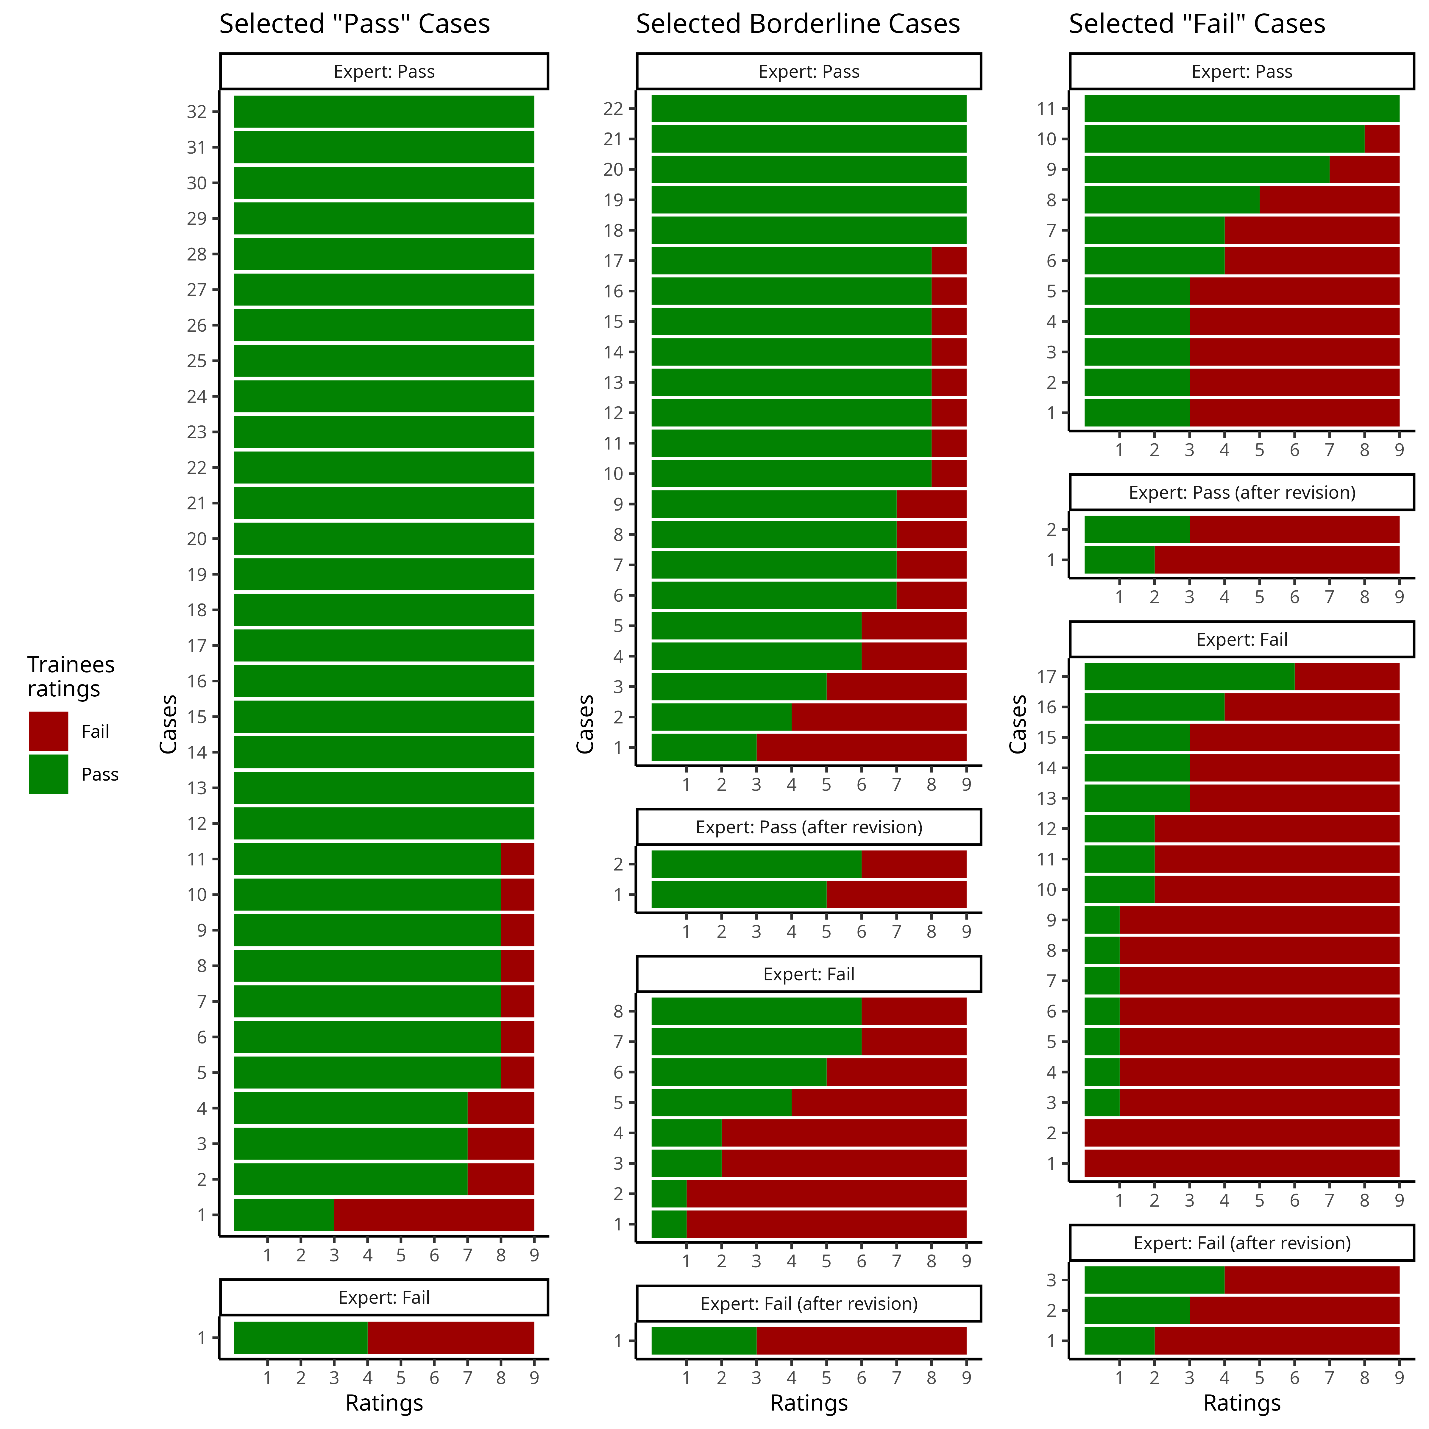
In the assessment of inter-rater agreement between Expert-1’s gold standard and the 9 trainees we observed moderate agreement with a Fleiss’ kappa value of 0.44 (Z = 32.4; p < 0.001). Ratings on 29 of the 99 cases had full agreement amongst all 10 raters (Fig. 3). From these 29 images, 21 were selected as “Pass” cases, five were selected as borderline cases, and one “Fail” case was marked as “Pass”. The two images marked as “Fail” by all raters were both from the selected “Fail” cases. All trainees agreed on 27 of the 69 cases with Expert-1’s rating of “Pass”, but only 2 cases with Expert-1’s rating of “Fail”. At least eight of the raters agreed on 67 of the 99 cases. The detailed inter-rater agreement of the expert and the trainees as a confusion matrix of the percentage of agreement between each rater are shown in the supplementary material S9.

Expert-1 took 1 hr, 42 min and 14 s to finish their first session of QC. Their second session was faster, taking them 1hr, 2 min and 40 s. Expert-1 spent a median of 44 s per image the first session, but spent a median 25 s per image in their second session (V = 3,778.5; r = 0.541; padj < 0.001). Trainees spent different amounts of time completing the 99 cases. Their QC sessions time ranged from 49 min to 5 hr 27 min. Trainees’ median times per image ranged from 15 s to 3 min. All raters spent more time before passing an image than failing it, but the significance did not survive correction for multiple comparisons (47 s vs. 41 s; W = 126,898; r = 0.064; p = 0.042, padj = 0.504). The effect size of this comparison increased when looking only at the trainee’s data (64 s vs. 42.5 s; W = 87,330; r = 0.097 p = 0.005, padj = 0.071). None of the time differences between “Pass” and “Fail” images were significant when looking at the individual rater levels. The measurements of time for all raters for the balanced dataset including the number of rests from their task are summarized in the supplementary materials (S10).
While there were only 9 trainees, there was a significant correlation between the total time it took the trainees to complete their QC and their agreement with Expert-1 (S = 28; rho = 0.767; p = 0.021).
Raw MR images: ADNI data
The demographics of the ADNI data are presented in Table 3. From the 10,196 QC images evaluated by Expert-1 & Raters 1, 92% were deemed passable (“Pass” = 9,387; “Warning” = 491; “Fail” = 319), with acceptance rates ranging from 81 to 99% across the different raters for their respective subsets. Strictness varied among the raters with Expert-1 being the least strict, flagging only 9 images and not marking any as “Warning”. Trainees marked between 0.5% and 4% of their subsets of data as “Fail” and between 2% and 7% as “Warning”.
The median time spent on each image was only 11 s, which was a significant decrease compared to the median of 51 s these same raters took on the balanced dataset of selected cases (W = 1,408,928; r = 0.270; p < 0.001, padj < 0.001). The average time of the raters to complete their QC was 10 hr and 4 min. Expert-1 was the quickest, taking 4 hrs and 9 min to complete their QC. The time of the trainees ranged between 4 hr, 23 min and 22 hr 32 min. Raters took different amounts of time to rate an image depending on the rating given (Pass: 10 s, Warning: 19 s, Fail: 17 s; X2 = 158.54; eta2 = 0.015; p < 0.001, padj < 0.001). Post-hoc analysis using Dunn’s test of multiple comparisons showed significant differences between “Fail” and “Pass” (Z = 7.219; p < 0.001) and “Pass” and “Warning” (Z = -10.598; p < 0.001), but not between “Warning” and “Fail” (Z = -1.095; p = 0.137). The time data for all raters who performed the QC of ADNI data and the post-hoc analysis are presented in the supplementary materials (S11 and S12).
Linear registration: Balanced dataset
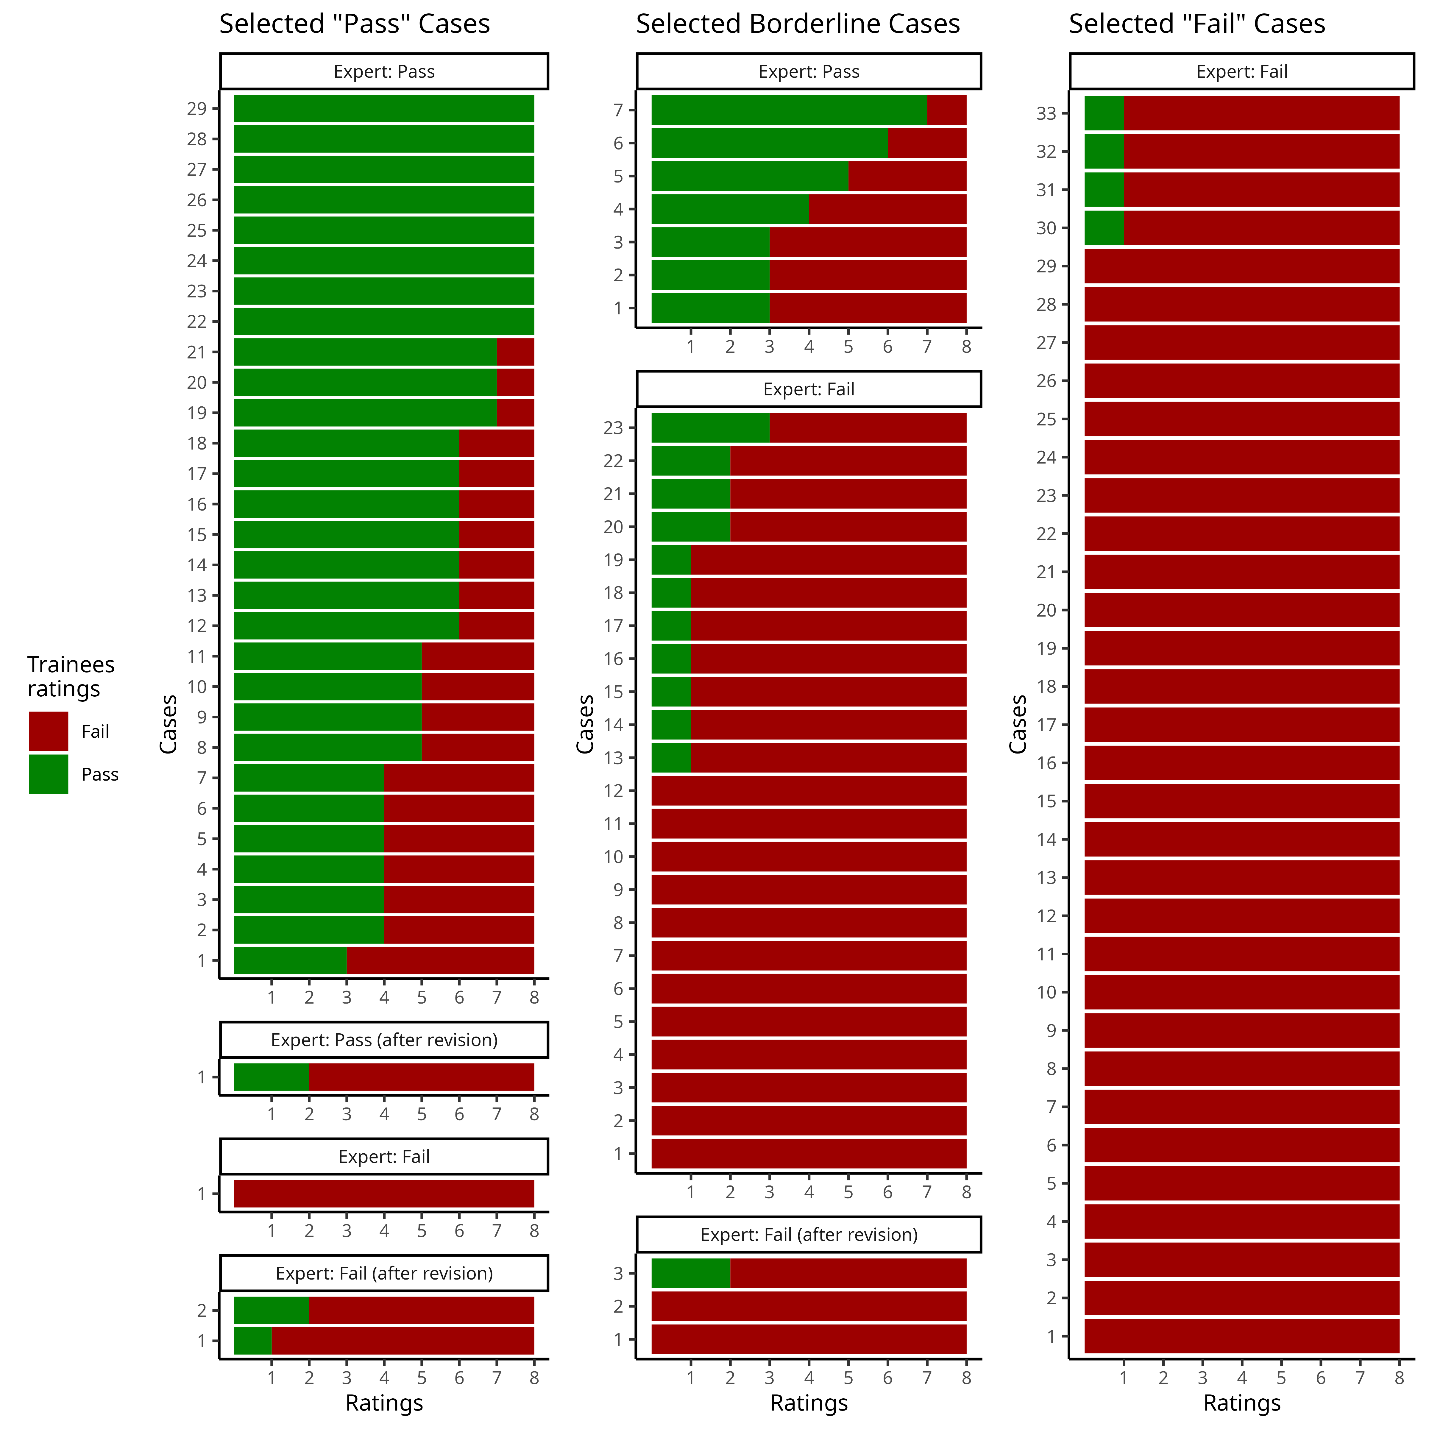
The demographic information for the preselected “Pass”, “Fail” and borderline cases of linear registration is shown on Table 4. Expert-1 showed an excellent intra-rater agreement evaluating these cases agreeing on 93 of the 99 images with a Cohen’s Kappa value of 0.87 (Z = 8.69, p < 0.001). The re-examination of the 6 conflicting images resulted in 5 “Fail” and 1 “Pass”. The gold standard for linear registration resulted in 62 “Fail” and 37 “Pass” (Fig. 4). The unbalanced Pass:Fail ratio is accounted for by using Cohen’s chance corrected Kappa.

The 8 trainees had moderate agreement with Expert-1’s ratings (K = 0.56; Z = 33.6; p < 0.001). They fully agreed with the gold-standard in 52 of the 99 cases (44 “Fail” and 8 “Pass”). In 15 other cases, all but one rater agreed with the QC label (eight out of nine raters on 11 “Fail” and 4 “Pass” cases). There was complete agreement amongst raters on 29 of the 33 preselected “Fail” cases; only one trainee marked as “Pass” the other 4 preselected “Fail” cases. Raters unanimously marked as “Fail” one of the selected “Pass” cases and 14 of the preselected borderline cases. However, of the 33 preselected “Pass” cases, only eight obtained “Pass” with complete agreement. The detailed inter-rater agreement in the form of the percentage of agreement between Expert-1 and the trainees is presented as a confusion matrix in the supplementary material S13.
Both Expert-1’s QC sessions were completed in similar times (39 min and 56 s & 35 min and 25 s). The QC sessions’ time from Raters 1 to 8 ranged from 36 min to 3 h, 19 min. All trainees spent less than one minute before assigning a rating with a median of 24 s to either pass or fail an image (W = 99,852; r = 0.006; p = 0.851). The difference was still absent when looking at only the trainees’ time data (29 s for both ratings; W = 58,110; r = 0.029; p = 0.420). The time measurements for the expert and trainees are presented in supplementary material S14. The relationship between the QC session times of the trainees and their inter-rater agreement with the expert’s gold standard was non-significant (S = 87.018; rho = -0.036; p = 0.933).
Linear registration: ADNI data
Partway through the evaluation of the ADNI data, trainees reported an unexpected high proportion of failed images. On average, raters were flagging 40% of the images (27% marked as “Fail” and 13% marked as a temporary “Warning”) which contrasted to the 1-5% expected rate of failure of our registration algorithm (Dadar et al., 2018). The task was suspended and the experts met with the trainees to have a deep technical discussion of linear registration and the reasons behind potential failures. The decision criteria was explicitly defined and codified before the trainees went back and restarted their QC. Close to a quarter of the images that had been inspected before the interruption ended with a QC label different to the one previously assigned (supplementary material S15). In the end, raters passed 94% of the data (“Pass” = 9,635; “Fail” = 561) with pass rates ranging from 90% to 98% across the trainees.
The median time raters spent on each image was 8 s, a significant decrease from the 29 s these same raters spent per image on the balanced dataset (W = 1,485,919; r = 0.271; p < 0.001, padj < 0.001). The average time to complete the QC for this dataset was 7 h, 54 min, ranging from 3 hr, 39 min to 11 h, 30 min. The time spent per image varied based on the image rating assigned (i.e., a “Passing” or “Failing” image). Raters took significantly longer to fail an image than to pass one (16 s vs. 8 s; W = 3,434,646, r = 0.119; p < 0.001, padj < 0.001). The table with the time data for the trainees is shown in the supplementary material S16.
Skull segmentation
The demographic information for both the complete set of subjects from ADNI whose skull segmentations were inspected by Expert-2 and the subset of segmentations that were evaluated by both Experts is presented in Table 5.
Only 52% (3,674) of the 6,968 output images of the skull segmentation analysis were marked as “Pass” QC by Expert-2. A similar proportion of “Pass” images resulted from the ratings of Expert-1, who passed 54% (947) of their subset of 1,746 images.
Evaluating the same 1,746 QC mosaics and 2D representations of the 3D models, Expert-1 and Expert-2 showed excellent inter-rater agreement, agreeing on 1,606 and yielding a Cohen’s kappa value of 0.83 (Z=35; p < 0.05).
This QC task was completed the fastest among the three tasks. Failing an image was significantly faster than passing it for both experts (Expert-1: mean of 3.2 s vs. 4.4 s; W = 313,240; r = 0.149; p < 0.001, padj < 0.001; Expert-2: mean of 2.7 s vs. 3.7 s; W = 4,607,049; r = 0.221; p < 0.001, padj < 0.001). Given the low variance in rating times, means are reported instead of medians. The timing data of the experts is available in the supplementary material S17.
QC with a conventional image viewer
Raw MR images
Since we expected conventional QC to take longer than Qrater, Expert-1 was instructed to do the visual inspection with register of the 99 preselected MRI cases with a timer set to 1 h, 3 min, or the time it took them to complete the QC of these images using Qrater. They managed to complete QC of 90 volumes before the time ran out. Calculating they spent on average 42 s per volume, it would have taken them 1 h, 10 min to complete the whole set. From the 90 inspected volumes, they agreed with their gold-standard on 74 showing moderate intra-rater agreement (82%; K = 0.568; Z = 5.42; p < 0.001).
The time-limit for Rater-1 was set to 1 h, 38 min. They could finish QC on 79 volumes. Spending 1 min, 14 s per volume, they would have completed the 99 volumes in approximately 2 hr. They had fair intra-rater agreement as they agreed with the ratings given on Qrater on 53 cases (71%; K = 0.339; Z = 3.22; p = 0.001).
The inter-rater agreement between expert and trainee using register was moderate; they agreed on the ratings given to 66 out of the 79 cases inspected by both of them (84%; K = 0.598; Z = 5.38; p < 0.001), slightly higher compared to the 73.74% obtained using Qrater (S8).
Linear registration
Expert-1 used register to inspect the overlap of the MRI volumes and the standard template for the 99 preselected cases of linear registration. The timer was set to 36 min, the time in which they completed the QC using Qrater. Under the time-limit they inspected 43 cases. Following the same timing of 50 s per case, we estimate 1 hr 23 min for them to complete the 99 cases.
While the time-limit for Rater-1 was similar to the expert, in 37 minutes the trainee managed to complete QC on 30 cases, or less than a third of the data. Spending on average 1 min 14 on each volume, they would have completed the 99 cases in around 2 hr.
Expert and trainee had substantial inter-rater agreement using register, agreeing on 26 out of the 30 cases inspected by both (90%; Kappa = 0.713; Z = 3.9; p < 0.001), which was slightly higher to the 83.84% of agreement using Qrater (S13).
Skull segmentation
Inspecting a random subset of 6 pairs of MR volumes and skull labels with register took a total of 6 min 45 s for Expert-1. It took them one minute per volume to evaluate the segmentation by scrolling through and inspecting the transverse and coronal slices, and in some cases also the axial slices. To complete a similar proportion of images QCed with Qrater using this method it would have taken them approximately 29 hours of active work.
Discussion
The application
Quality control is an important and non-trivial process for neuroimaging. The reliability and validity of study results and conclusions depend on good data quality and the accuracy of the analysis performed. In this article we introduce Qrater, a containerized web-based application that facilitates the often-neglected task of QC by visual curation of images.
While other semi-automatic tools focus on quantifying IQMs and generating visual reports, Qrater’s purpose focuses entirely on the process of visual curation. Qrater streamlines this process by letting the user inspect the data and record the QC assessment in a single application with its interface and built-in database. Similar to previous HTML-based QC tools from FSL, SPM and MRIQC, Qrater leverages web service technologies in the form of HTML documents and web browser with a Rating Widget where the user can record a quality label and the presence of predefined artifacts. Qrater adds to this functionality and that of other visual inspection tools like VisualQC,23 with its collaboration features. Datasets can be organized and assigned to different people. Images can be inspected by a team of raters with them being able to see each other’s assessments in real-time. These features are particularly useful for training purposes. Experts can use the application to assign QC datasets to their trainees and oversee their live evaluation process.
Since Qrater displays generated images for visual QC, Qrater compliments the automatic quantification of IQMs. Since QC images can be generated for specific QC decisions for PET, CT scans, ultrasound, and other modalities, Qrater is also versatile.
In this paper we limited our tests to evaluation of rating times and inter-subject agreement with three different MRI QC tasks. These three tasks represent several standard steps in neuroimaging analysis: inspection of raw data quality, examination of an intermediary preprocessing step, and the evaluation of the results from a segmentation algorithm.
Raw MR images
The inter-rater agreement of the experts’ evaluation of the initial 338 images of the NACC dataset was the lowest among all of the QC tasks. The low Kappa coefficient was relatively unimportant given that we were specifically interested in the cases of disagreement between the experts. Expert-1 showed an excellent intra-rater agreement on the repeated sessions of the pre-selected cases of raw MRIs. This result might be in partly affected by practice, given the test-retest exercise consisted of the second and third time that Expert-1 had rated the same images. Despite these multiple evaluations, the expert marked as “Pass” 13 of the 33 cases that both they and Expert-2 had previously deemed as “Obvious Failure” and failed one of the “Obvious Pass” cases. This result demonstrates that despite more than 30 years of QC experience looking at hundreds of thousands of images, expert QC judgment remains highly subjective – and not only for borderline cases. As noted in by Provins et al., this subjectivity in interpreting the QC rules can be reduced with carefully written visual QC protocols with precise assessment criteria tailored to specific analyses.12
With a Fleiss’ Kappa of 0.44, the inter-rater agreement of the balanced dataset between all raters was only slightly higher than the inter-rater expert agreement. Despite the fact that a third of the data was specifically selected to be questionable cases that had already been shown to produce disagreement between experts, the performance of the trainees was only slightly lower to what is present in the literature. The MRIQC team evaluated the inter-rater agreement of the QC of 100 images by two raters and had a Cohen’s Kappa value of 0.51 with binarized (e.g., pass/fail) ratings.8 When the trainees from Rosen et al. performed a similar exercise training three raters for the QC of structural MRI, they had a mean Kappa value of 0.64 in the training phase.16
The trainees recorded qualitative findings as comments independently of the rating given. Despite a disagreement on the QC label, raters who marked images as “Pass” often recorded the same artifacts in the comments as the raters who marked those same images as “Fail”. Such qualitative agreement in the comments indicates that there is likely a subjective threshold difference between raters rather than a gross misidentification of artifacts. In the follow-up discussion, several raters mentioned that they passed an image when the artifact found was thought to be mild enough (e.g., in the cases of intensity non-uniformity) to be corrected in downstream preprocessing. This is another case where the differences due to subjective interpretation of the rules might have been avoided with more precise and carefully worded QC decision rules. Future QC training protocols may need to specifically focus on agreeing on a level of strictness and precise decision criteria for rating selection in each QC task to ensure similar rating decisions between raters.
Time measurements varied greatly between the different raters, particularly on this first task. Such variability was expected given the different amounts of QC expertise of the different participants. The trainees who had higher agreement (+80%) with the expert were also the ones who took the longest time +4 h (Table 3). This result was confirmed with the significant correlation between completion time and agreement with the expert.
Raters’ median times evaluating the ADNI dataset were greatly reduced compared to their times on the balanced dataset. The reduction in time was expected due to several factors: the trainees’ lack of expertise and subsequent training effects, their knowledge that their performance would be measured and compared, and the fact that the images were intentionally pre-selected to produce doubt. This change was also observed in Expert-1, who took less time to Pass an image with each subsequent QC exercise (40 s on their first test-retest session, 25 s on their second, and 3 s on the ADNI data). This striking difference might be due to the intention of carefully building a gold standard for the rest of the raters when evaluating the balanced dataset, in contrast to just applying the already-defined rules when they were inspecting the ADNI data.
Since ADNI data has already gone through QC before being made public, we expected a very high rate of “Pass”-marked scans. Still, we instructed raters to look for issues related to field-of-view, wrap-around, noise, and movement artifacts because our quality thresholds for these characteristics were different from those used by the ADNI team. Raters failed 3% of the complete dataset, which fell within our initial expectations. Nonetheless, even with the knowledge that the ADNI team had already completed QC, raters additionally marked close to 5% of the dataset as “Warning”.
Linear registration
Both rater performance (as measured by rating time) and rater agreement improved in the QC of linear registration compared to the QC of raw MRI. Expert-1 had excellent intra-rater agreement (K = 0.87), comparable to Expert-2 who had an intra-rater agreement on 93% evaluated on 1000 datasets.33 The inter-rater agreement of the trainees with the expert’s gold-standard also improved compared to that in the raw data QC task (K = 0.56 vs K = 0.44). Our raters’ inter-rater agreement was similar to that of Benhajali et al., on which expert rater’s Cohen’s Kappa ranged from 0.4 to 0.68 on a similar validation dataset comprising 35 Fail, 35 Maybe, and 30 OK images based on one expert rater.25
Skull segmentation
The third experiment to evaluate skull segmentations further demonstrates the flexibility and efficiency of our image-based QC approach. Due to the experimental nature of our skull segmentation tool under development, the “Pass” to “Fail” ratio was, as expected, the lowest among all three experiments. This ratio was consistent for both experts. Even with the large number of failed images, the inter-rater agreement between the two experts was the highest among all tasks, being even comparable to the intra-rater agreement of Expert-1 in the raw MRI and linear registration test-retest tasks. Both expert raters took less than five seconds on most of the images before assigning a rating. Failing an image was, on average, faster than passing one. These impressive speeds were possible due to the design of our QC image that included 3D renderings of the segmented skull surface that greatly facilitated the QC task, partly because holes in the skull reconstruction were easily visible. Essentially, as soon as a segmentation error was found, the dataset could be failed without the need to examine all images within the mosaic. Both experts focused on the generated skull surface renderings, which demonstrates that designing an appropriate QC image can make the specific QC task much easier, and more efficient.
Comparison with conventional methods
After using Qrater, an expert and a trainee compared its usability by repeating the three QC tasks using the conventional method of manually inspecting the MR volumes with a dedicated 3D viewer software (i.e., register, from the minc toolkit). While evaluating the volumes with register was indeed slower than using Qrater for both raters, we did not find the stark difference we were expecting, especially for Expert-1, who managed to QC more than 90% of the data in the same amount of time as in Qrater. Notably, this expert has decades of experience using register for QC and this was their fourth time inspecting the same images, so a learning or memory effect might be present despite week-long delays between trials interleaved with evaluations of different data.
QC of linear registration demonstrated the effectiveness of Qrater. The expert was twice as fast performing QC using Qrater compared to manually inspecting the overlap of the volume and the standard template in a conventional viewer. Qrater was even more beneficial for the trainee, giving them a threefold increase in speed compared to the traditional approach. This advantage did not compromise reliability, given that the inter-rater agreement between Rater-1 and Expert-1 remained comparable for both methods.
We obtained the biggest difference in speed for the last task of QC for the skull segmentations, where Expert-1 required a 30-fold increase in time to evaluate the segmentations by visualizing the volumes of the labels with the conventional register visualization tool than they did with the mosaics and Qrater.
The inter-rater agreement between Expert and Rater was higher on both raw and linear registration tasks using the conventional method. While surprising, this increased agreement could have resulted from both the reduced number of inspected images and the practice obtained from the repeated evaluations of the same subset of data.
Qrater has significantly improved the way we complete QC in our laboratory. According to the expert raters, some of Qrater’s features such as the key-bindings, magnification, and quick loading times, helped them to complete QC of the images in a time-efficient manner. The brief time spent on the skull segmentation task (which covered ~7,000 images) demonstrates that the Qrater system offers a time-efficient and effective method to complete manual QC. Such QC tasks take much longer if the raters must use a general visualization tool to investigate the data on a slice-by-slice basis. The instance currently installed on our servers holds more than 100,000 images organized in 48 open and restricted datasets from different research projects with more than 44,000 ratings already recorded without compromising speed or functionality.
Limitations
Qrater is not without limitations. One notable aspect is its dependance on the generation of task-specific QC images outside the application. While this allows versatility across various manual QC tasks, Qrater currently relies on visual inspection and does not yet take advantage of any automatically extracted quality metrics or automatic prediction of QC status.
Given the large amount of generated QC mosaic images, we opted for JPEG as the file format in a practical trade-off between file size and image quality. JPEG is a lossy format, and its compression could have produced small artifacts in the image QC that could be confused with small susceptivity or flow artifacts. While these subtle changes may not be readily noticeable to the human eye, especially in a protocol focused on identifying gross artifacts rather than fine-grained intensity variations, in the future we would consider opting for a format with lossless compression like PNG, given that both JPEG and PNG images are supported in Qrater.
Additionally, the remote nature of all ratings introduces factors beyond our control, such as varying internet speeds and differences in computer hardware among raters that might have influenced their performance, in both time and quality, when doing their QC tasks. Relatedly, when measuring the rater’s timing, we were limited to the time differences between the latest recorded ratings. Using this indirect measure of decision-making time could have been influenced by trainee raters completing a second pass for verification or providing detailed comments.
Furthermore, blinding was not enforced for Expert-1 and Rater-1 during test-retest sessions, leading to the possibility of bias due to memory, even though the sessions were separated by at least two weeks.
We also lacked a practical way to precisely measure the time when these two raters used register as a conventional method. Each rater determined their allotted time based on their own times using Qrater, and while efforts were made to conclude assessments when the timer stopped, a level of subjectivity and self-regulation may have influenced the results.
Conclusion
In this article we presented Qrater, a novel web-based Python application for QC by image curation. From the different benchmark tests comprising various tasks done by users with different amounts of expertise, we found that designing and implementing QC protocols and training is a difficult task. Clearly defined instructions and quality thresholds are essential to reducing subjectivity in ratings to produce reliable QC results. Qrater is a valuable tool that can complement existing semi-automatic tools, ease collaboration and training for QC, making the task more accessible to beginners and faster for experienced raters.
Acknowledgments
-
This investigation was supported (in part) by (an) award(s) from the International Progressive MS Alliance, award reference number PA-1412-02420, a grant from the Canadian Institutes of Health Research, and a donation from the Famille Louise & Andre Charron.
-
Data collection and sharing for this project was funded by the Alzheimer’s Disease Neuroimaging Initiative (ADNI) (National Institutes of Health Grant U01 AG024904) and DOD ADNI (Department of Defense award number W81XWH-12-2-0012). ADNI is funded by the National Institute on Aging, the National Institute of Biomedical Imaging and Bioengineering, and through generous contributions from the following: AbbVie, Alzheimer’s Association; Alzheimer’s Drug Discovery Foundation; Araclon Biotech; BioClinica, Inc.; Biogen; Bristol-Myers Squibb Company; CereSpir, Inc.; Cogstate; Eisai Inc.; Elan Pharmaceuticals, Inc.; Eli Lilly and Company; EuroImmun; F. Hoffmann-La Roche Ltd and its affiliated company Genentech, Inc.; Fujirebio; GE Healthcare; IXICO Ltd.; Janssen Alzheimer Immunotherapy Research & Development, LLC.; Johnson & Johnson Pharmaceutical Research & Development LLC.; Lumosity; Lundbeck; Merck & Co., Inc.; Meso Scale Diagnostics, LLC.; NeuroRx Research; Neurotrack Technologies; Novartis Pharmaceuticals Corporation; Pfizer Inc.; Piramal Imaging; Servier; Takeda Pharmaceutical Company; and Transition Therapeutics. The Canadian Institutes of Health Research is providing funds to support ADNI clinical sites in Canada. Private sector contributions are facilitated by the Foundation for the National Institutes of Health (www.fnih.org). The grantee organization is the Northern California Institute for Research and Education, and the study is coordinated by the Alzheimer’s Therapeutic Research Institute at the University of Southern California. ADNI data are disseminated by the Laboratory for Neuro Imaging at the University of Southern California.
-
PPMI data was obtained from the Parkinsons Progression Markers Initiative (PPMI) database (www.ppmi-info.org/data). For up-to-date information on the study, visit www.ppmi-info.org. PPMI is sponsored and partially funded by the Michael J Fox Foundation for Parkinsons Research and funding partners, including AbbVie, Avid Radiopharmaceuticals, Biogen, Bristol-Myers Squibb, Covance, GE Healthcare, Genentech, GlaxoSmithKline (GSK), Eli Lilly and Company, Lundbeck, Merck, Meso Scale Discovery (MSD), Pfizer, Piramal Imaging, Roche, Servier, and UCB (www.ppmi-info.org/fundingpartners).
-
HCP data was obtained from the Human Connectome Project, WUMinn Consortium (Principal Investigators: David Van Essen and Kamil Ugurbil; 1U54MH091657) funded by the 16 NIH Institutes and Centers that support the NIH Blueprint for Neuroscience Research; and by the McDonnell Center for Systems Neuroscience at Washington University.
-
PREVENT-AD data were obtained from the Pre-symptomatic Evaluation of Novel or Experimental Treatments for Alzheimer’s Disease (PREVENT-AD, http://www.prevent-alzheimer.ca) program data release 3.0 (2016-11-30). Data collection and sharing for this project were supported by its sponsors, McGill University, the Fonds de Research du Quebec – Sante, the Douglas Hospital Research Centre and Foundation, the Government of Canada, the Canadian Foundation for Innovation, the Levesque Foundation, and an unrestricted gift from Pfizer Canada.
Data availability statement
Qrater is made available under the GNU General Public License (GPL) version 3.0 and the source code and documentation are publicly available online on Github (https://github.com/soffiafdz/qrater). There is also a Docker image of Qrater available on Docker Hub (https://hub.docker.com/r/soffiafdz/qrater).
The QC ratings, including the labels assigned to the complete dataset of ADNI, timing and agreement data together with the scripts required to reproduce all analyses in this paper are also uploaded to Github under a GPL-3.0 license (https://github.com/soffiafdz/qrater_analysis). The QA/QC protocols generated by the experts for the different tasks are included as supplementary material.
Given that we did not obtain from the dataset owners explicit permission to redistribute the data in any shape or form we cannot share the generated QC mosaic images. For similar reasons, since the training videos made by the experts include examples of ADNI data and we did not obtain consent from trainees, we cannot publicly share the training videos.
Conflict of interest statement
We declare that none of the authors involved in this work have any conflicts of interest to disclose.