Introduction
Throughout childhood and adolescence, the brain undergoes remarkable developmental change. From the maturation of fine motor control to the evolution of complex, logical thought, this is perhaps the most rapid period of development throughout the lifespan and encompasses natural variability among individuals. Developmental trajectories for various body measurements, such as height and weight, have traditionally been quantified, affording insight into degrees of such typical variability.1–3 Departures from typical developmental trajectories can be a warning sign and therefore mapping out these developmental trajectories is crucial. Similar trajectories have been established for brain structure and function via magnetic resonance imaging (MRI), which allows for a non-invasive quantification of brain development.4 This effort has been well-documented, with countless studies revealing interesting developmental trends in areas such as cortical morphology, brain metabolism, grey/white matter volumes, white matter microstructure,4–8 and more. Establishing typical developmental trajectories for advanced brain imaging network-level metrics are also likely to prove useful in quantifying deviations from typical developmental trends.
Assessing network-level brain connectivity has been made possible via resting-state (RS) functional MRI (fMRI). RS-fMRI effectively quantifies the synchronicity of fluctuating blood oxygenation signals between spatially disparate brain areas at rest, often interpreted as functional connectivity (FC).9,10 FC has been established as a sensitive biomarker for characterizing changes in functional organization in both the healthy and diseased brain.11–15 The application of graph theory,16 a mathematical modelling technique, has fostered a relatively new avenue of network-level neuroimaging research. Using graph theory concepts, connectomics quantifies functional network organization of the human brain by identifying complex patterns.17,18 Briefly, a network is composed of nodes (the vertices of the graph) and edges (connections that link each node), and the connectivity among them is quantified using a connectivity matrix. Topographically, an ideal network conformation is one that balances network effectiveness with the metabolic cost of maintaining that network.17,19 In the brain, this can be reflected in modular network organization, high clustering, small world topology, and/or short path length.17 Graph theory metrics enable the exploration of how this balance may present and how it changes over the course of development.
Previous studies investigating functional connectomes have demonstrated shifts from local to distributed functional organization, increasing information integration and segregation, and movement of hub locations from primary sensory regions to those involving higher cognitive functions over the course of development.20–29 Specifically, the developmental shift of brain hubs from primary regions to higher-order regions suggests more distributed networks later in adolescence and early adulthood underlying more complex higher-level cognition.20,21 Before 5 years of age, functional networks show higher local clustering and within module connectivity which subsequently switches to more long distance connections and distributed architecture with maturation.20
Such studies revealed important developmental trends but have some limitations. For example, connections in the brain are typically weighted (i.e., have varying connection strengths), directed (i.e., are bi-directional versus uni-directional), and heterogeneous (i.e., connections show positive and negative FC). Thus, an ideal graph analysis of the functional connectome characterizes connections in this comprehensive way,18 adding richness and complexity to the interpretability of results.27 However, such an ideal analysis, addressing all aspects of connectivity together (weight, directionality, heterogeneity), has not been commonly employed. Further, positive and negative connectivity valences may show distinct developmental trends important for development of higher cognitive functions. Yet, negative connectivities specifically have been understudied due to various thresholding techniques that exclude them, even though they may be neurobiologically relevant.30,31 Thus, the present study employed a weighted, directed graph analysis, examining both positive and negative connectivities, and explored five graph theory metrics in a group of typically developing children, adolescents, and young adults to quantify developmental trajectories in the functional connectome. We had three hypotheses. First, that whole-brain functional connectome metrics are associated with age, reflecting higher integration and less segregation in older participants compared to younger. Second, that connectome metrics change at different rates in each hemisphere, reflecting differing time-courses of functional specialization in the dominant versus non-dominant hemisphere. Lastly, on an exploratory level, that functional connectome metrics for negative connectivities show different trajectories compared to those for positive connectivities.
Methods
Participants
Typically developing participants were drawn from a collaborative database containing imaging data from multiple pediatric researchers’ studies at a single site. Inclusion criteria were: (1) age 6 to 24 years at time of scan, and (2) completed both a high resolution T1-weighted sequence and a resting state functional MRI (RS-fMRI) sequence. Participants were excluded if they had a history of neurodevelopmental or neurological disorders, MRI contraindications, or exhibited substantial head motion during scanning that precluded image processing. Written informed parental/guardian consent and/or participant consent/assent were acquired as part of each initial study from which participants were recruited. The University of Calgary Conjoint Research Ethics Board approved the initial studies, and consent for secondary use of deidentified imaging data was granted by each family via written informed consent.
Imaging
Imaging was performed at the Alberta Children’s Hospital (Calgary, Canada) using a 3.0 Tesla GE MR750w MRI scanner (GE Healthcare, Chicago, IL), with an MR Instruments (Minneapolis, MN) 32-channel head coil. High-resolution anatomical T1-weighted fast spoiled gradient echo (FSPGR) images were acquired in the axial plane [166-226 slices, no skip; in-plane voxel size=0.5-1.0 mm; slice thickness=0.8-1.0mm; duration~5 minutes]. RS-fMRI acquisition involved 150, 180 or 240 T2*-weighted whole brain echo planar volumes (EPI; 36 interleaved contiguous slices; voxel size=3.6mm isotropic; repetition/echo time=2000/30 ms; matrix=64 x 64; duration 6-8 minutes). During the sequence, participants were asked to focus on a centralized, black cross, while thinking of nothing specific.
Imaging Analysis
Resting state functional analysis was performed using the functional connectivity toolbox (CONN32), within Statistical Parametric Mapping (SPM12; https://www.fil.ion.ucl.ac.uk/spm/software/spm12, Wellcome Centre for Human Neuroimaging) running through Matlab (Mac i64 version R2020a, Mathworks, Natick, MA). Preprocessing consisted of the standard CONN pipeline, involving slice-timing correction, realignment, and co-registration. Co-registered T1-weighted images were segmented using standard tissue probability maps from SPM and were examined slice-by-slice to ensure segmentations were accurate. Functional and structural images were normalized into MNI space using the standard 152-average template. Functional images were smoothed with a 6mm isotropic full-width at half-maximum (FWHM) Gaussian kernel. Head motion and mean signal intensity outliers were identified using the Artifact Repair Toolbox33 (exceeding 0.9mm of translational movement). Identified volumes were subsequently scrubbed during the denoising step and band-pass filtering was performed (0.008-0.09Hz). Residual head motion was de-weighted in the general linear regression model (GLM), as were CSF and WM time courses. Participants with fewer than 100 volumes remaining after scrubbing were excluded. Global signal regression (GSR) techniques were not used on this dataset because they may induce spurious negative connectivities not present in the original data.34,35
Region of interest (ROI) analyses were performed using a total of 105 ROIs, selected from a validated atlas (FSL Harvard-Oxford atlas) within the CONN toolbox (Table S1). Brainstem, cerebellar and vermis ROIs were not included due to insufficient brain coverage in some scans. Mean functional connectivity weights between ROIs were extracted via GLM regression32 to preserve the directionality of the network,36 resulting in a weighted, directed, and heterogenous adjacency matrix for each participant. Connectivity matrices were also divided into left and right hemispheres based on ROI placements to investigate hemispheric laterality. ROIs defined as bihemispheric (N=5: medial frontal cortex, subcallosal cortex, anterior cingulate gyrus, posterior cingulate gyrus & precuneus cortex) were included in both hemispheric subgroups. To remove weaker, possibly spurious connectivities,37 matrices underwent density-based thresholding, such that only functional connectivity values greater than the 25th percentile were included in the analysis (see below). This approach allows for topology to be examined while controlling for the effects of network size.38 While some spurious connectivities may remain, their impact is limited by the calculation of weighted graph theory metrics, which account for edge strength.
Graph theory metrics
Graph theory analysis of the functional connectome was performed using five metrics (equations in Table 1) from the brain connectivity toolbox39 via Matlab (see below). The graph theory metrics explore connectivities for network edges that are both directed and weighted.18 Connectivity weights are interpreted as reflecting the “strength” of the connection between two regions. Connectivity directionality quantifies the valence (positive or negative) of signal covariance between two regions. Negative and positive functional connectivities were analyzed separately by partitioning each participant’s raw connectivity matrix into its positive and negative components. Thresholding was performed after the separation of positive and negative connections. First, an absolute threshold of 0 was used, to remove negative connections from the positive network (including only those ranging from 0 to the positive maximum). This was repeated on the complete dataset to select only the negative connectivities (including only those ranging from 0 to the negative maximum) after which the absolute value was taken. The density-based thresholding at the 25th percentile of nonzero values was then applied in the residual positive and negative networks separately. This results in the positive network containing the strongest 75% of positive connections, and the negative network having the strongest 75% of negative connections. Positive and negative weights are both neurobiologically important,30 but are not necessarily equal in magnitude.31 This separation allowed us to explore differences in developmental trends that may otherwise be obscured by an integrated approach. We also note that there is a tradeoff between specificity and sensitivity when determining a connectivity weight threshold.37 Using thresholding may reduce analysis sensitivity by inadvertently excluding real connectivities (increasing false negatives). Our intention was to increase specificity via inclusion of higher connectivity values exceeding the weight threshold (i.e., to decrease false positives) thereby removing weaker, possibly spurious connections.
Density
Density is a measurement of the overall connectivity in the network. Specifically, it is calculated as the number of supra-threshold connections divided by the total number of possible connections.
Modularity
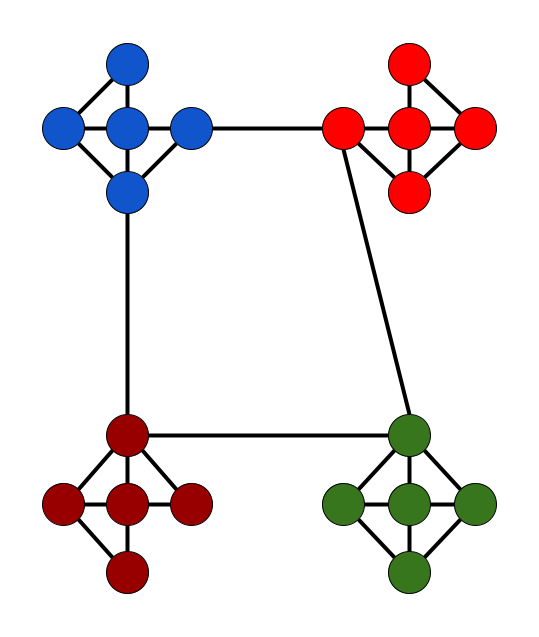
An optimized network structure is one that maximizes within-group connections while minimizing between-group connections39 (Figure 1) such that an optimal community structure is achieved. The modularity statistic defines the degree to which the network can be divided into such groups. A higher modularity reflects a network that can more easily be subdivided into structurally optimized groups.

Clustering coefficient
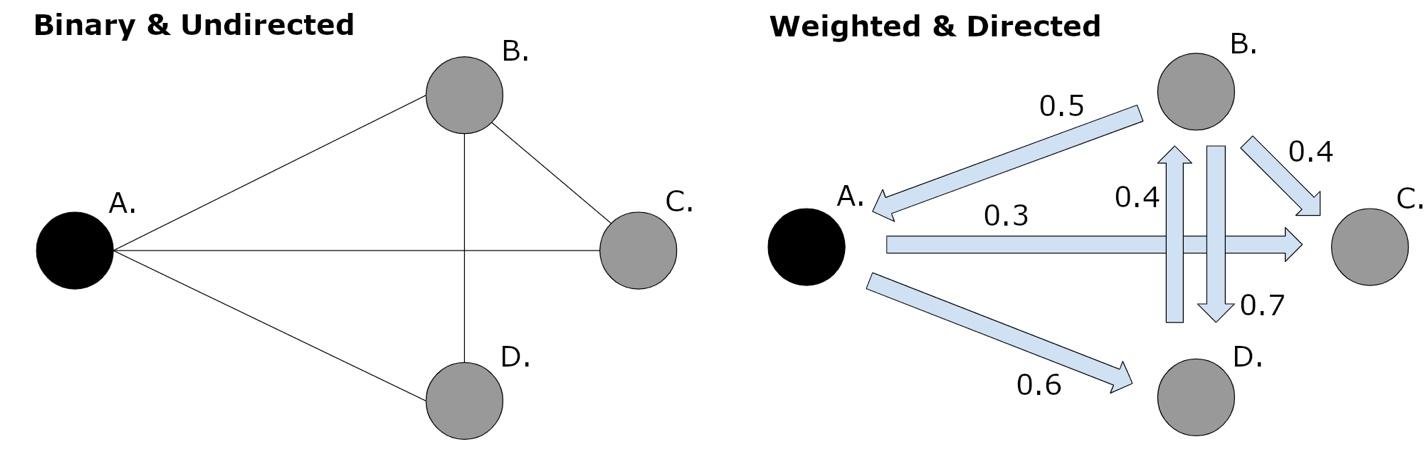
Clustering coefficient reflects how connected each of the node’s neighbours (neighbourhood) are with each other. When two neighbouring nodes have a link between them, they form a triangle, or triplet, with the original node. Clustering coefficient is calculated as the total number of triplets in the neighbourhood, divided by the total number that could potentially exist. Weight and direction both have a significant impact on clustering coefficient (Figure 2). In a weighted network, the clustering coefficient is the mean of the average weight of all edges in each triplet.

Global efficiency
Global efficiency is calculated as the average inverse shortest path length throughout all ROIs and provides a metric to characterize the overall efficiency of the network. Path lengths were calculated as 1/WeightA-B.
Betweenness centrality
This measure reflects the “centrality” of a node. It is calculated as a fraction of all the shortest paths that contain that specific node, such that a higher value indicates a node that is active in a large number of shortest paths, likely considered a relay center. Betweenness centrality was averaged across all nodes.
Statistical Analyses
Statistics were performed using Jamovi (version 1.6.23)40 and R (version 4.0.2).41 Distribution normality was determined using a Shapiro-Wilk test. Age differences between studies were tested with a Kruskal-Wallis test followed by Dwass-Steel-Critchlow-Fligner (DSCF) pairwise comparisons. Proportions of scans with 150, 180 or 240 volumes were compared with a chi-squared test. Five linear mixed effect models were used for each of the five graph theory metrics to investigate effects of age, mean head motion, sex, hemisphere, and the sex*hemisphere interaction (fixed effects) on whole brain functional network characteristics while controlling for study and individual variability (random effects). Multiple comparisons were controlled using False Discovery Rate (FDR) corrections42 for each dependent variable and predictor. Associations between head motion and age were assessed with Spearman’s rho. We also used generalized additive models for location scale and shape (GAMLSS)43,44 to model non-linear trajectories of graph theory metrics across age using linear and cubic polynomial fits. The lowest value of the generalized Akaike information criterion (GAIC) was used to determine which model (linear or non-linear) had the best fit.
Results
Population
The final population consisted of 219 participants (mean age (SD) [range] = 14.1 (3.3) [6.5-24] years, 50% female, 96% right-handed). In total, 16 participants were excluded due to missing demographic data (n=4), a missing anatomical scan (n=1), and RS scans having fewer than 100 volumes remaining after head motion artifact scrubbing (n=11). Study size varied, with the smallest study contributing 17 scans and the largest contributing 58. Age distributions differed significantly between studies (H=47.8, p<0.001), with study 4 (mean age = 11.8) being significantly younger than all except study 7 (mean age = 12.9), which was significantly younger than all others except study 2. Study was not a significant predictor in the linear mixed effect models. See Table 2. Mean head motion was negatively associated with age (rho=-0.31, p<0.001) but was not a significant predictor in the linear models (Tables 3 and 4). Mean positive and negative connectivities are illustrated in adjacency matrices in Figure S1.
Graph theory metrics for positive functional connectivity
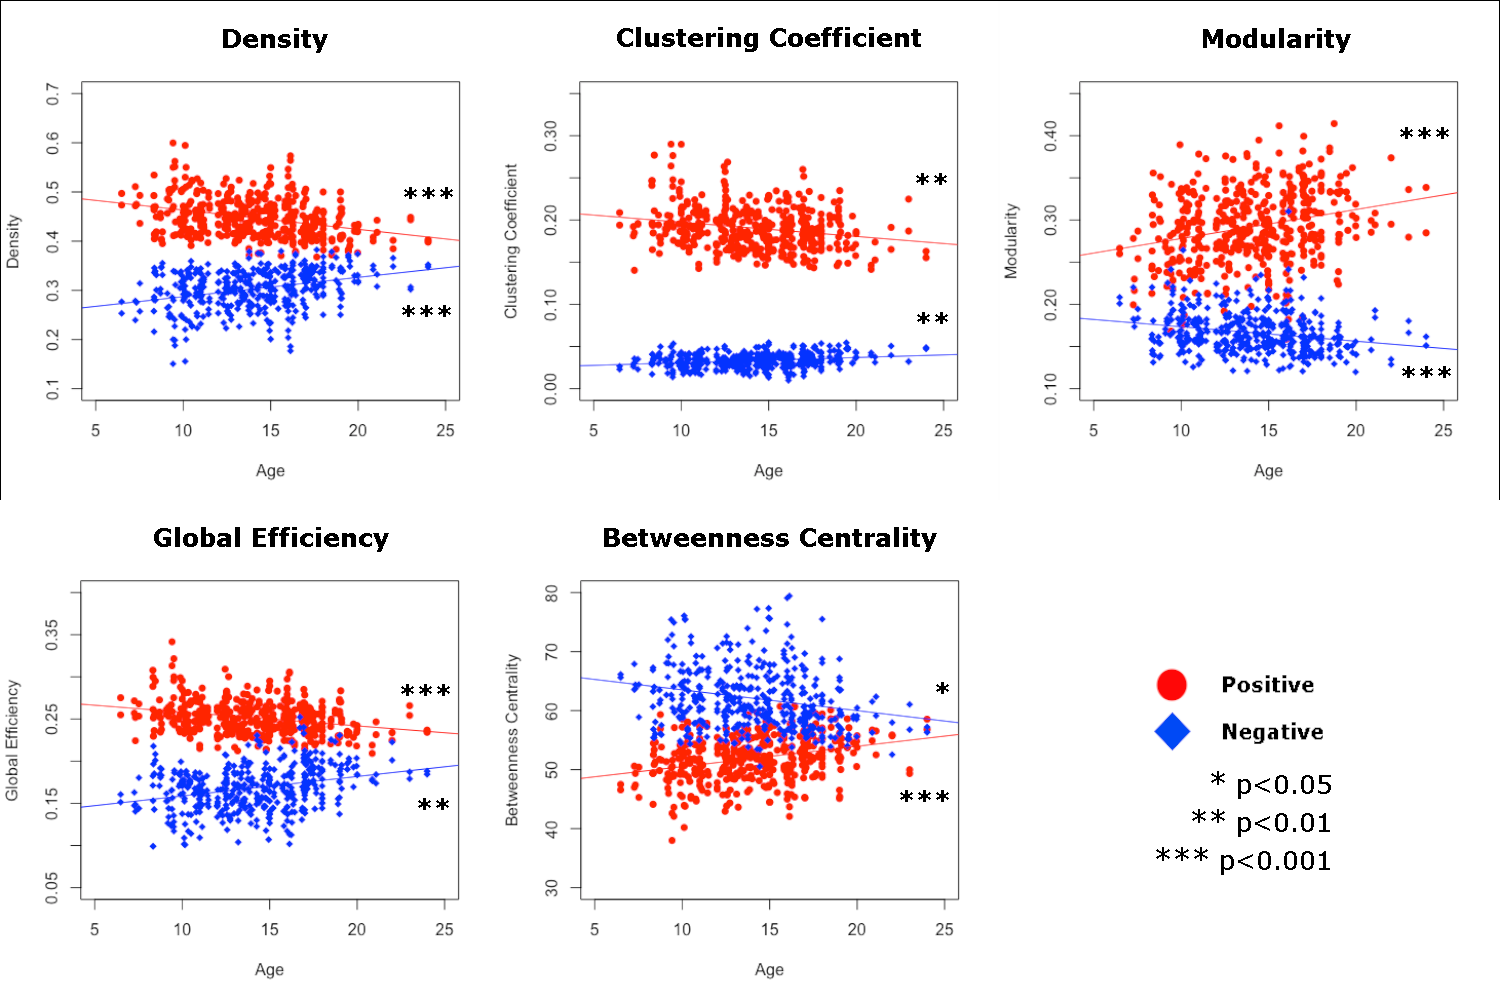
For positive functional connectivity values, age was negatively associated with density (F=20.78, p<0.001), clustering coefficient (F=8.34, p=0.004), and global efficiency (F=13.99, p<0.001). Conversely, age was positively associated with modularity (F=13.11, p<0.001) and betweenness centrality (F=23.58, p<0.001). Neither sex nor hemisphere was significantly associated with graph theory metrics, nor was the sex by hemisphere interaction following FDR correction. See Table 3 & Figure 3 (Red circles). Linear GAMLSS models for efficiency and betweenness centrality across age had lower GAIC values compared to non-linear models, indicating better fits for linear models. For density, modularity, and clustering coefficient, non-linear models had slightly lower GAIC values, however best fit lines showed largely linear trajectories.
Graph theory metrics for negative functional connectivity
For negative functional connectivity values, age was positively associated with density (F=20.78, p<0.001), clustering coefficient (F=11.04, p=0.001), and global efficiency (F=8.75, p=0.003). Conversely, age was negatively associated with modularity (F=12.42, p<0.001) and betweenness centrality (F=6.15, p=0.014). Global efficiency was higher in the right hemisphere (F=10.94, p=0.001). Sex was not significantly related to graph theory metrics for negative functional connectivity. See Table 4 & Figure 3 (Blue diamonds). Linear GAMLSS models for global efficiency and clustering coefficient across age had lower GAIC values compared to non-linear models, indicating better fits for linear models. For density, modularity, and betweenness centrality, non-linear fits were slightly better, though again best fit lines showed largely linear patterns.
_and_negative_(blue_dia.png)
Discussion
Using resting state FC and graph theory, we have demonstrated age-related developmental trends in multiple graph theory metrics over the course of childhood, adolescence, and early adulthood (ages 6-24 years). Results provide insight into how organization of the positive and negative functional connectomes develop with age. For positive FC, network density, clustering coefficient, and global efficiency all decreased with age, while modularity and betweenness centrality increased. By contrast, for negative FC, network density, clustering coefficient, and global efficiency increased with age, whereas modularity and betweenness centrality decreased. These seemingly opposite developmental trends for positive and negative FC may inform how functional connectome organization changes through childhood and adolescence, eventually resulting in an efficient and balanced, adult-like network topology.
Positive and Negative Weights
We have identified distinct developmental trajectories for positive and negative connectivity weights within our sample using multiple graph theory metrics, though the role of negative FC remains controversial and interpretation is challenging.34,45 Positively weighted correlations between brain areas are more straightforward to interpret, seemly reflecting functional connectivity via BOLD fluctuations that covary synchronously in time. Negative correlations are more difficult to interpret as BOLD fluctuations vary in an anticorrelated manner and interpreting these opposing patterns is not straightforward. Imaging processing techniques such as GSR34 as well as the presence of underlying neurophysiological signals46 have been implicated as sources of spurious negative correlations between networks, though robust negative correlations with putative neural origins remain after correction and are neurobiologically interesting.46 For example, anti-correlations between the frontoparietal attention network and default mode network during resting state data acquisition show similar spatial patterns to functionally-opposed task-positive (during an attentionally-demanding task) and task-negative (stimulus-independent thought) activation patterns during task fMRI giving plausibility to neural origins.10 That the strength of this association can be additionally modulated by task performance, is another compelling argument for the importance of such anticorrelations.10 The specifics of what underlying brain biomarker negative correlations encode remains elusive, though the presence of a central executive switching mechanism has been suggested.10,47 Another intriguing possibility is that intrinsic correlations and anticorrelations somehow maintain balance between excitatory and inhibitory brain mechanisms. We and others have shown that both positive and negative weights may have differing roles underlying network characteristics such as modularity and centrality.31 Certainly, the differing developmental trends and valence of such functional connectivity weights within a more complex whole-brain connectome is worthy of further exploration and may show fundamentally different but important roles in network development.
Network Density
Network density reflects the number of supra-threshold connections compared to all possible connections in a network and can be considered a proxy for the overall metabolic cost of the network.39,48 For positive FC, we showed that network density decreased with age. A reduction in network density during development may reflect activity-dependent synaptic pruning where some synapses are eliminated and others are strengthened and elaborated49 to maximize efficiency and reduce overall metabolic cost of the network.17,19,48,50,51 While much of this pruning is known to occur in the first two years of life, an additional major period of pruning occurs in adolescence, with a steady decrease in synapse density occurring in between.49 The reduction and refinement of synapses during this period additionally parallels the development of FC networks.52 Developmental trends in the strengthening of networks start with primary sensory networks (vision, audition, sensorimotor) at earlier ages and are followed by higher-level networks (salience, frontoparietal) and a subsequent refinement during adolescence.52 Our finding of decreasing network density is consistent with this pruning, followed by refinement and strengthening of retained connections. Conversely, we found an increase in density for negative connections suggesting higher levels of negative FC for older participants. This is consistent with the emergence of negative FC between networks occurring between 13-17 years followed by stabilization between (or after) 18-20 years of age.53,54 This time course also parallels development of higher-order cognitive functions in later adolescence,55 and a concurrent increase in inhibitory control.56,57 This may reflect a maturational balancing of network correlations and anticorrelations,10,54 ultimately resulting in adult-like network topology.
Functional Segregation
Two related, though independent, measures of network segregation are modularity and clustering coefficient; these reflect the capacity for specialized processing to occur in localized clusters. High modularity reflects maximal within-group and minimal between-group connectivity, suggesting densely interconnected groups of regions.39 We found a positive association between modularity and age for positive connections, consistent with some previous developmental studies.20,58–61 Although, some studies have found no change in modularity over age,15,21 while others (for binary networks) demonstrated an inverted U-shape function, increasing initially and then decreasing in early adulthood.62 By contrast, we found that modularity for negative connectivity systematically decreased with age. This finding is consistent with increasing levels of negative FC between task-positive and task-negative networks as children and adolescents develop.52,54 Furthermore, these findings may be driven by an increase in within-network positive weights accompanied by an increase in between-network negative weights, which would reflect a highly modular integrated network according to a specialized model of modularity.31 Clustering coefficient, a measure of local connectivity (i.e., triplets of nodes) within modules, decreased with age for positive and increased with age for negative FC. These opposite findings may suggest an age-related decrease in local clustered (positive) connectivity within nodes and their immediate neighbours, possibly related to the aforementioned synaptic pruning, coupled with an increase in negative FC density.54 This also appears to be consistent with a developmental trend from local to distributed networks, as has been repeatedly demonstrated.15,21
Functional Integration
Functional integration reflects a network’s ability to effectively integrate information from distributed brain regions.39 Global efficiency is the average inverse shortest path length and higher values reflect potentially more network integration between brain regions. We show that global efficiency for positive FC decreased with age, suggesting a developmental increase in path length consistent with the documented trend from local to distributed connectivity.21 Our findings of an increase in global efficiency for negative FC is consistent with the presence of more negative statistical associations within functional paths, which has been previously demonstrated via increasing negative functional connectivity with age.54 Betweenness centrality reflects the number of times a given node occurs on a shortest path and may be indicative of a relay hub bridging disparate nodes.39,63 Our finding of increasing betweenness centrality over development suggests higher reliance on integrative relay hubs with increasing age, whereas a decrease in betweenness centrality for negative FC with age reflects a decrease in relay hubs potentially consistent with the trend towards distributed negative connectivity.21
Balance between network segregation and integration
Finding an efficient balance between the opposing demands of network segregation and integration, in the form of a “small-world” network, is the ideal brain topology,39,50,64,65 which can be approximated by modularity.17,25 This architecture allows for high clustering while retaining relatively short average path lengths.65 The results we describe here provide evidence for how such topology develops through childhood, adolescence, and young adulthood. Specifically, the positive connection network seems to exhibit a shift towards a more “regular” conformation more typically associated with “small-world” architecture.21 Such a shift is characterized by longer average path length, as a result of fewer connections between neighbourhoods and higher local connectivity within neighbourhoods.21,65 This is consistent with the present findings of increased modularity with age (lower between-group connectivity and/or higher within-group connectivity), increased betweenness centrality with age (fewer connections between-neighbourhoods fosters a reliance on relay-hubs), and decreased global efficiency with age (“regular” networks have longer average path lengths). While global efficiency and betweenness centrality are both related to functional integration, the opposing trends provide a good example of how the brain may achieve an optimal balance between integration and segregation.
Similarly, the decrease in average clustering coefficient seemingly contradicts the increase in modularity. However, our findings that network density decreases with age may have implications for whole-brain averaging of clustering coefficient, possibly masking subtle or focal effects occurring in certain sub-sets of nodes.18 Also, clustering coefficient measures the connectivity of a node’s neighbours, regardless of whether or not they belong in the same “group”.51 Given that modularity increases with age, it is plausible that clustering coefficient in specific sub-sets of nodes (existing in the same “group”) is maintained or improved, while the observed decrease in average clustering coefficient is related to a decrease in connection density elsewhere in the network.
The negative connection network seemingly follows the opposite trend, expanding into a more “random” conformation with more long-range communication. This is supported by the decreases in modularity (more between-group connectivity and/or lower within-group connectivity) and betweenness centrality with age (more between-group connections reduces the need for relay-hubs), as well as the increase in global efficiency with age (“random” networks have shorter characteristic path lengths). These dynamic changes across development for both positive and negative connectomes provide preliminary evidence for how the developing brain establishes a balance between network segregation and integration to approximate network “small-worldness”, possibly accompanied by later refinement for negative FC. More specific time courses for establishment of such development and refinements could be more closely examined by longitudinal analyses.
Hemisphere and Sex Differences
We did not find clear hemispheric differences in graph theory metric trajectories despite our original hypothesis that the dominant (left) hemisphere would show different patterns and time-courses of development for our primarily right-handed participants. In fact, only global efficiency for negative FC was significantly higher in the right hemisphere than the left, suggesting that path lengths in the right hemisphere are shorter than those of the left. This finding is somewhat unclear; however, the typically language-specialized left hemisphere may have relatively longer connections (manifested as lower global efficiency) that are useful for integrating spatially distributed language areas (Broca’s area in the inferior frontal gyrus and Wernicke’s area in the posterior superior temporal sulcus). Why this hemispheric difference was only found for negative and not positive FC requires more investigation. We additionally found no differences in graph theory metrics for sex, and no sex by hemisphere interaction, despite our hypotheses that sex may mediate distinct trajectories. FC at the network level may be very similar between the sexes before age 24 and any differences may become apparent later in life, though other studies have found differential effects of sex and pubertal status on functional connectome graph theory metrics.22
Limitations
This study has some limitations to consider. We explored the development of the resting state functional connectome with weighted, directed, and heterogeneous graph theory metrics at a whole-brain and hemispheric level. Because the functional connectome is based on statistical associations between nodes, the interpretation of path-based differences can be challenging since such statistical associations do not correspond to information flow through known anatomical connectivity.39 Additional analyses could have investigated developmental trajectories for FC in individual functional networks which many studies have previously done. We chose not to do this in the present study since using various subsets of ROIs would have resulted in small networks (6-18 nodes) for which graph theory metric interpretability may be limited. We have related our findings to previous specific network-based studies and though direct comparisons cannot be made due to differing methods, similarities in general trends over the course of development can still provide insight. Using a finer-grained atlas (with smaller ROIs) would have enabled such specific network-based analyses and also reduced the effect of coarse spatial resolution on anatomical interpretability in such a case. Similarly, cross-region blurring can be induced by spatial smoothing prior to ROI segmentation, which may increase the weight of short edges in the network.66 Future studies should consider spatial smoothing only after anatomical segmentation. Clustering coefficient and betweenness centrality were averaged across all nodes, possibly obscuring distinct trajectories within smaller networks of interest.18 We selected only five commonly used graph theory metrics but more metrics could be explored. We used a cross-sectional dataset to characterize developmental trajectories; longitudinal sampling using a wider age range would have provided a richer characterization of developmental trends. Leveraging massive sample sizes from collaborative databases such as the ABCD67 and Human Connectome Development68 projects would also have provided additional sampling as well as longitudinal data, though multi-site acquisition would necessitate harmonization, a consideration not required in the present study. Our sample was consistent in age and sex distribution to these large databases and as such we would expect consistent findings. Additionally, including information on pubertal status may have been similarly informative. While carefully corrected for, head motion is a ubiquitous challenge and correlates with age, potentially obscuring developmental changes in functional connectivity strengths.69,70 However, given that head motion was not a significant predictor of any of our metrics, we expect its impact to be minimal. Short scan duration may limit the precision of resting state analyses,71 and when possible, we suggest longer sequences be used. Lastly, comparing trajectories based on different age ranges may explain some inconsistencies in the literature. Specifically, general trends of increases and decreases in various metrics will change depending on whether the trajectory is based on a wide lifespan sample or based on more truncated ranges specifically examining early (0-5 years) or wider development (5-20 years). Future studies leveraging very large samples and wide age ranges coupled with powerful but flexible statistical modelling44 will likely provide insight into clinically important brain changes over the lifespan.
Conclusion
We used graph theory to quantify developmental trajectories of the functional connectome across childhood, adolescence, and early adulthood in a group of neurotypical participants. The functional connectome appears to develop through childhood and adolescence such that the positive connection network develops “small-world” topology, increasing cost-efficiency, while the negative connection network expands with age, suggesting increasing network integration. The precise nature of the interaction between the positive and negative connection networks remains unknown. Ultimately, our results demonstrate developmental changes to the functional connectome from childhood to early adulthood that help achieve a balance between network segregation and integration.
CRediT Author Contributions
JH: Methodology, Formal analysis, Investigation, Writing – Original draft, Visualization, Software. BTC: Software, Writing – Review & editing. AH: Writing – Review & editing. EKL: Software, Writing – Review & editing. KOY, FPM, JM, MN, BLB, KB, CL: Resources, Writing – Review & editing. AK: Conceptualization, Resources, Data curation, Writing – review & editing, Supervision, Project administration, Funding acquisition. HLC: Conceptualization, Methodology, Formal analysis, Data curation, Writing – Original draft, Writing – Review & editing, Visualization, Supervision
Data and Code Availability
Code and a dataset with deidentified participant data will be made available upon reasonable request from any qualified investigator, subject to a signed data access agreement.
Acknowledgements
We would like to thank the children and families who took part in this research. Research support was kindly provided by the Canadian Institutes of Health Research (CIHR) and the Alberta Children’s Hospital Foundation.
Conflicts of Interest
Brian Brooks receives royalties for the sales of the Pediatric Forensic Neuropsychology textbook (Oxford University Press), the Child and Adolescent Memory Profile (ChAMP, Sherman and Brooks, 2015, PAR Inc.), the Memory Validity Profile (MVP, Sherman and Brooks, 2015, PAR Inc.), and the Multidimensional Everyday Memory Ratings for Youth (MEMRY, Sherman and Brooks, 2017, PAR Inc.). Brian Brooks has a private practice where he evaluates youth and adults. Brian Brooks also declares receiving honoraria for speaking engagements and external grants for research.
Keith Yeates receives an editorial stipend from the American Psychological Association. He is a principal investigator (PI) on grants from the Canadian Institutes of Health Research (CIHR), and a co-investigator on grants from CIHR, the US National Institutes of Health (NIH), Brain Canada Foundation, and National Football League Scientific Advisory Board. He receives book royalties from Guilford Press and Cambridge University Press. He has received travel support and honorarium for presentations to multiple organizations. He has served or serves on the following committees/boards for which he receives honorarium: Independent Data Monitoring Committee (IDMC), Care for Post-Concussive Symptoms Effectiveness (CARE4PCS-2) Trial, National Institute for Child Health and Human Development; Observational Study Monitoring Board (OSMB), Approaches and Decisions in Acute Pediatric TBI (ADAPT) Trial, National Institute of Neurological Disorders and Stroke; National Research Advisory Council, National Pediatric Rehabilitation Resource Center, Center for Pediatric Rehabilitation: Growing Research, Education, and Sharing Science (C-PROGRESS), Virginia Tech University.