


Introduction
Attention and inhibition are known to decline during normal aging.1–3 These declines can have a detrimental impact on individuals’ autonomy by interfering with daily activities. Attention is the ability to select specific information in the environment -such as sounds- while ignoring other information, as well as the ability to quickly redirect one’s attention and change one’s course of action when faced with potentially threatening or rewarding stimuli. Attentional capacity affects all aspects of human behaviour, including simple tasks such as walking,4 to more complex tasks such as driving5 and interpersonal communication.6 Several brain regions are implicated in attention, forming the (relatively) right-sided attention system, which can be divided into three partially overlapping networks: alert, orientation, and executive,7 and sometimes four, with inhibition as the fourth network.8 For Petersen & Posner,8 inhibition -or self-regulation- is the ability to control oneself, which includes the ability to ignore salient and distracting information.
Given the importance of attentional and inhibitory control in day-to-day life, finding ways to improve, or at least maintain, attention and inhibition at an older age is a priority. There is evidence to suggest that practising certain kinds of cognitively demanding leisure activity could help reduce the impact of aging on cognition through neuroplastic changes.9,10 Musical activities, like singing and playing an instrument, are one kind of leisure activity that could have an impact on executive functions, particularly in the attention system. Musical activities are complex due to several attentional and inhibitory control demands, even more when practised in group, because there is a high demand for the detection of and response to a variety of stimuli.11 Visual attention is needed to read music, follow other musicians’ movements and the conductor directions. Auditory attention is needed to monitor one’s own melody while tracking the melody made by the other musicians. Thus, the complexity of musical activities -as well as their universality and popularity- makes them a good candidate to study the effects of long-time training on attention and inhibition during aging. Consistent with this notion, it has been shown that young adult professional pianists have a more efficient executive network compared to non-musicians and that the efficiency of this network increases with more years of practice.12 In some studies, instrumentalists had better attention compared to non-musicians13,14 and instrumentalists and singers had better inhibition compared to non-musicians at an older age.13–18 However, other studies have shown no difference in attentional capacities between musicians and non-musicians.19–25 In short, the effect of practising a musical activity on attention and inhibition remains to be clarified.
One possibility is that practising a musical activity in and of itself is not sufficient to trigger plastic changes and -potentially- transfer in the cognitive domains. Practice-related factors, including the age of onset and the number of years of practice, may have a moderating role. It has been shown that musicians with fewer years of practice were less efficient at an inhibition task than musicians with more experience.16 However, measuring experience is a complex endeavour. It is likely that the estimated number of hours of practice – a metric that has been used in several studies26 – is not sufficient for measuring experience, which amounts to more than a number of years. Two musicians could have the same number of hours of practice across their lifetime but that could reflect widely different experiences, e.g., 1000 hours of practice over 10 years is the equivalent of ~ 2h/week while the same number of hours over 4 years is equivalent to ~ 5h/week. Further, 20 years of practice for someone aged 25 years vs. someone aged 65 reflect vastly different experiences. Thus, having a composite measure of general practice experience that takes into account different factors might more accurately capture the complexity of one’s musical experience. In this study, we created a composite score of musicians’ experience.
MRI studies have shown that the aged brain can change structurally through the practice of different kinds of activities.27–29 According to the Scaffolding Theory of Aging and Cognition (STAC-r), life course experiences (long-time training) and short-term interventions (short time training) induce different plasticity mechanisms.30 To maintain cognitive functions while aging, both types of learning experience would trigger “compensatory scaffolding”, resulting in an expansion outside of the core neural networks. In addition to triggering compensatory scaffolding, life course experiences would also have a direct impact on brain structure and function within the core networks. While the STAC-r can (generally speaking) predict where plasticity can occur (within/outside core networks), it does not indicate how. Other models have proposed mechanisms to explain how plasticity is expressed. The brain reserve hypothesis (BR) and the Expansion and Renormalization model (ER) propose different mechanisms. The BR is defined as the neurobiological capital of the brain31 (i.e., the cellular component like the number of cells). This hypothesis proposes that with increased experience, there is an increase in grey matter volume, which is followed by a stabilization period. Evidence for this has been shown in the prefrontal, superior parietal, superior temporal regions, and auditory and insular cortices of professional and amateur instrumentalists compared to non-musicians32–36 and of professional37 and amateur38 singers compared to non-singers. Kleber et al.37 found that, after the age of 14, the higher the age of onset, the lesser the grey matter volume in the somatosensory cortex and in the rostral supramarginal gyrus. In contrast to the BR hypothesis, the ER model39 proposes that training initially leads to an increase in grey matter volume, but as performance reaches its peak, the volume returns to baseline. Supporting evidence for this model comes from studies in young instrumentalists with absolute pitch abilities, where those with lower proficiency exhibited a thicker cortex compared to their more skilled counterparts.32 This suggests that the BR hypothesis and the ER model may be more closely linked to the specifics of experience and performance rather than being specific to particular brain regions.
A question that remains open is whether different musical activities uniquely affect brain structure during aging and, consequently, uniquely influence executive functions. It has been suggested that engaging in different musical activities could lead to differences in cognitive abilities14,40,41 and in brain structure.42 Indeed, the specific demands of vocal versus instrumental training may lead to distinct cognitive and neural adaptations. Singers rely heavily on the precise control of their own body as their primary instrument. This entails complex coordination of respiratory, phonatory, and articulatory systems, which may enhance skills such as oral motor control, interoception, and self-monitoring (e.g., breath support, vocal tension). Singing also requires sustained auditory attention to monitor pitch, tone, and vocal quality in real time, often in the presence of other vocalists or instrumental accompaniment, forcing singers not only to focus on their own voice but also on group dynamics, especially in choral settings. This dual attentional load (self and others) may lead singers to develop strong divided and sustained attention skills. Further, group singers must learn to balance their output with others to maintain harmony. In contrast, instrumentalists focus on fine motor control of external instruments, which may promote visuospatial skills, manual dexterity, and external sensory-motor integration. For instrumentalists, attentional control is closely tied to visuospatial processing (e.g., for music reading), as they track their instrument’s physical properties (e.g., strings, keys) and interpret dynamic changes in musical notation. Solo performance settings may further hone selective attention, as they filter out distractions to focus on highly demanding motor tasks. Singers are therefore likely to outperform instrumentalists in tasks requiring simultaneously monitoring of internal states (e.g., breath control) and external dynamics (e.g., ensemble coordination), as their practice integrates both skills. Conversely, instrumentalists may excel in tasks requiring fine-grained visuospatial focus, as their practice involves continuous integration of motor actions with visual input, such as reading music and navigating their instrument. These differences could have practical implications for understanding how different forms of musical training influence cognitive aging and brain plasticity.
However, most studies have focused on either instrumentalists or singers.32–38 Thus, whether singing and playing a musical instrument have a unique impact on the brain remains unknown. One study examined the asymmetry in Heschl’s gyrus in singers and people playing different instruments.43 The results show that Heschl’s gyrus asymmetry in singers was similar to that in organ, strings, woodwind and brass players, but differed from that of piano, guitar, flute, trumpet and percussion players. More recently, a study comparing professional dancers, professional musicians, and untrained controls found that dancers and musicians had thicker cortex in the temporal lobe compared to controls, while musicians also had thicker cortex in the right postcentral gyrus and right middle occipital gyrus,44 suggesting partly distinct impacts, though additional evidence is needed. Thus, neuroplasticity associated with musical activity may, to some extent, depend on the type of activity.
The present study focuses on the aging of cortical thickness in the attentional system of amateur singers and instrument players. The first objective was to examine cortical thickness in singers, instrumentalists and non-musician active controls as a function of age, within the STAC-r framework. The second objective was to examine the relationship between cortical thickness and two core executive abilities -selective attention and inhibitory control- in these groups. To achieve these goals, healthy young and older adults practising a musical activity were compared to an age-matched group of adults practising non-musical cognitive-motor activities. The first hypothesis was that aging would be negatively associated with executive functions and cortical thickness (CT) within the attention system (operationalized as main effects of Age on CT and attention), and that the negative impact of aging on cortical thickness would be associated with worse attention (operationalized as a CT*Age interaction on attention). The second hypothesis was that musical experience would reduce the negative impact of age on cortical thickness (operationalized as an Age*Group interaction on CT), and therefore would be associated with better attention (operationalized as a CT*Age*Group interaction on attention). The third hypothesis was that practising a musical activity would be associated with greater compensatory scaffolding compared to practising a non-musical activity, meaning that the left hemisphere would be more different between musicians and controls compared to the right hemisphere (operationalized as an Age*Group interaction, a Group*Experience interaction, and an Age*Group*Experience interaction on CT). Our last hypothesis was that instrumentalists and singers would show similar plasticity mechanisms associated with maintained attention level (operationalized as an Age*Group interaction, a Group*Experience interaction, and an Age*Group*Experience interaction on CT, as well as a CT*Age*Group interaction and a CT*Group*Experience interaction on attention). This is based on previous analyses of the same sample that showed similar executive capabilities in singers and instrumentalists compared to active non-musician controls.14
Method
This study was approved by the Comité d’éthique de la recherche sectoriel en neurosciences et santé mentale, Institut Universitaire en Santé Mentale de Québec (#2019-1733). All participants provided written informed consent. Participants included in this study were part of the PICCOLO Project (Projet de recherche sur les effets de la Pratique d’un Instrument ou du Chant sur la COgnition, le Langage et l’Organisation cérébrale).14,45
Participants
Participants were 122 Quebec French speakers, with normal or corrected-to-normal vision, no diagnosed language or hearing disorder, no active neurological, neurodegenerative, psychological, psychiatric or speech/language disorder. All participants were right-handed or ambidexter writing with the right hand, according to the Edinburgh Handedness Inventory.46 To be included, participants had to pass the Montreal Cognitive Assessment (MoCA)47 using the Quebec norms for middle age and elder.48 Depression symptoms were assessed with the 15-item version of the Geriatric Depression Scale (GDS),49 but the GDS was not used as an inclusion criteria.
Participants were divided into 3 groups: amateur singers, amateur instrument players and people involved in an amateur non-musical cognitive-motor activity (controls). Various activities combining a motor and a cognitive component were practised by the control groups: golf, billiards, knitting, yoga, pétanque (boules), curling, video games, bowling, and tai chi. To be included in the study, participants needed to practise their activity for at least 5 years at a mean intensity of at least 3 hours per week. Moreover, they could not practise any other musical activities, like dancing, figure skating, or artistic gymnastic. Instrumentalists were not allowed to sing for more than half of the time spent practising their instrument, and singers were not allowed to practise a musical instrument for more than half of the time spent singing. Participants in the control group could not practise any musical activity. Instrumentalists and singers could not practise any non-musical cognitive-motor activity for more than half the time spent practising their musical activity. In short, the sum of time spent practising secondary activities could not be more than half the time spent practising the main activity of a participant.
Of the 122 participants recruited, 13 were not included in the present study because they did not complete the MRI visit. The recruitment flowchart is illustrated in Figure 1.
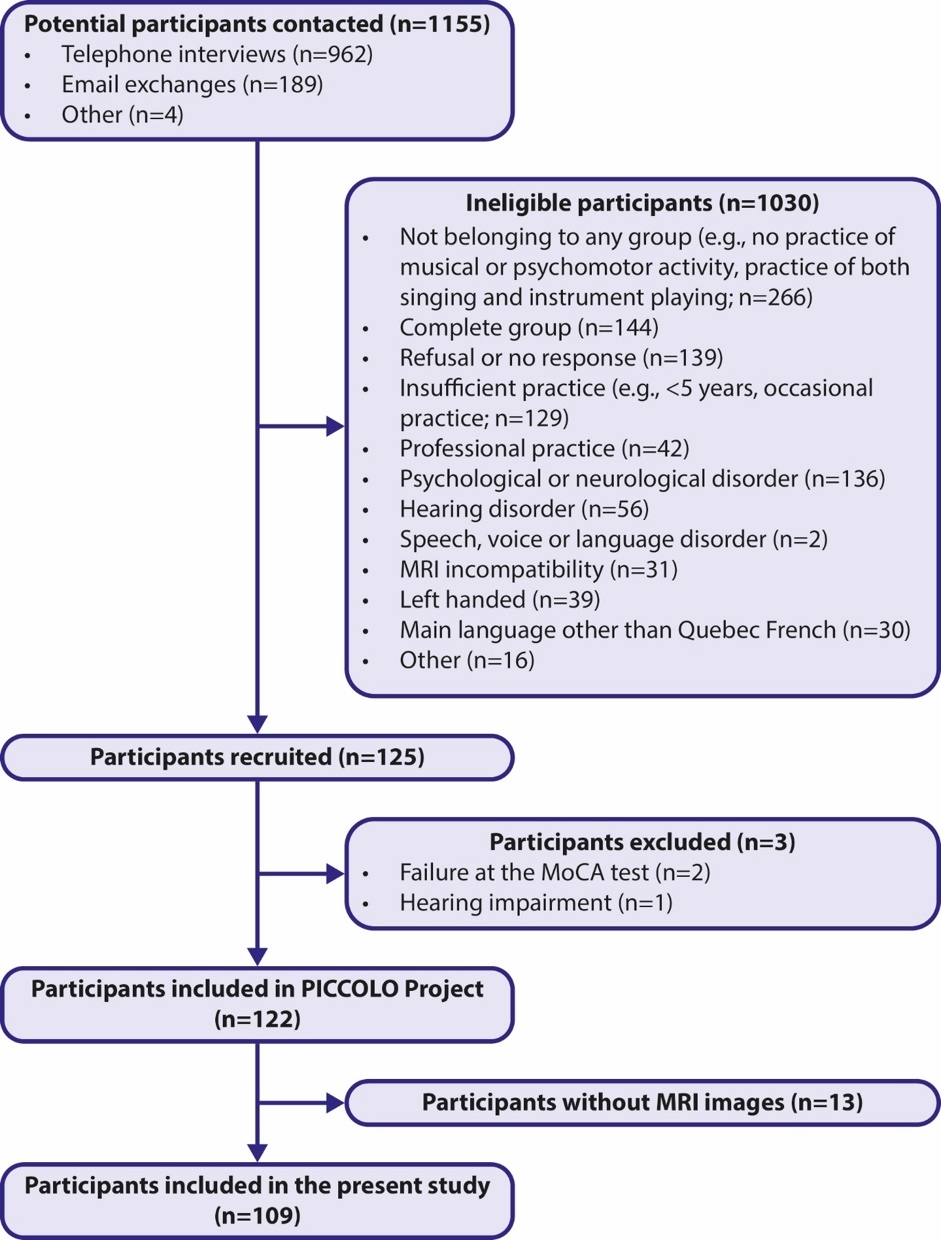
The final sample for the present study (N=109) included 34 amateur singers (mean age = 61.62 ± 16.19; 23-88; 65% females), 38 amateur instrumentalists (mean age = 52.47 ± 18.82; 20-88; 32% females), and 37 controls (mean age = 55.57 ± 18.97; 20-87; 49% females). A summary of participants’ characteristics is presented in Table 1. The three groups were matched a posteriori for age, education, number of spoken languages, general cognition (MoCA), depression symptoms (GDS), self-reported health, and dementia risk factor based on Livingston50 and pure tone hearing. The dementia risk factor was developed based on nine of the twelve potentially modifiable dementia risk factors identified by Livingston and colleagues as part of the 2020 Lancet Commission for dementia, intervention, and care.50 This measure was used as an index of brain health and included as a covariate in all statistical analyses. Details are presented in Supplementary Materials 1. Our sample was also matched for different characteristics related to their main activity: the number of years of practice, the intensity of practice in the past five years, and the experience of practice. Moreover, the numbers of people who sang in a group (28/34) did not differ from the number of instrumentalists who play in a group (27/38) (X2 = 0.72118; p = 0.3958). Singers and instrumentalists demonstrated significantly higher musical practice intensity compared to controls (p < 0.002), with no difference observed between the two groups (p = 0.3139).
Procedures
The experiment included two visits. The first visit had a duration of approximately 3 hours and took place at the Speech and Hearing Neuroscience Laboratory in Quebec City, Canada. This visit included an audiometric and a cognitive assessment. It also included speech, language, and voice tasks, which will not be discussed here. An analysis of the speech production performance has been published elsewhere.45 The audiometric and parts of the cognitive assessment (computer tasks) were administered in a double-walled sound-attenuated room. The other assessments (paper questionnaires) were administered in a quiet interview room. A detailed analysis of the cognitive performance has been published elsewhere.14 This analysis revealed significant group differences mainly in the Test of Attention in Listening (TAiL) and the Colour-word Interference Test (CWIT). Therefore, only those two tests will be analyzed in this study. The second visit was a multimodal magnetic resonance imaging session performed at the IRM Québec Clinic in Quebec City, Canada.
Audiometric Assessment
Pure-tone thresholds in dB HL were measured with a calibrated clinical audiometer (AC40, Interacoustic, Danemark). For each ear, thresholds were measured for six different frequencies at (0.5, 1, 2, 3, 4, 6 kHz). These measurements were used to compute a pure tone average (PTA) for each ear. Because hearing impairment is related to an increased risk of dementia, the PTA of the best ear (i.e., the ear with the lowest average threshold) was used in the dementia risk factor.
Test of Attention in Listening
For assessing auditory selective attention, a French version of the Test of Attention in Listening (TAiL)51 was used. The TAiL is a Windows-based computer program that measures two components of selective attention: distractibility and conflict resolution. The TAiL is composed of three tasks: processing speed (Cued RT), attend frequency (AF), and attend localization (AL). For each task, participants have to listen to 40 pairs of pure tones and answer by pressing on a specific key on the keyboard. In the Cued RT task, participants had to answer as quickly as possible as soon as they heard the two sounds. In the AF task, participants had to indicate if the two sounds were the same or not (the spectral gap between any two tones was at least 2.1 equivalent rectangular bandwidths). In the AL task, participants had to indicate if the two sounds came from the same ear or not. Before each task, the sound was adjusted at a comfortable level and participants performed a 5-trial practice. For the three tasks, the mean reaction time (RT) of the corrects answer and the error rate (ER) were calculated. Based on the TAiL directives, in the Cued RT task, trials were excluded if RT was higher than 2 sec. For each task, trials were excluded if their RTs was higher or lower than ± 3 SD than the participant’s mean. No trials were excluded. For the AF and AL tasks, two composite scores were calculated with RT and ER to measure involuntary orientation and conflict resolution. The involuntary orientation (or distractibility) scores represents the cost of incongruence on the dimension used as the distractor (different localization in the AF task, different frequencies for the AL task). The conflict resolution score represents the effect of congruence between the two dimensions. The two dimensions are congruent when two identical sounds are presented in the same ear (i.e., same-same) or when the two different sounds are presented in different ears (i.e., different-different). There is incongruence when two identical sounds are presented in different ears (i.e., same/different) or when two different sounds are presented in the same ear (i.e., different/same). For both scores, a higher value indicates a higher cost, in RT or ER, for dealing with distraction (distractibility) or for resolving conflict (conflict resolution). The equation for each score is presented in Supplementary Material 2. A previous analysis with the same sample,14 revealed a group difference for the AF task only. Therefore, only measures from this task will be analyzed for the TAiL.
Colour-Word Interference Test
A French version of the DKEFS Colour-Word Interference Test (CWIT)52 was used to measure inhibitory control and cognitive flexibility. The CWIT is derived from the Stroop test.53 It is composed of four different conditions: colour naming (C1), word reading (C2), inhibition (C3), and inhibition/switching (C4). Each condition contains 50 stimuli presented on a page. In the colour naming condition, participants had to name the colour of squares, which were either green, blue, and red. In the word reading condition, participants had to read colour words (‘green’, ‘red’, ‘blue’) presented in black ink on white paper. In the inhibition condition, the same colour names were printed on a white page, but the ink colour did not match the colour name (e.g., the word blue printed in red). The participants were asked to name the colour of the ink. In the inhibition/switching condition, the colour names were printed with a colour that did not match the colour name and half of the words were in boxes. Participants were asked to name the colour of the ink, but if the word was in a box, they had to read the word. Participants were asked to respond as quickly and accurately as possible in all conditions. The first two conditions serve to measure fundamental skills of colour naming and word reading. The third and fourth conditions measure executive functioning (inhibition and cognitive flexibility). Each condition started with a 10-stimulus practice. For each condition, the time to completion (RT) and the error rate (corrected or not) were extracted. Based on previous analysis with the same sample,14 we observe group effect on C4. Therefore, only measures from this task will be analyzed for the CWIT.
MRI Data Acquisition
Images were acquired on an Achieva TX Philips 3.0 Tesla MRI Scanner. Structural MR images were acquired with a T1-weighted 3D-MPRAGE sequence (TR = 8.3 ms, TE = 4.0 ms, FOV = 240 mm, flip angle = 8°, 240 × 240 acquisition matrix, 180 slices/ volume, no gap, voxel size = 1 mm3). The session lasted approximately 50 minutes and included two BOLD fMRI sequences (speech in noise perception and resting state) and a diffusion (HARDI) sequence; those will not be discussed in this article.
MRI Data Processing
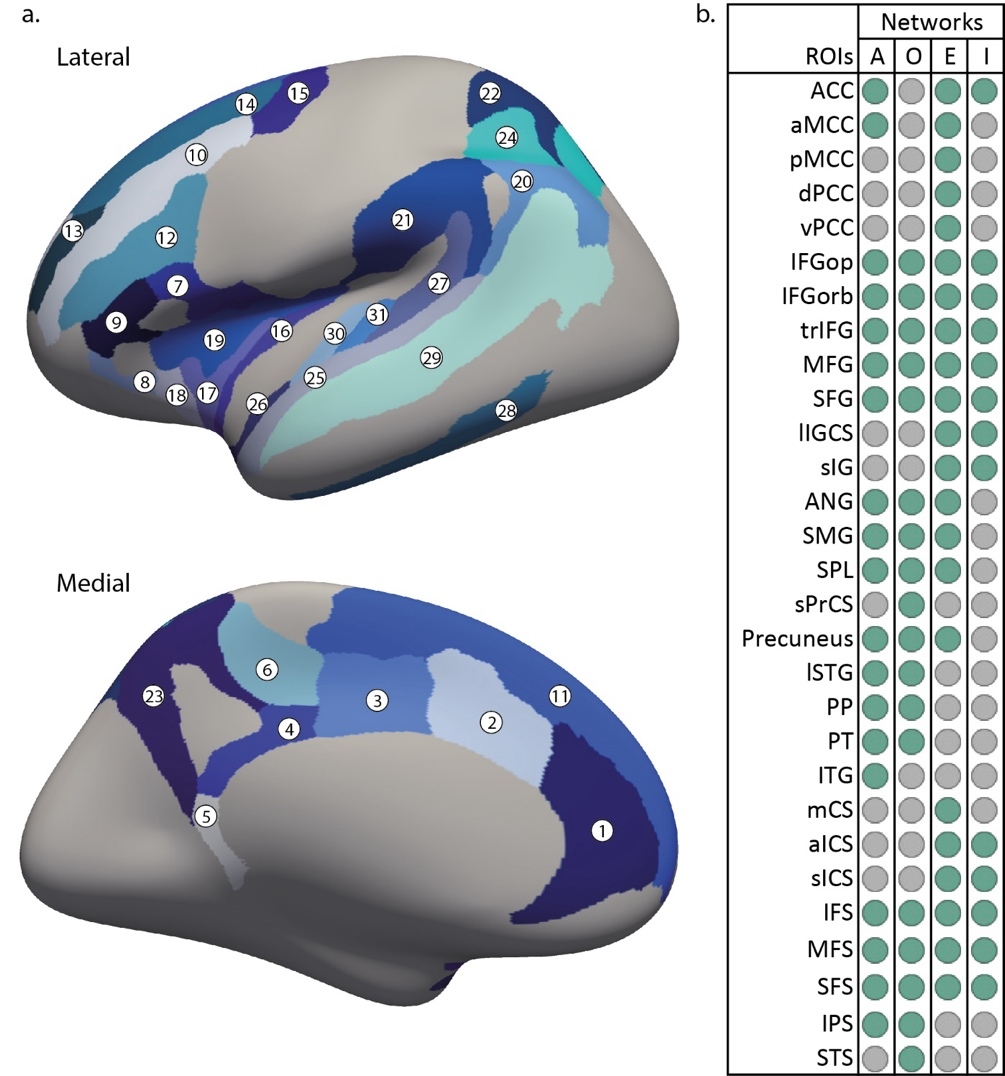
Structural MRI data processing was performed with the FreeSurfer software 7.2.0 (https://freesurfer.net/) running on an iMac computer (OS 10.13.6). It included motion correction and conformation, intensity normalization, non-brain tissue removal, grey and white matter segmentation, and tessellations with automated topology correction. Each step was inspected by two persons and manual intervention were done if needed, following the procedure detailed in FreeSurfer troubleshooting tutorials.54 The cortex was then parcelled into 74 anatomical regions per hemisphere using the Destrieux 2009 atlas.55 From this parcellation, 29 regions of interest (ROI) per hemisphere were selected based on their role in the attention system8,56,57: the anterior cingulate gyrus and sulcus (ACC), middle-anterior cingulate gyrus and sulcus (aMCC), middle-posterior cingulate gyrus and sulcus (pMCC), posterior-dorsal cingulate gyrus (dPCC), isthmus of the cingulate gyrus (vPCC), marginal part of the cingulate sulcus (mCS), opercular part of the inferior frontal gyrus (IFGop), orbital part of inferior frontal gyrus (IFGorb), triangular part of the inferior frontal gyrus (trIFG), middle frontal gyrus (MFG), superior frontal gyrus (SFG), inferior frontal sulcus (IFS), middle frontal sulcus (MFS), superior frontal sulcus (SFS), superior part of the precentral sulcus (sPrCS), long insular gyrus and central sulcus of the insula (lIGCS), short insular gyri (sIG), anterior segment of the circular sulcus of the insula (aICS), superior segment of the circular sulcus of the insula (sICS), angular gyrus (ANG), supramarginal gyrus (SMG), superior parietal lobule (SPL), precuneus, intraparietal sulcus and transverse parietal sulci (IPS), lateral aspect of the superior temporal gyrus (lSTG), planum polare (PP), planum temporale (PT), inferior temporal gyrus (ITG),and superior temporal sulcus (STS). Two additional bilateral ROIs in the auditory cortex known to be affected by musical activity34,58 were added as control: the transverse temporal gyrus (TTG) and the transverse temporal sulcus (TTS). All ROI are illustrated in Figure 2a. The organization of the ROIs within the different attention networks is illustrated in Figure 2b. For each ROI, the average cortical thickness was extracted.
Statistical Analysis
Data were analyzed with R studio (v 4.3.1).59 For each ROI, the mean cortical thickness across all participants was calculated; a difference to the mean (CT) was calculated for each participant. The practice experience was transformed using a natural logarithm transformation. For the CWIT-C4, the RT (natural logarithm transformed) and the number of errors were analyzed. For the TAiL, the distractibility and conflict resolution in cost in ER were analyzed. Because normality could not be achieved for distractibility and conflict resolution in RT cost, these measures were not analyzed. Outliers, defined as Q1 – 1.5 × IQR or above Q3 + 1.5 × IQR, were removed prior to the analyses of the behavioural data and CT data.
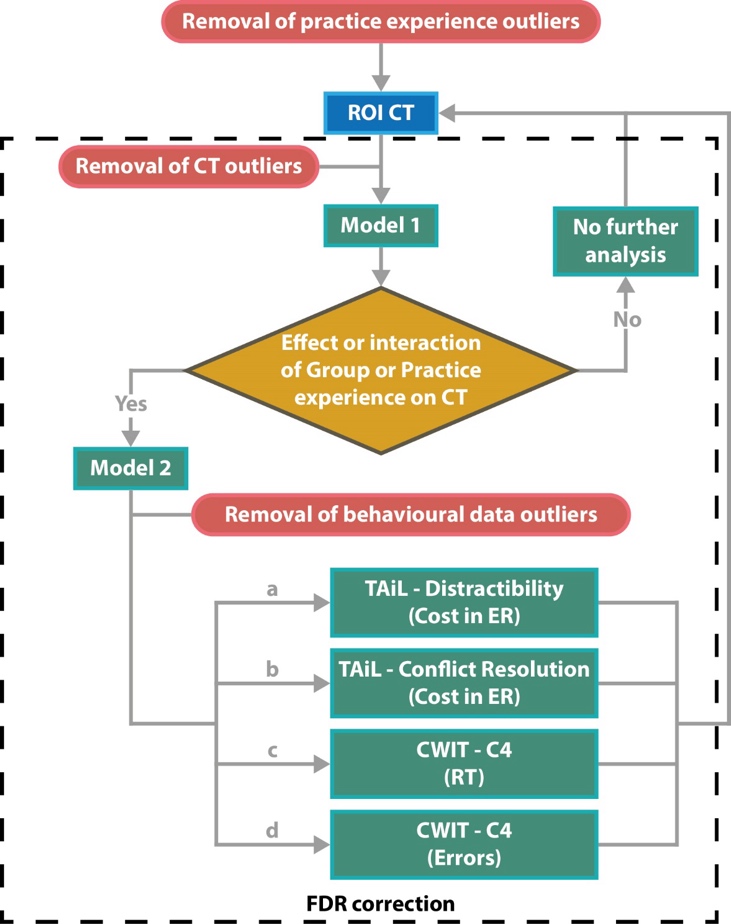
The analytical pipeline is illustrated in Figure 3. Linear mixed models (LMM) were used for statistical analysis. The buildmer package (v 2.9)60 and the lme4 package (v. 1.1-34)61 were used to fit the model that best explains the variance. Interaction decomposition was done using the emmeans (v 1.8.8)62 and the interactions packages (1.1.5).63
A first LMM (Model 1) was used to examine the relationship between musical practice, aging, and cortical thickness (objective 1). For each ROI, the full model included the cortical thickness as dependent variable; the independent variables were age, group, and practice experience. Sex and dementia risk factor (DRF) were included as covariates. Participants were included as a random factor. The initial Model 1 was therefore: Thickness ~ Age × Group × Practice experience + Sex + DRF + 1|Participant. This model will allow us to examine the main effect of Age, as well as the interactions between Age and Group, and Group and Experience, on CT
For ROIs that exhibited either an effect of group or practice experience on CT or any interaction with group or experience, analysis continued via a second model. For ROIs that showed no such effect and no interaction, the analysis did not go further. The second LMM (Model 2) was used to examine the relationship between cortical thickness, aging, musical practice and executive performance (objective 2). For each ROI, the same analysis was performed for each dependent variable (distractibility in cost of ER, conflict resolution in cost of ER, CWIT C4 RT and CWIT C4 errors). The full model included ROI CT, the age, the group, and the practice experience as independent variables. The sex and the dementia risk factor (DRF) were included as covariates. Participants were included as a random factor. The initial Model 2 was: Behaviour ~ Thickness × Age × Group + Thickness × Age × Practice experience + Thickness × Group × Practice experience + Sex + DRF + 1|Participant. This model will allow us to examine the interactions between CT and Age, CT, Age and Group, and CT and Group and Experience, on attention.
Although no group effect was observed for distractibility in terms of cost in ER (TAiL) and CWIT errors,14 these measures were included in the present study given that the absence of group differences at the behavioural level does not signify that there is no difference in brain structure.
To control for multiple comparisons, a Benjamini-Hochberg false discovery rate (FDR)64 correction was applied. All tests of interest were included in the correction. In model 1, main effects and interaction including Age, Experience, and Group were included in the correction. In model 2, main effects and interaction including CT were included. For the sake of concision, we focused on effects and interaction surviving the FDR correction. Moreover, we focused on the main effects and interactions of each ROI directly related to our hypotheses. For the first model, those were: the main effects of Age and the following interactions: Age*Group, Group*Experience and Age*Group*Experience. For the second model, we focused on the following interactions: CT*Age, CT*Age*Group and CT*Group*Exp.

Results
In this section, we display significant main effects and interactions as heatmaps. For the sake of clarity and concision, all uncorrected statistic tables, including linear regressions, post-hoc analysis, final models, and non-illustrated graph are presented in Supplementary Materials 4-8. The results are presented by models (Figure 3), starting with model 1 (dependent variable [DV] = CT) followed by model 2 (separately for each of the DV: TAiL: distractibility in ER, TAiL: conflict resolution in ER, CWIT: RT and CWIT: ER). ROIs full name and location are provided in Figure 2.
Cortical Thickness (CT)
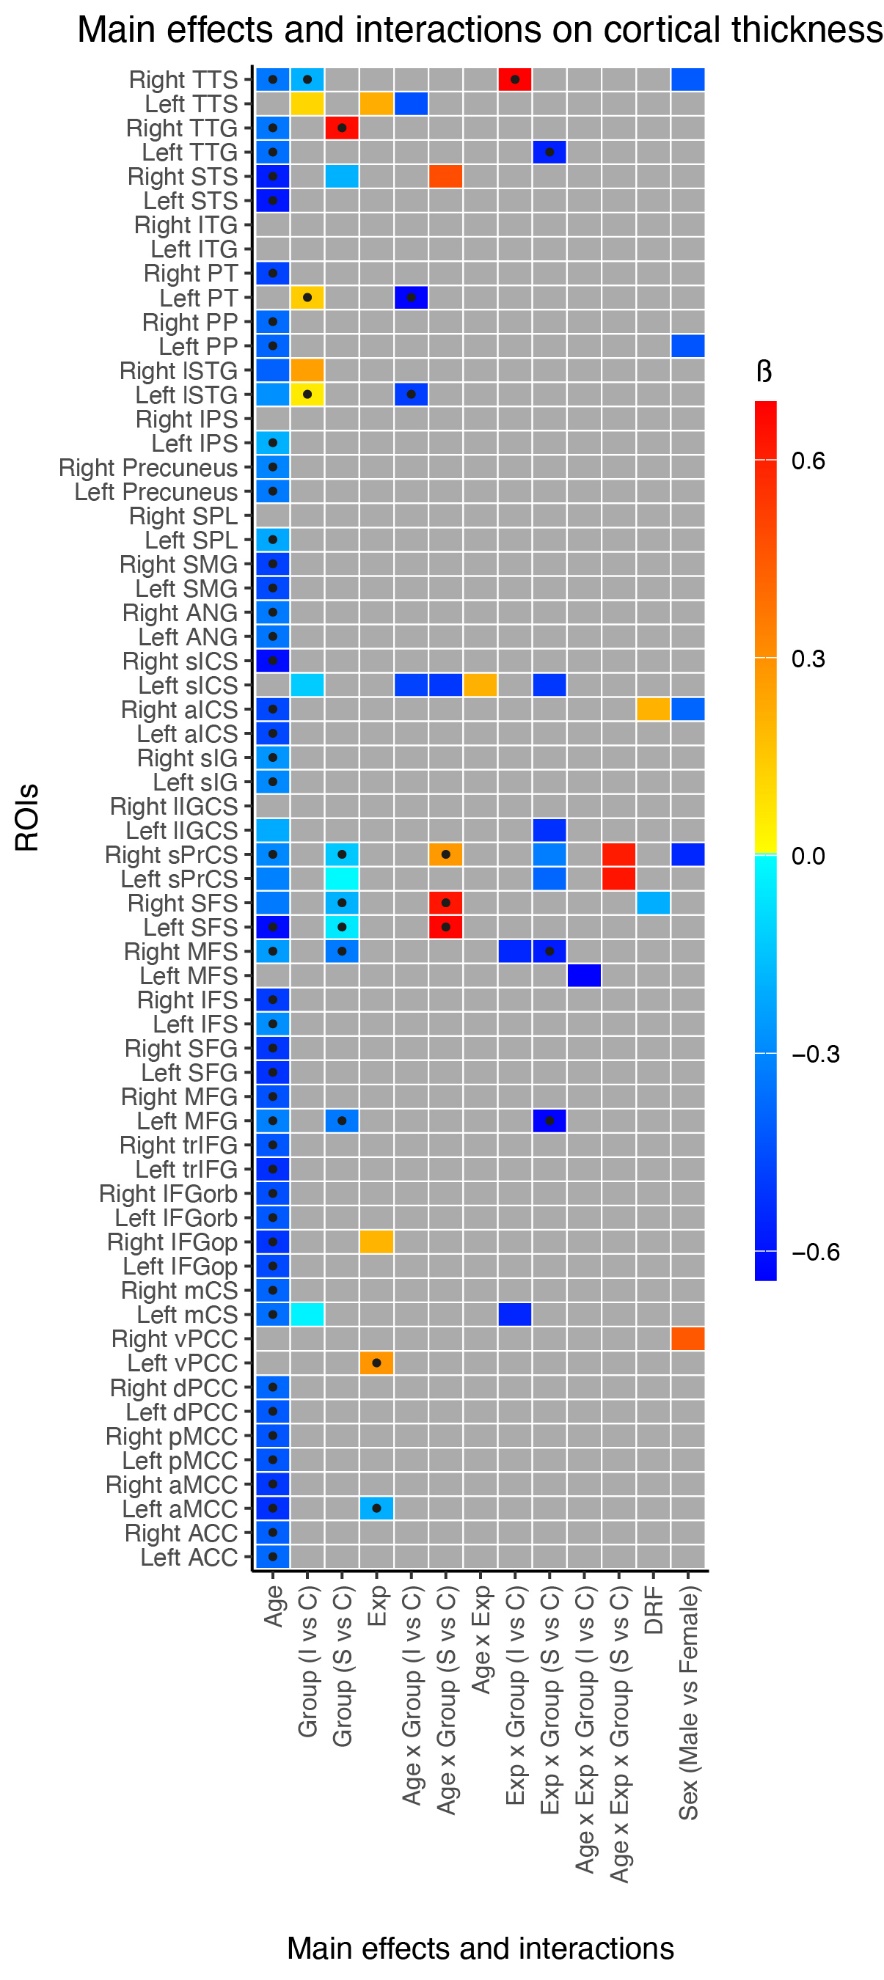
For the analysis of cortical thickness (Model 1), the main effects and interactions are illustrated as a heatmap in Figure 4. As can be seen in Figure 4, Age was the strongest determinant of CT. All Age effects were negative. In 13 ROIs, there was a relationship with Practice experience and/or Group: left aMCC, vPCC, MFG, lSTG, and PT, right MFS, sPrCS, STS, and TTS, and bilateral SFS and TTG. For each ROI, only Age*Group and Group*Experience interaction are illustrated in Figure 5a. Six ROIs showed an Age * Group interaction: the bilateral SFS, right STS and sPrCS, and left PT and lSTG (Figure 5b). Of the six ROIs, none showed similar effect between instrumentalists and singers. In all ROIs, results showed reduced age effect at different degrees for singers compared to instrumentalists. Four ROIs showed a Group * Experience interaction: right MFS and TTS, and left TTG and MFG (Figure 5c). Before FDR correction, similar negative relationship between experience and CT for both singers and instrumentalists compared to controls were observed in the right MFS. However, after correction, the difference between singers and controls was still significant, but there was only a trend of difference between instrumentalists and controls (p = 0.078). The remaining three ROIs did not exhibit similar patterns between the two musical groups. In all three ROIs, singers showed a negative relationship between experience and CT. For instrumentalists, positive relationships between experience and CT were found in the right TTS, while no relationships were observed in the left TTG and MFG.


Distractibility: Cost in Errors
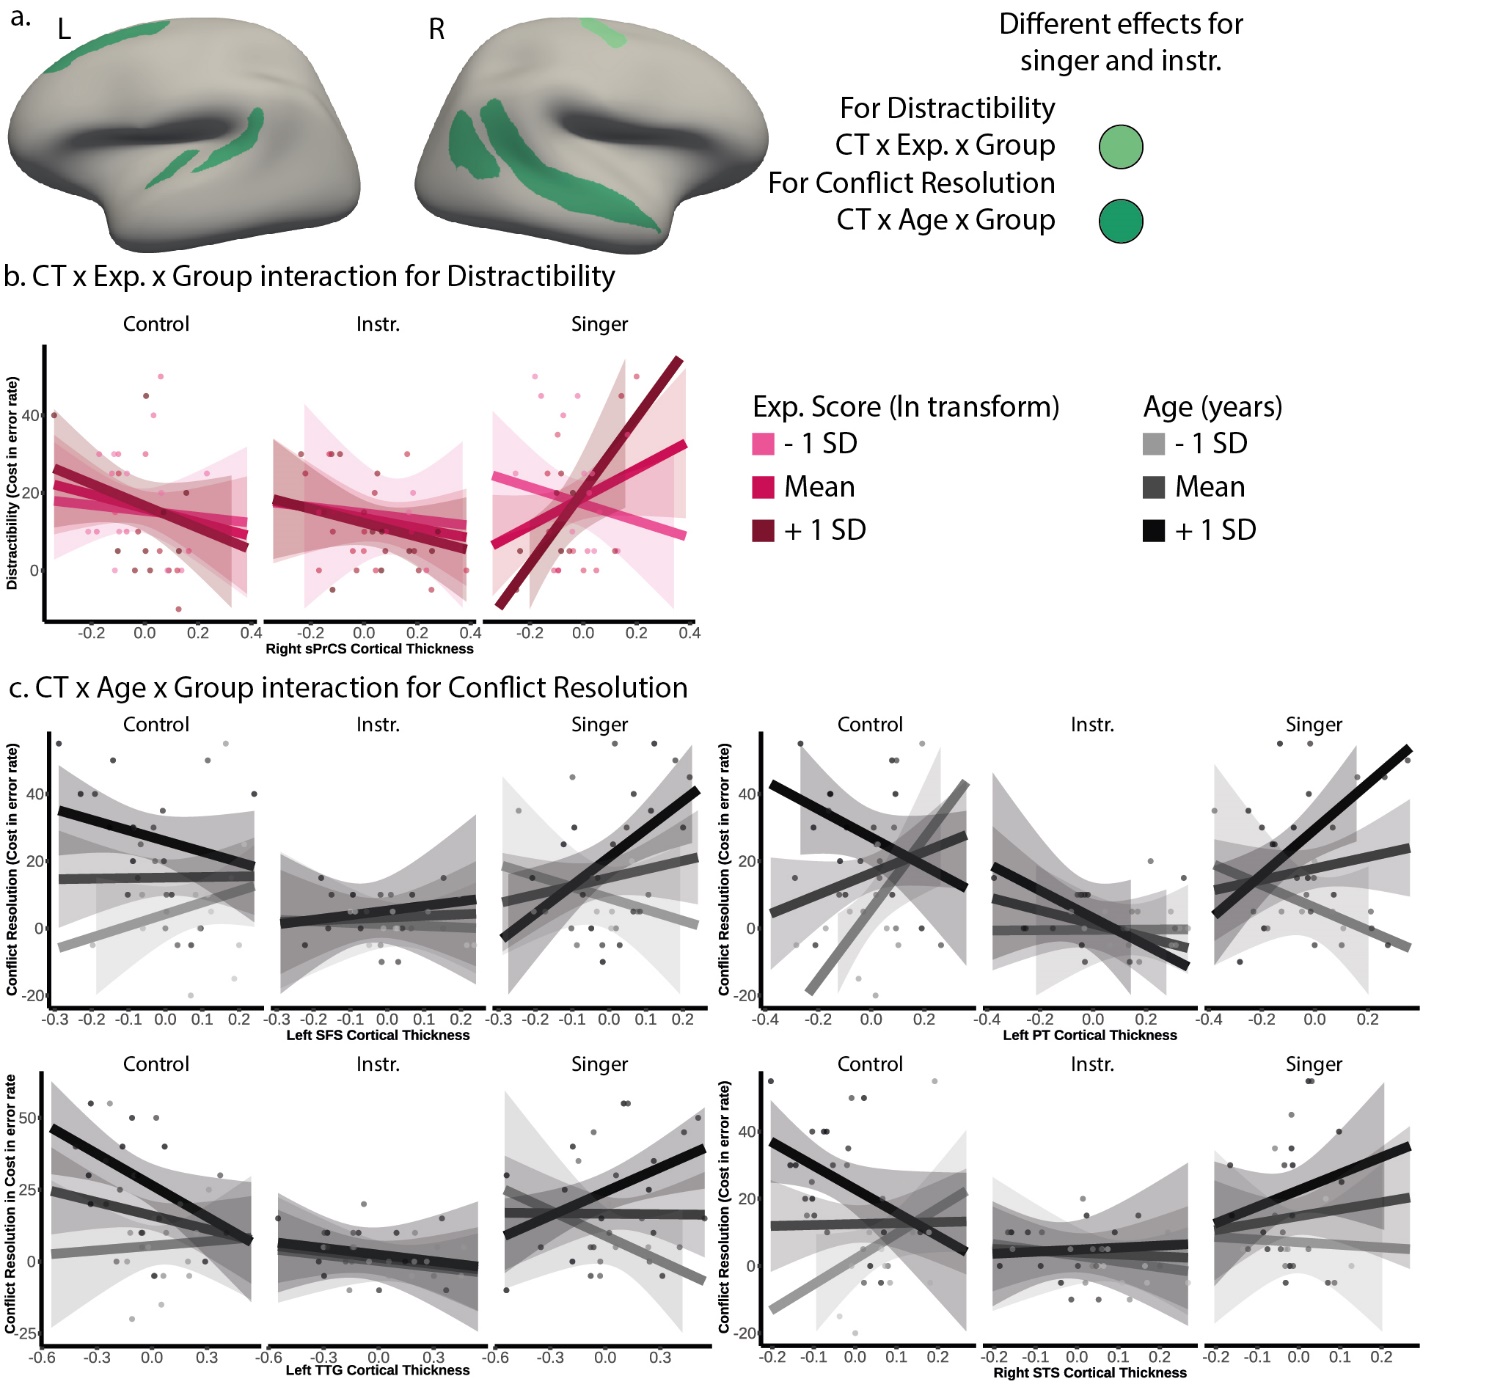
For the analysis of distractibility (Model 2a), the main effects and interactions are illustrated as a heatmap in Figure 6. Note that higher distractibility scores indicate a poorer performance, reflecting a greater difficulty in managing distracting information. The right sPrCS was the only ROI showing a CT * Experience * Group interaction. Results for instrumentalists and singers were different (Figure 8a). Results for singers showed a transition from a negative to a positive relationship between CT and distractibility when Experience increased, while no relationship was observed for instrumentalists (Figure 8b).
.jpeg)
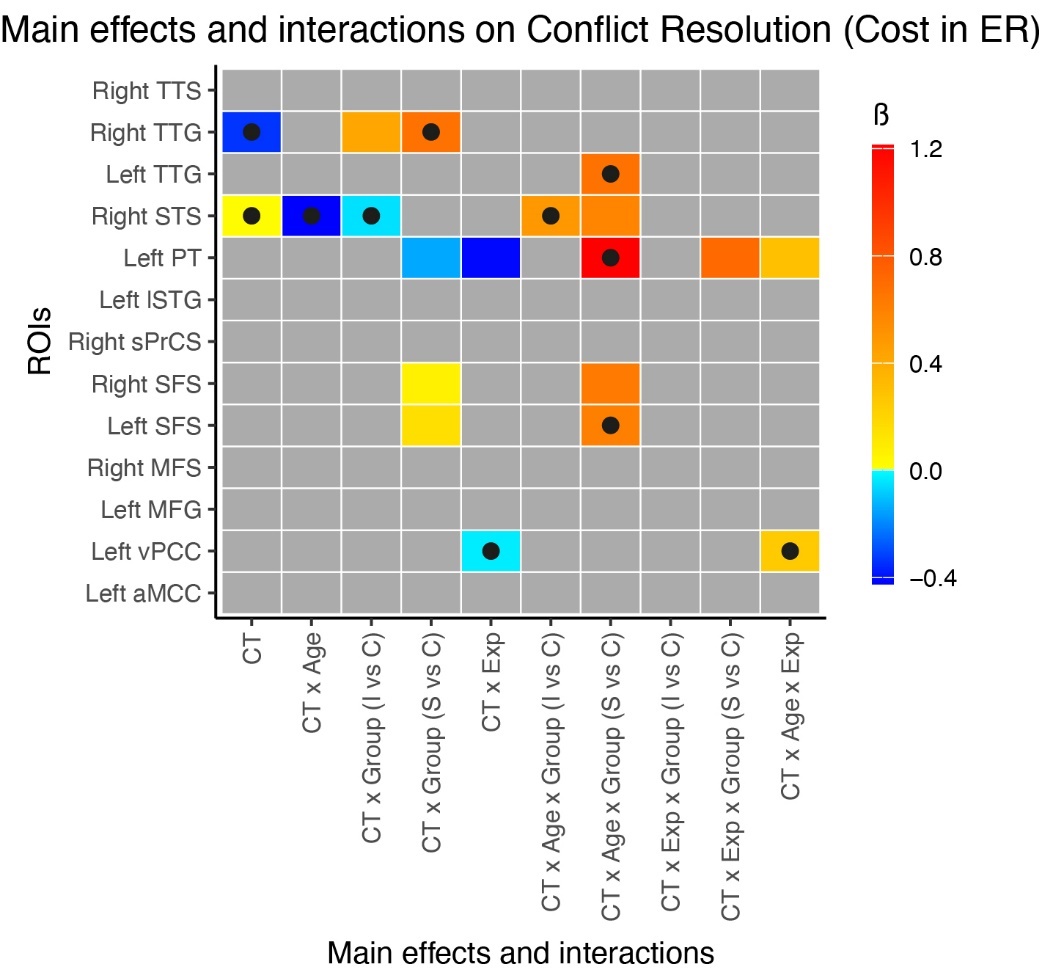
Conflict Resolution: Cost in Errors
For the analysis of conflict resolution (Model 2b), the main effects and interactions are illustrated as a heatmap in Figure 7. For each ROI, the interactions of interest are illustrated in Figure 8a. Four ROIs showed a CT * Age * Group interaction: the right STS, and left TTG, SFS, and PT (Figure 8c). For the four ROIs, the relationship between CT and Conflict resolution became more positive with age for singers, while no such relationship was observed for instrumentalists and the opposite was observed for controls.
.jpeg)

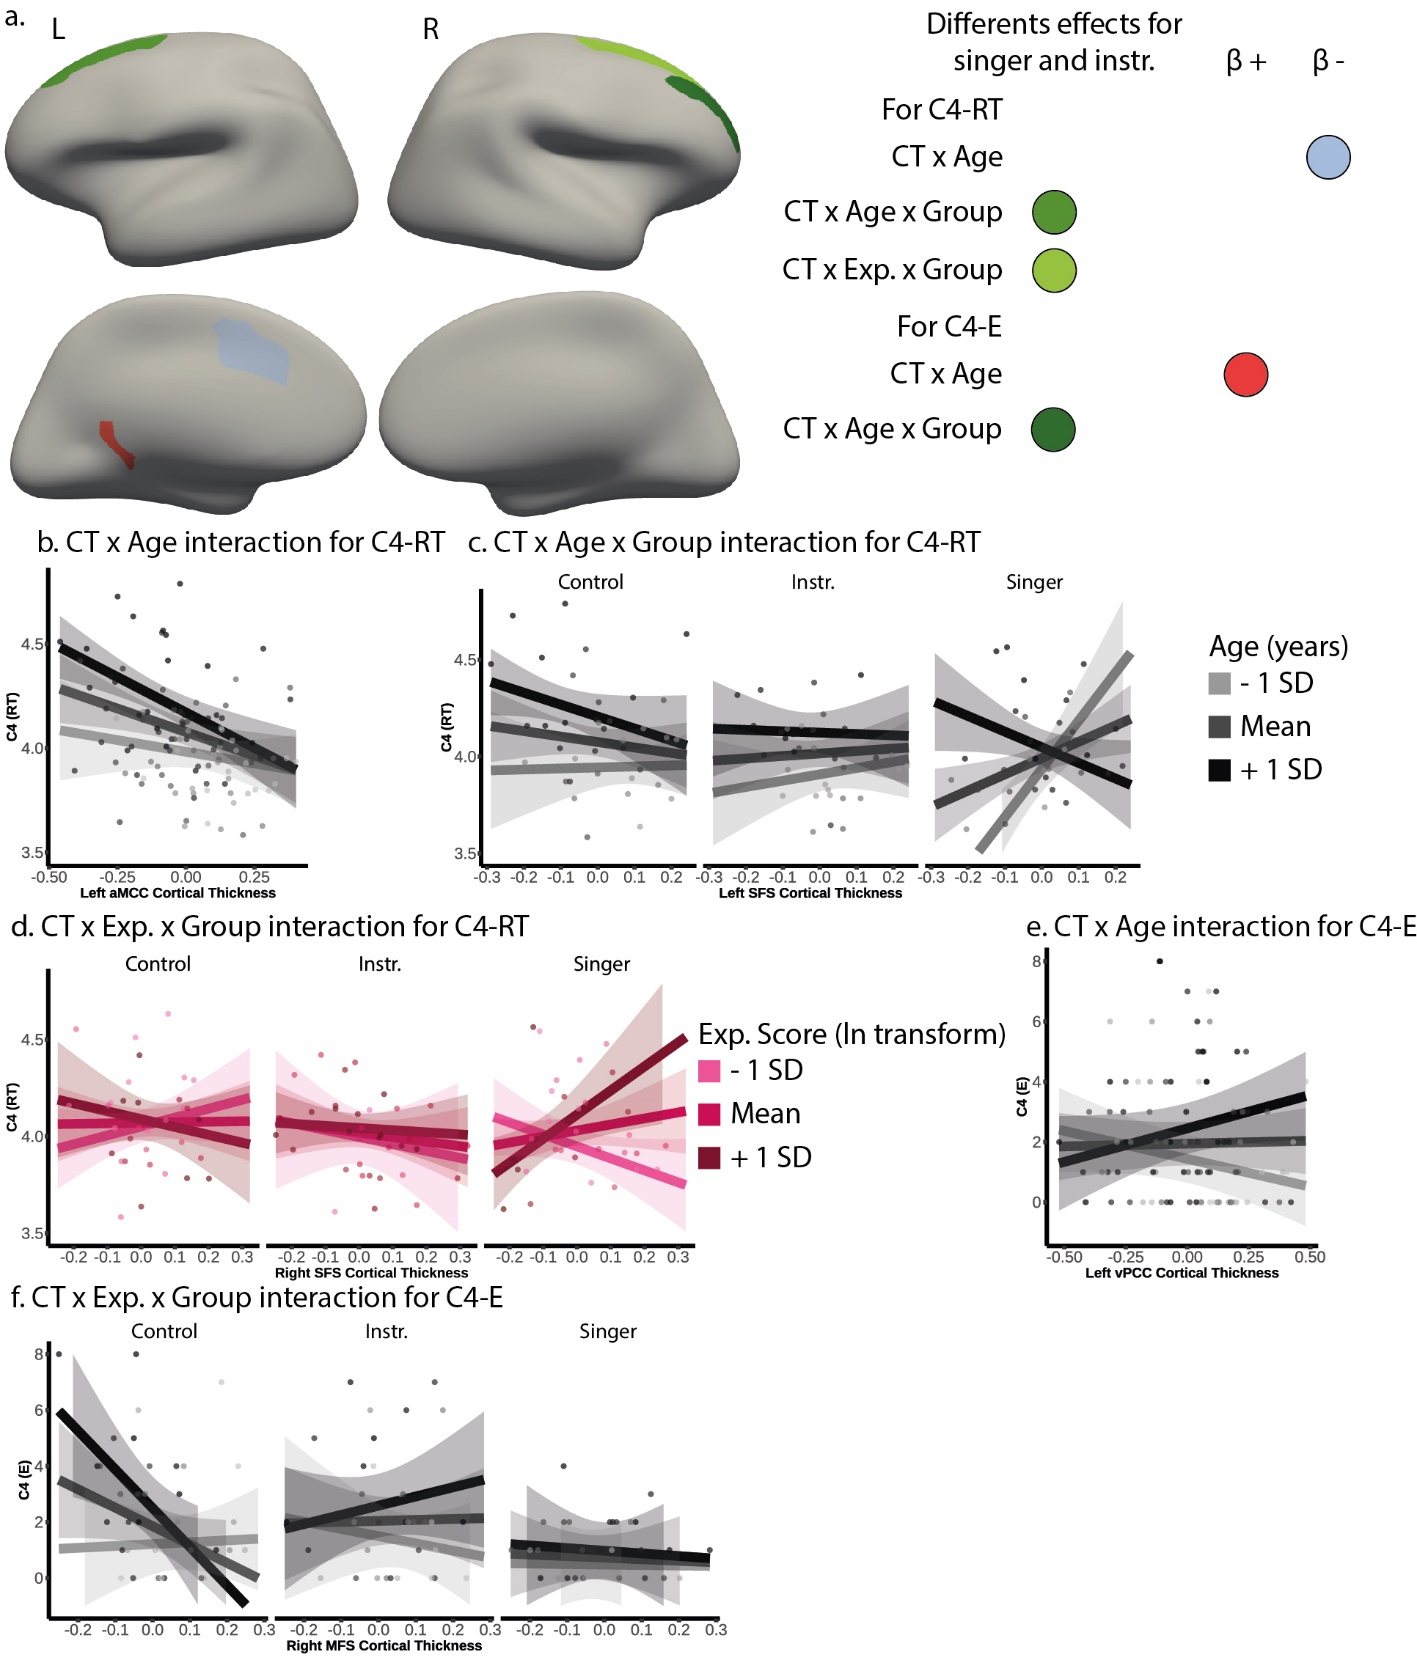
CWIT-C4: RT
For the analysis of CWIT-C4 RT (Model 2c), the main effects and interactions are illustrated as a heatmap in Figure 9. For each ROI, the interactions of interest are illustrated in Figure 10a. The left aMCC was the only ROI showing a CT * Age interaction as its highest one (Figure 10b). The results showed a more negative relationship between CT and RT as age increased. The left SFS was the only ROI showing a CT * Age * Group interaction (Figure 10c). Distinct relationships were observed between singers and instrumentalists. In singers, results showed a transition from a positive to a negative relationship between CT and RT with increasing age, whereas no such association was found in instrumentalists. The right SFS was the only ROI showing a CT * Experience * Group interaction (Figure 10d). In singers, a transition from a negative to a positive relationship between CT and RT with increasing experience was found, whereas no such association was found in instrumentalists.


CWIT-C4: Errors
For the analysis of CWIT-C4 Errors (Model 2d), the main effects and interactions are illustrated as a heatmap in Figure 11. For each ROI, the interactions of interest are illustrated in Figure 10a. The left vPCC was the only ROI showing a CT * Age interaction as its highest interaction (Figure 10e). Results showed a transition from a negative to a positive relationship between CT and errors with increasing age. The right MFS was the only ROI showing a CT * Age * Group interaction (Figure 10f). For instrumentalists, results exhibited a transition from a negative to a positive relationship between CT and errors with increasing age, contrasting with the opposite pattern in controls, whereas no association was observed in singers.
.jpeg)
Discussion
The objectives of this study were to examine the relationship between cortical aging within the attention system and practising a musical or a non-musical activity, in the context of the STAC-r, and to examine the relationship between cortical aging, attention and inhibition. Our results confirm that aging was associated with poorer cognitive performance and thinner cortical grey matter and that practising a musical activity was associated with greater compensatory scaffolding compared to practising a non-musical activity. However, more experience was not always associated with reduced age-related cortical thinning, meaning that, in some cases, more experience was associated with thicker cortex and in others, with thinner cortex. Importantly, and contrary to our hypothesis, the results for singers and instrumentalists suggest distinct plasticity patterns. These findings are discussed in the following sections.
Cortical Aging and Musical Practice
Our results reveal the expected negative aging pattern on cortex thickness within the attention system, as well as limited protective effects of musical practice. Out of the 62 ROIs that were investigated, six exhibited the expected FDR-corrected interaction between age and group (bilateral SFS, left PT and lSTG, and right STS and sPrCS). In these ROIs, singing was associated with less age-related thinning compared to controls or instrumentalists. Importantly, playing a musical instrument was not associated with lesser aging effect in any of these ROIs nor any other ROIs. These results suggest that practising a different musical activity may lead to different cortical outcomes. Since the effects were found on both hemispheres, this suggests that singing may influence not only the core attention system but also areas beyond it.
One factor that could influence the outcome is the practice environment. Group practice, with its social dynamics and coordination among members, might be expected to be associated with additional benefits compared to solo practice. However, since the number of singers and instrumentalists practising in group was similar in our study, the context of practice is unlikely to explain the observed difference. Another factor that could influence the outcome is the age of onset. The age of onset of musical practice has been suggested as an important moderator of neuroplasticity.65 Although this variable was included in our experience score, specific effect of the age of onset may have been lost. However, even though instrumentalists were the group with the youngest mean age of onset, they were the group with the most negative effect of age on cortical thickness. One key difference between singing and playing a musical instrument that could help explain these results is that singing relies on the same apparatus as speaking, relying on the respiratory system, the vocal tract, and the articulators (i.e., tongue, lips, soft palate). Notably, three of the ROIs that showed less age-related thinning in singers are also part of the speech system66: the left lSTG (engaged in spectrotemporal analysis), the right STS (part of the phonological network) and the left PT (engaged in audio-motor interactions for speech). Since these regions are linked to auditory processing, one might expect instrumentalists to rely on them to the same extent as singers. However, singers not only perceive speech, they also produce it. As a result, the audio-motor interface – specifically the dorsal stream – is more heavily used by singers than by instrumentalists. This increased use may help preserve regions involved in “more basic” processes as singers age. The OPERA hypothesis67 suggests that singing induces plasticity in the speech network by engaging overlapping neural circuits. This plasticity would arise because singing requires more precise processing than speaking and must be linked to positive emotions, frequent practice, and focused attention. Although the speech system is mainly left-lateralized and the attention system is relatively right-lateralized, the use of speech could facilitate compensatory scaffolding processes and contribute to maintaining cognitive abilities.
The complex relationship between CT and experience suggests heterogenous plasticity mechanisms. Similar to the interactions between age and group, interactions between group and experience were observed equally in both hemispheres (left MFG and TTG, and right MFS and TTS). However, it should be noted that many of the group * experience and group * age * experience interactions did not survive the FDR correction. Uncorrected interactions were mainly expressed in the left hemisphere. According to the STAC-r, this suggests that practising a musical activity would be associated with greater compensatory scaffolding compared to practising a non-musical activity, because the attention system is right-lateralized. Importantly, singing and playing a musical instrument were associated with different plasticity mechanisms compared to non-musicians. Compared to controls, FDR-corrected results for singers were coherent with the ER model in most regions (right MFS, left MFG and TTG). That is, the ER model suggests that an expansion of CT during learning is followed by a renormalization of CT. In our study, results are coherent with the ER model when more experience is associated with thinner cortex. Yet, one could argue that because the ER model is not linear, thinner cortex could also be associated with less experience. However, in our study, a low experience score is not directly associated with low performance. Our participants had at least five years of experience, meaning that none was a complete novice. Thus, we can speculate that the expansion phase was probably already completed, or close to being completed. Compared to controls, FDR-corrected results for instrumentalists were partly coherent with both the ER model (right MFS) and the BR hypothesis (right TTS). Taken together, these results suggest that practising a musical activity is associated with more than one plasticity mechanisms. Differences in neuroplasticity between instrumentalists and singers may be explained, at least in part, by the different attentional and control requirements of singing and instrument playing as well as by the unique association between singing and singing.
Our findings of music-related differences in the left hemisphere are at odds with previous studies with similar samples, in which participants involved in musical practice had thicker cortex, mainly in the right hemisphere, compared to non-musicians.32–35 One crucial methodological difference between these prior studies and the present study is the choice of the control group. In our study, the control group was active, that is, people practised a cognitive-motor activity, while control groups in other studies were passive. We made this choice to answer one key question: are group differences due to the practice of any cognitive-motor activity or specifically to the practice of a musical activity? Studies that compared musicians to non-musicians cannot address this question. Thus, it is possible that practising any cognitivo-motor activity induce similar reorganization in the right hemisphere as do musical activities. Specific benefices due to musical practices may be limited and may not be observable when controlling for the practice of an activity. Another difference is the type of analyses that was conducted between our study -which used a ROIs surface-based approach- and past studies -which used a whole-brain voxel-based approach.
Therefore, our results suggest that practising a musical cognitive-motor activity might lead to different plasticity mechanisms in the left hemisphere since most group differences were observed in this hemisphere compared to a non-musical cognitive-motor activity. According to the STAC-r, our results suggest that the neural resource enrichment provided by musical activities has specific impacts on the structure of the brain outside of the core attention system. However, we cannot conclude that the non-musical activities affected cortical thickness to the same extent as music activities did, given the absence of a passive control group. Hence, we cannot determine if practising any activity is associated with reduced aging in the core attention system. However, our results suggest that different musical activities are linked to distinct effects on cortical thickness, with unique compensatory scaffolding mechanisms emerging in specific brain regions outside the attention system. In sum, the plasticity induced by musical activities appears to be activity-specific rather than music-specific.
Group Differences in the Structural Underpinning of Cognitive Performance
The relationship between thickness, age, experience, activity and cognitive performance is complex, but several patterns were recurrent. Across the TAiL and CWIT tests, singers were more often different from controls compared to instrumentalists. In general, there was no relationship between thickness and attention/inhibition for instrumentalists. Furthermore, except for the left MFG and right MFS, each ROI was associated with attention and inhibition performance (Table 2). In the following paragraphs, we discuss the results for the TAiL, then for the CWIT.
One of the main scores of the TAiL measure auditory distractibility (in costs of errors), which reflects attention orientation.51 We expected this score to be associated with regions of the orienting network in the frontal, parietal and superior temporal cortex.8 Overall, there were limited associations between thickness and cost in errors. In the right sPrCS, singers with more experience and thinner cortex were less distracted, coherent with the ER model. Because no group differences were observed at the behavioural and anatomical level, our results suggest that distractibility in cost of errors is scarcely influenced by the practice of cognitive and musical activity.
The second main score of the TAiL assesses conflict resolution in the auditory modality.51 We expected this score to be associated with regions of the executive network in the frontal, parietal, cingulate, and insular cortex.8 Overall, there were more associations between thickness and conflict resolution compared to distractibility. The three most important findings are that (1) most associations were found in the left hemisphere (left: PT, SFS, TTG; right: STS), (2) instrumentalists were better at resolving conflict and were less variable than singers and controls, and (3) the results for singers and controls were opposite. Opposite patterns were observed in these four ROIs, in the form of an interaction between thickness, group, and age. While the results for the older singers were coherent with the ER model, the results for the older controls were coherent with the BR hypothesis. The results for instrumentalists were different from those of the controls or singers, but no relationship with performance was found in most ROIs.
Group differences were mostly observed in left ROIs of the executive network, suggesting greater compensatory scaffolding. Although the executive network is more bilateral than other attentional networks,8 it has been suggested that the right hemisphere is better at resolving attentional conflict.68 Compensatory scaffolding is also observed in the expansion of executive network into other attentional networks. Some ROIs, left PT and right STS, showing association between their CT and conflict resolution are outside the executive network. This expansion could reflect greater connectivity between the different attention networks to maintain attentional capacities.
CWIT performance was expected to be associated with thickness in regions of the inhibition network in the prefrontal cortex, the anterior insula, and the anterior cingulate cortex.8 More relationships between thickness and inhibition were found in the left hemisphere for RT compared to accuracy. In terms of RT, the relationships between thickness and inhibition were observed in the left aMCC and bilateral SFS. In terms of errors, the relationships between thickness and inhibition were observed in the left vPCC and right MFS. For both CWIT-C4 measures, an interaction between thickness, age and group was observed, although the interaction differed for errors and RT. For errors, results in the right MFS for instrumentalists were more different from controls than singers. At older age, results were more consistent with the ER model for instrumentalists, and with the BR hypothesis for controls. For RT, the opposite was observed. Results in the left SFS for singers were more different from controls than instrumentalist, but were coherent with the ER model for younger singers. Although no group differences were observed in behavioural analysis for the errors,14 our results showed different plasticity mechanisms associated with different musical activities. Importantly, this suggests that plasticity mechanisms are (at least in part) activity-dependent, but not behavioural outcomes.
Our results are inconsistent with a study that found a correlation between performance in RT at the fourth condition of the CWIT and the volume of almost the whole brain of healthy older adults.69 We did not find associations between ROIs and inhibition that Adólfsdóttir et al.69 found and we found associations between the CWIT and the cingulate cortex that Adólfsdóttir et al. did not find. These differences might be explained by several methodological differences. First, a recent study found disparities between structural measurements in aging and suggested that cortical thickness may be a more sensitive indicator of morphological than volume for regions presenting less pronounced age-related structural decline.70 Second, Adólfsdóttir and al. used the Desikan atlas,71 which has a less precise cortical parcellation than the Destrieux atlas we used. Third, because Adólfsdóttir et al. focused on healthy older non-musician while we included musicians and active non-musicians, differences between studies could reflect compensatory scaffolding in musicians in our study. Association between cortical thickness and performance only in musicians support the recruitment of new regions to maintain inhibition, consistent with the STAC-r.
At the network level, the results of our study suggest that musical activity and practice experience have an impact mainly on ROIs that are common to all four networks (bilateral SFS, right MFS and left MFG) (Table 2); these ROIs may be playing more pivotal roles than more specialized regions. Furthermore, although all networks were associated with musical practices, the orientation network was the one most strongly associated with it. Indeed, of the ten ROIs associated with musical activities, eight were part of the orientation network. Considering both hemispheres, these eight ROIs represent to 22% of the orientation network. The orientation network is implicated in prioritizing sensory stimuli by selecting a modality or location.8 Thus, practising a musical activity may train these abilities greater than non-musical activities, resulting in cortical differences in structures implicated in the orientation network.
In addition, for half of the ROIs (right sPrCS and STS, and left aMCC, lSTG, and PT), our results showed unexpected association between cortical thickness and behavioural performance. Specifically, only regions implicated in the orientation network were expected to be associated with distractibility performance; the left aMCC, associated with the alert and executive networks, was associated with attentional performance. Similarly, only regions implicated in the executive network were expected to be associated with conflict resolution, but the left PT, associated with the alert and orientation networks, was associated with the performance. Finally, only regions implicated in the executive network, more specifically in the inhibition sub-network, were expected to be associated with CWIT performance. Yet, some regions exclusively implicated in the alert or the orientation network (right sPrCS and STS, left STG) were associated with inhibitory control. These findings could be evidence of compensatory scaffolding, expressed as the recruitment of new regions to maintain inhibitory control in aging.
In sum, we found group differences in the relationship between thickness and attentional performance. Singing-related plasticity was consistent with the ER model and plasticity associated with non-musical activity was coherent with the BR hypothesis, mainly in the orientation network. Instrument-related plasticity was not associated with either model. The observed difference between singers and instrumentalists may stem from the variety of instruments played by the latter. While all singers engage in vocal practice, instrumentalists play diverse instruments each requiring distinct fine motor skills and pitch-processing abilities. Schneider et al.43 observed differences in plasticity mechanisms within Heschl’s gyrus between fundamental pitch listeners (piano, guitar, flute, trumpet and percussion players) and spectral pitch listeners (organ, strings, woodwind and brass players, and singers) suggesting that practising a specific musical instrument induces unique changes in the primary auditory cortex. However, our study focuses on the attention system rather than the auditory cortex. While different instruments may engage the attention system in varying ways, it is also possible that they do not. Additional studies are needed to assess this possibility.
Contributions to the Theory of Aging and Cognition
The results of our study further current understanding of experience-induced plasticity in older adults in two ways. Our study advances the understanding of experience-induced plasticity in older adults in two key ways. First, our findings suggest that neural resource enrichment occurred independently of the specific musical activity in most regions of the attentional system. In contrast, compensatory scaffolding, which is expected to be expressed outside the core attentional network, was activity dependent. Singing was associated with more compensatory scaffolding compared to instrument playing. Second, our study suggests that the ER model is relevant in the context of aging and lifelong experience, as observed in singers. This model was developed based on the observation of a phase of volume expansion followed by a phase of renormalization in the bilateral primary motor cortex of right-handed young adults learning to write with their left hand.72 Our results showed patterns coherent with this model, as singers with more experience and thinner cortex performed better at the TAiL and the CWIT than those with thicker cortex. Moreover, in some regions, these patterns were observed only in older adults. Results coherent with the BR hypothesis were observed mainly in controls, and instrumentalists in a lesser measure. One possibility is that the BR is a part of the ER model. According to the ER model, no new cycle of expansion and renormalization should be observed unless a new skill is learned.39 Consequently, it is possible that when observations are consistent with the BR hypothesis, the renormalization phase never occurred or ended before a new expansion phase began. However, because of the cross-sectional nature of this study, we can only speculate. Randomized longitudinal studies are needed to fully address this question. Nonetheless, our study is not the first to observe this duality of findings. Indeed, the literature on experience-induced plasticity is filled with findings consistent with either hypothesis, something this is rarely addressed at the theoretical level. For example, a decrease of cortical volume has been found after motor training73 and mental training,74 an increase has been found after motor training73 and meditative training,75 and increase followed by decrease have been found after motor training.72,76,77 One way to address this issue might be to document whether people are actively learning new skills, news songs/pieces, or to design stepwise training programs to examine brain structure at the end of each step.
Conclusions
The present study suggests that practising a musical activity could be associated with different plasticity mechanisms compared to practising a non-musical activity in the attention system. The main contributions of this study are threefold. First, controlling for experience and risk factors for dementia,50 singers showed reduced age effects compared to controls and instrumentalists in regions of the attention system; even though singers had lower experience score and fewer singers received formal musical training compared to the other groups. Second, compensatory scaffolding in musicians, mainly in singers, was associated with an expansion of the attentional system into the left hemisphere. Finally, our study highlights that practising a musical activity is associated with brain reorganization that is associated with maintained attentional performance. While these results await replication using a randomized controlled study, our findings support the notion that singing and playing a musical instrument are contributors of healthy aging and brain health.
Authors’ Contributions
Alexandre Sicard: Conceptualization, Investigation, Methodology, Formal analysis, Visualization, Data Curation, Writing- Original draft preparation.
Pascale Tremblay: Conceptualization, Funding acquisition, Investigation, Methodology, Supervision, Resources, Project administration, Data Curation, Writing—Reviewing and Editing.
Data/Code Availability
The raw datasets generated during the current study cannot be made publicly available because participants did not consent to public data sharing at the time. However, the group data will be available on Borealis, the Canadian Dataverse Repository (https://borealisdata.ca/fr/), upon publication, along with aggregated behavioural data (https://doi.org/10.5683/SP3/4GQSBR).
Acknowledgments
We thank all participants. Thanks also to Elisabeth Maillard, Marilyne Joyal, Lydia Gagnon, Josée Vaillancourt, Alison Arseneault, Valérie Brisson, Xiyue Zhang, Sabrina Juhasz, Marie-Clarisse Perron, Julia Picard, and Gabriel Frazer-McKee for their contributions to the recruitment and testing of participants. Thanks also to Thomas Vézina-Dargnies for his contribution to MRI data processing.
This work was supported by P.T.'s grants from the Fonds de la recherche du Québec – Nature et Technologies [FRQNT; # 2019-PR-254714], the Natural Sciences and Engineering Research Council of Canada (NSERC grant # RGPIN-2019-06534), the Canadian Foundation for Innovation [#31408]; and one Globalink research internships from MITACS. PT holds a Level 1 Canada Research Chair on the Neurobiology of Speech and Hearing (#CRC-2022-00090).
Conflicts of Interest
The authors report having no conflicts of interest.