1. Introduction
Perinatal stroke (PS) occurs in approximately 1 in every 1,000 live births, affecting over 10,000 Canadian children.1 PS is a focal, vascular brain injury with two common subtypes: Arterial Ischemic Stroke (AIS) and Periventricular Venous Infarction (PVI). AIS typically involves a blockage of the middle cerebral artery, usually presenting within the first week of life due to seizures, and may be due to placental thromboembolism.2 In contrast, PVI occurs in utero before 32-weeks gestation and is the result of a germinal matrix hemorrhage and subsequent venous infarction.2 Although PS occurs early in life, clinical presentation and diagnosis may not occur until later in childhood.3 Most survivors of PS suffer damage to the motor system which results in hemiparetic cerebral palsy (hemiparesis) and lifelong disability.4–7 As there are no prevention strategies or curative treatments, care focuses on minimizing disability to optimize development and life participation.
Brain mapping and neuroimaging have informed the understanding of how the motor system develops after PS. In typical early development, upper motor neuron cell bodies focus into the precentral gyrus, forming the primary motor cortex (M1), accompanied by the withdrawal of ipsilateral corticospinal projections, resulting in the typical arrangement of motor control from the contralateral hemisphere.8–11 After PS, contralateral corticospinal projections may be unable to establish typical dominance such that ipsilateral pathways from the non-lesioned hemisphere to the affected hand may be abnormally preserved. At around 4-6 months of age, PS patients begin to show asymmetries of movement and early hand preference. Motor learning and development then follows an individually unique trajectory, shaped by multiple factors including therapy, experience, endogenous plasticity, environment, and others. Care for hemiparesis involves initiation of motor rehabilitation therapy including constraint-induced and bimanual therapies7 though effect sizes are modest at best. Understanding how the motor system changes following PS can help identify targets for novel neuromodulation approaches to optimize outcomes.
Transcranial direct current stimulation (tDCS) is a non-invasive brain stimulation technique that uses weak electrical current to change cortical excitability that induces neural plasticity.12–15 tDCS is safe and has been shown to enhance motor learning in typically developing children.16–18 Preliminary trials using cathodal tDCS suggest that it is well tolerated and possibly effective for children with PS and hemiparesis.19 tDCS is also being investigated for other neurological conditions but its mechanisms of action remain poorly understood.20
Magnetic resonance imaging (MRI) has advanced models of brain development in PS.8,21 Task-based functional MRI (fMRI) can localize M1 bilaterally including displacement from typical locations.12,22–24 Using magnetic resonance spectroscopy (MRS), in vivo metabolite concentrations in a cortical region of interest can be measured to provide insight on neurotransmitter levels, metabolism, and neuronal health.24 Such metabolites can inform models of brain development in health and disease.25,26 MRS has demonstrated alterations in levels of N-acetylaspartate, choline, creatine, glutamate and glutamine, and myo-inositol between hemispheres of PS patients at baseline and following non-invasive brain stimulation.12,26
Missing from these studies is the investigation of the brain’s primary inhibitory neurotransmitter, γ-aminobutyric acid (GABA). GABA is vital in neurodevelopment with important roles in synapse and neural network formation, chemical messaging, and healthy neural functioning.27,28 During development, signal inhibition via GABA is critical in motor cortex plasticity.29 Changes in GABA may play an important role in motor recovery after stroke in adults30,31 but this has not been studied in children with PS. GABA modulation through inhibitory brain stimulation and motor learning may be relevant to motor cortex plasticity which can help to further increase motor function in this population.32 A study in healthy adults found an association between the degree of GABA decrease from tDCS and the ability to learn a new task.32 Increasing our understanding of how brain metabolites differ between hemispheres and how they may change after intervention could inform neuromodulation strategies.
We aimed to quantify differences in GABA between the lesioned and non-lesioned M1 in children with PS at baseline and following intensive motor learning and neurostimulation. We hypothesized that due to stroke-induced injury (i) baseline GABA levels would be lower in the lesioned M1, (ii) GABA in both M1s would be lower than typically developing controls, the degree of which would correlate with motor function, and (iii) GABA levels would decrease in the stimulated M1 in children receiving cathodal tDCS as compared to sham.
2. Material and methods
2.1. Participants
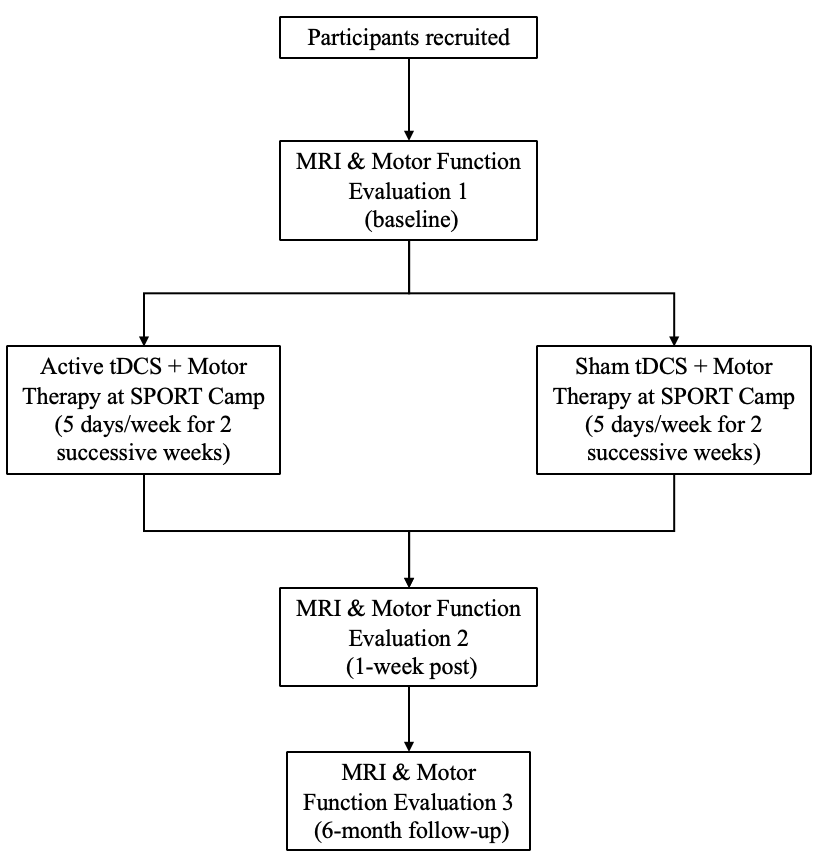
Participants (6-18 years) with unilateral PS were recruited through the Alberta Perinatal Stroke Project (APSP)33 to the Stimulation for Perinatal Stroke Optimizing Recovery Trajectories (SPORT) trial, a randomized, controlled, clinical trial (#NCT03216837).34 Inclusion criteria were: age 5-18 years, clinical diagnosis (MRI confirmed) of unilateral PS (AIS, PVI), disabling hemiparesis and hand dysfunction, and term birth (>36weeks). Exclusion criteria were: neurological disorder not related to PS, multifocal stroke, severe hemiparesis, severe spasticity, severe delay or inability to comply with protocol, unstable epilepsy, transcranial magnetic stimulation (TMS) or MRI contradiction, injections of botulinum toxin, orthopedic surgery, constraint therapy, or brain stimulation or other modulatory therapy in the 6 months prior. SPORT was a phase 3, randomized, controlled, multi-centre trial in Calgary, Edmonton, and Toronto.34 The trial was done in a camp-based model of intensive, personalized, peer-supported rehabilitation (Figure 1). Eighty-nine children participated in the trial. Only children from 2 of 3 cohorts were included in this study to homogenize MRS data to sequences acquired on a single scanner.

Imaging data from typically developing controls (TDC) was obtained from the Accelerating Motor Learning in Pediatrics (AMPED) study18 with recruitment from the Healthy Infants and Children Clinical Research Program (HICCUP).35 MRS data from AMPED has been reported.36 TDC were right-hand dominant, thus their left-dominant hemisphere was compared to the non-lesioned hemisphere in the stroke participants.
Written informed parental consent and participant assent was obtained. All procedures were performed in compliance with relevant laws and institutional guidelines and have been approved by the Conjoint Health Research Ethics Board, University of Calgary (Ethics ID: REB16-2535_REN7), renewed on February 13, 2024, and the research ethics boards at the other SPORT sites.
2.2. MRI Data Acquisition
Stroke participants completed MRI scans at three time points: pre-camp (baseline), post-camp (1-week post-intervention), and follow-up (6-months post-intervention). MRS data from TDC participants was used for comparison at baseline only. Imaging was performed on a 3.0T GE MR750w MRI scanner and 32-channel head coil. T1-weighted images were acquired (220 contiguous slices; voxels = 1.0 mm isotropic; repetition/echo time (TR/TE)=8.5/3.2ms; flip angle=11°).
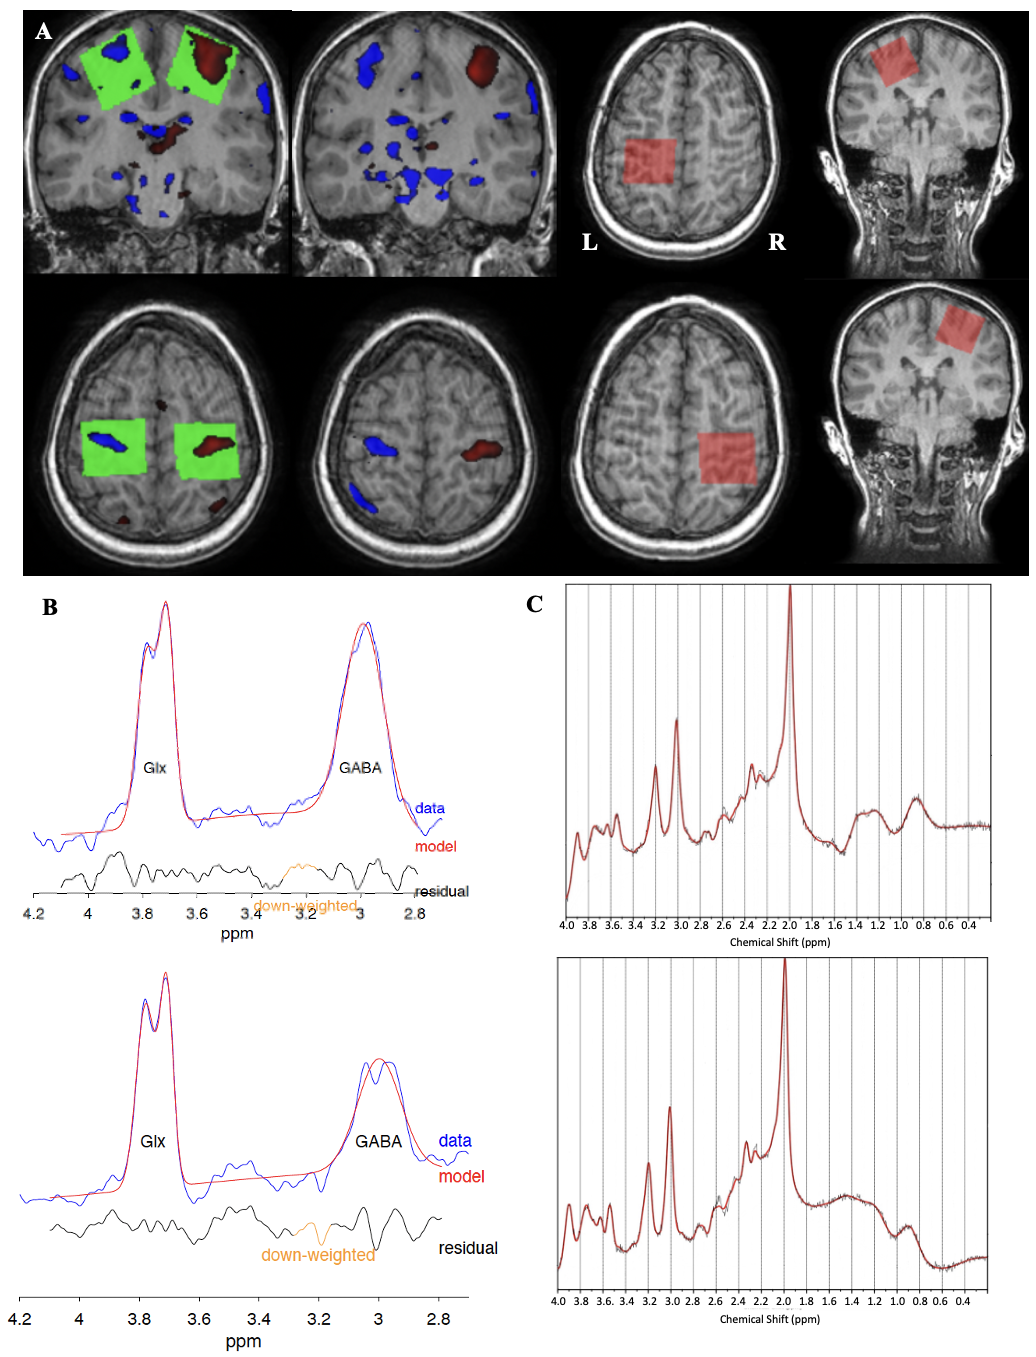
Since unique neuroanatomy after PS may cause M1 to be displaced from typical anatomical locations,22,26 M1 was located using functional MRI (3.6mm isotropic voxels, 36 slices, TR/TE=2000/30ms, 150 volumes, 5 minutes) during a hand-squeeze motor task. Children were asked to squeeze a ball alternating one hand at a time in synchrony with an on-screen cue for 12 seconds, interleaved with 20 seconds of rest. Real-time display of activation during the motor task fMRI sequence identified regions with the highest activation, guiding MRS voxel placement (Figure 2A).

GABA-edited MEGA-PRESS was used to measure in-vivo M1 GABA+ levels (30x30x30mm3 voxels, TE=68ms, TR=1800ms, averages=256, 14ms editing pulses applied at 1.9ppm and 7.46 ppm). Using this method results in contamination of the GABA signal by roughly 50% macromolecule signal, therefore GABA is referred to as GABA+, to represent GABA+ macromolecules.37 PRESS was used to measure levels of tNAA (N-acetyl-aspartate+N-acetyl-aspartyl-glutamate), tCr (Creatine+Phosphocreatine), mI (Inositol+Glycine), tCho (Choline+Phosphocholine+Glycero-phosphocholine), and Glx (Glutamate+Glutamine) (30x30x30mm3 voxels, TE=35ms, TR=1800ms, averages=64). The PRESS voxel placements were copied from MEGA-PRESS to ensure exact voxel overlap. Unsuppressed water data was acquired for metabolite quantification.
2.3. Image processing
The T1 anatomical scan was co-registered to the sequence performed immediately before MRS using Statistical Parametric Mapping using SPM12 in MATLAB version 2021b. This maximized the accuracy of voxel localization and tissue correction in case the participant had moved between acquisition of T1 and MRS sequences.12,38 FID-A toolbox in MATLAB preprocessed PRESS data using the following steps: coil combination, removal of motion-corrupted averages, frequency drift correction, and zero-order phase correction.39 LCModel Version 6.3-1N was used to apply eddy current correction and quantification relative to water40 (Figure 2C). Basis sets for quantification (including Alanine, Aspartate, Choline, Creatine, Gamma-aminobutyric acid, Glucose, Glutathione, Glutamate, Glutamine, Glycero-phosphocholine, Glycine, Lactate, myo-Inositol, N-acetyl-aspartate, N-acetyl-aspartyl-glutamate, Phosphocoline, Phosphocreatine, Scyllo-inositol, and Taurine) were simulated using the FID-A toolbox based on exact sequence timings and RF pulse shapes.
MEGA-PRESS data were preprocessed and quantified by Gannet (v.3.3.2)37 (Figure 2B). Voxel tissue fractions of gray matter (GM), white matter (WM), and cerebral spinal fluid (CSF) were obtained. Metabolite levels were corrected for MRS voxel tissue fraction using calculations that use standard constants from literature.41 Metrics of spectra quality including the signal to noise ratio (SNR) and full-width at half-maximum (FWHM) peak height were obtained using Gannet and LCModel. Changes in metabolite levels between baseline and post (post-baseline) and between baseline and follow-up (follow-up-baseline) were calculated such that a negative value denoted a decrease, and a positive value denoted an increase in concentration.
2.4. Intensive Therapy
Participants attended a 2-week day-camp where they participated in fun activities as well as intensive individual physical therapy sessions. Prior to the camp, each participant created personalized goals according to the Canadian Occupational Performance Measure (COPM)42 with assistance from occupational therapists. COPM collects subjective ratings (scale 1-10) of performance (COPM-P) and satisfaction (COPM-S) of personalized goal achievement.33,38,39 Ninety-minute individual therapy sessions were led by occupational therapists in addition to 30 minutes of group therapy (120 minutes total) per day. For the first week, participants had their unaffected hand constrained with a soft, removable cast for constraint-induced movement therapy (CIMT). For the second week, the cast was removed for hand-arm bimanual intensive therapy (HABIT).43 Dose was quantified by therapists as the number of repetitions.
2.5. Motor Function Assessment
Participants completed motor function assessments led by occupational therapists at pre-camp (baseline), 1-week post-camp (post), and at a 6-month follow-up. Evidence-based, validated measures of motor function were used. The Assisting Hand Assessment (AHA) measures bimanual hand function in hemiparetic children by assessing 22 items with a 4-point rating scale including general arm use, fine motor skills, coordination, and grasping with scores ranging from 0 (no hand use) to 100 (normal hand use).44–46 The Box and Blocks test (BBT) assesses gross manual dexterity of the upper limbs by testing how many blocks can be moved from one area to another in 60 seconds with the affected (BBTA) and unaffected (BBTU) hands.47
2.6. Transcranial Direct Current Stimulation (tDCS)
Participants were randomized to receive either cathodal tDCS or sham. In tDCS, saline-soaked 25cm2 electrodes were placed on the scalp48 with the cathode over the non-lesioned M1 that was mapped for each participant with neuronavigation using MRI T1 images and an optical detection camera system (Brainsight2, Rogue Research Inc., Montreal; Polaris NDI Medical Solutions, Ontario).18,48 Single-pulse TMS of the contralateral first dorsal interosseous muscle was used to localize the area of interest.18,48,49 The anode was placed over the contralateral orbit. Using a current-controlled stimulator (Soterix Medical Inc., New York), current was automatically increased over 30 seconds to 1.0mA. In the sham group, electrode placement was the same, but the current ramped up to 1.0mA then down after 30 seconds to deliver the same sensation without sustained stimulation. tDCS was administered daily during the first 30 minutes of therapy.48
2.7. Statistical Analyses
Analyses were conducted using Jamovi (version 2.3.21).50 Shapiro-Wilk tested distribution normality. Chi-squared tests investigated distribution of sex and stroke side between stroke type and tDCS condition. As the MRS data were not normally distributed, Wilcoxon signed rank tests were used to compare metabolite levels between hemispheres at each time point. Age differences and spectra quality between stroke type and tDCS condition were compared using Mann-Whitney U-Tests. Spearman’s rho correlation coefficients (rS) assessed correlations between GABA+ levels, motor function scores, and therapy repetitions. Data was corrected for multiple comparisons via calculation of false discovery rate (FDR) adjusted p-values for chi-squared tests, Wilcoxon signed rank tests, and Spearman’s correlation coefficients corrected by metabolite.51
Six linear mixed models (LMM) were performed separately for each metabolite (GABA+, mI, tCho, tNAA, tCre, Glx) using hemisphere (lesioned, non-lesioned), tDCS condition (active, sham), stroke type (AIS, PVI), and time point (pre, post, follow-up) as fixed factors, participant as a random factor, and age as a covariate allowing for random intercepts. These LMMs were subsequently repeated to collapse over tDCS condition to increase power. Additional LMMs were performed for each motor outcome separately using hemisphere, tDCS condition, time point, and stroke type as fixed factors, participant as a random factor, with age as a covariate allowing for random intercepts. Bonferroni correction adjusted for multiple comparisons in LLMs.
3. Results
3.1. Participants
There were 66 participants from the Calgary and Edmonton cohorts of the SPORT trial, of which 50 had complete MRS datasets at baseline and were included. Of these, one participant was excluded due to lipid contamination from excessive head motion. Demographics for the final sample of 49 participants (AIS n=24, PVI n=25; active tDCS=20, sham tDCS=29) included for analysis is summarized in Table 1.
Sex was comparable between tDCS conditions, X2(1, N=49)=1.18, p=0.277, and stroke types, X2(1, N=49)=0.49, p=0.484. Age did not differ between tDCS condition, U(47)=288, p=0.976, and stroke types, U(47)=277, p=0.653.
All motor function scores (AHA, BBTA, BBTU, COPM-S, COPM-P) increased in both tDCS conditions with large effect sizes following the intervention (S1 Table) though there was no effect of tDCS (as reported in Hilderley, 2025).34
MRS spectra quality metrics of FWHM and SNR, were comparable between tDCS conditions (FWHM U(44)=211, p=0.310, SNR U(44)=246, p=0.823) and stroke type (FWHM U(44)=234, p=0.516, SNR U(44)=183, p=0.075).
3.2. GABA+ levels between hemispheres
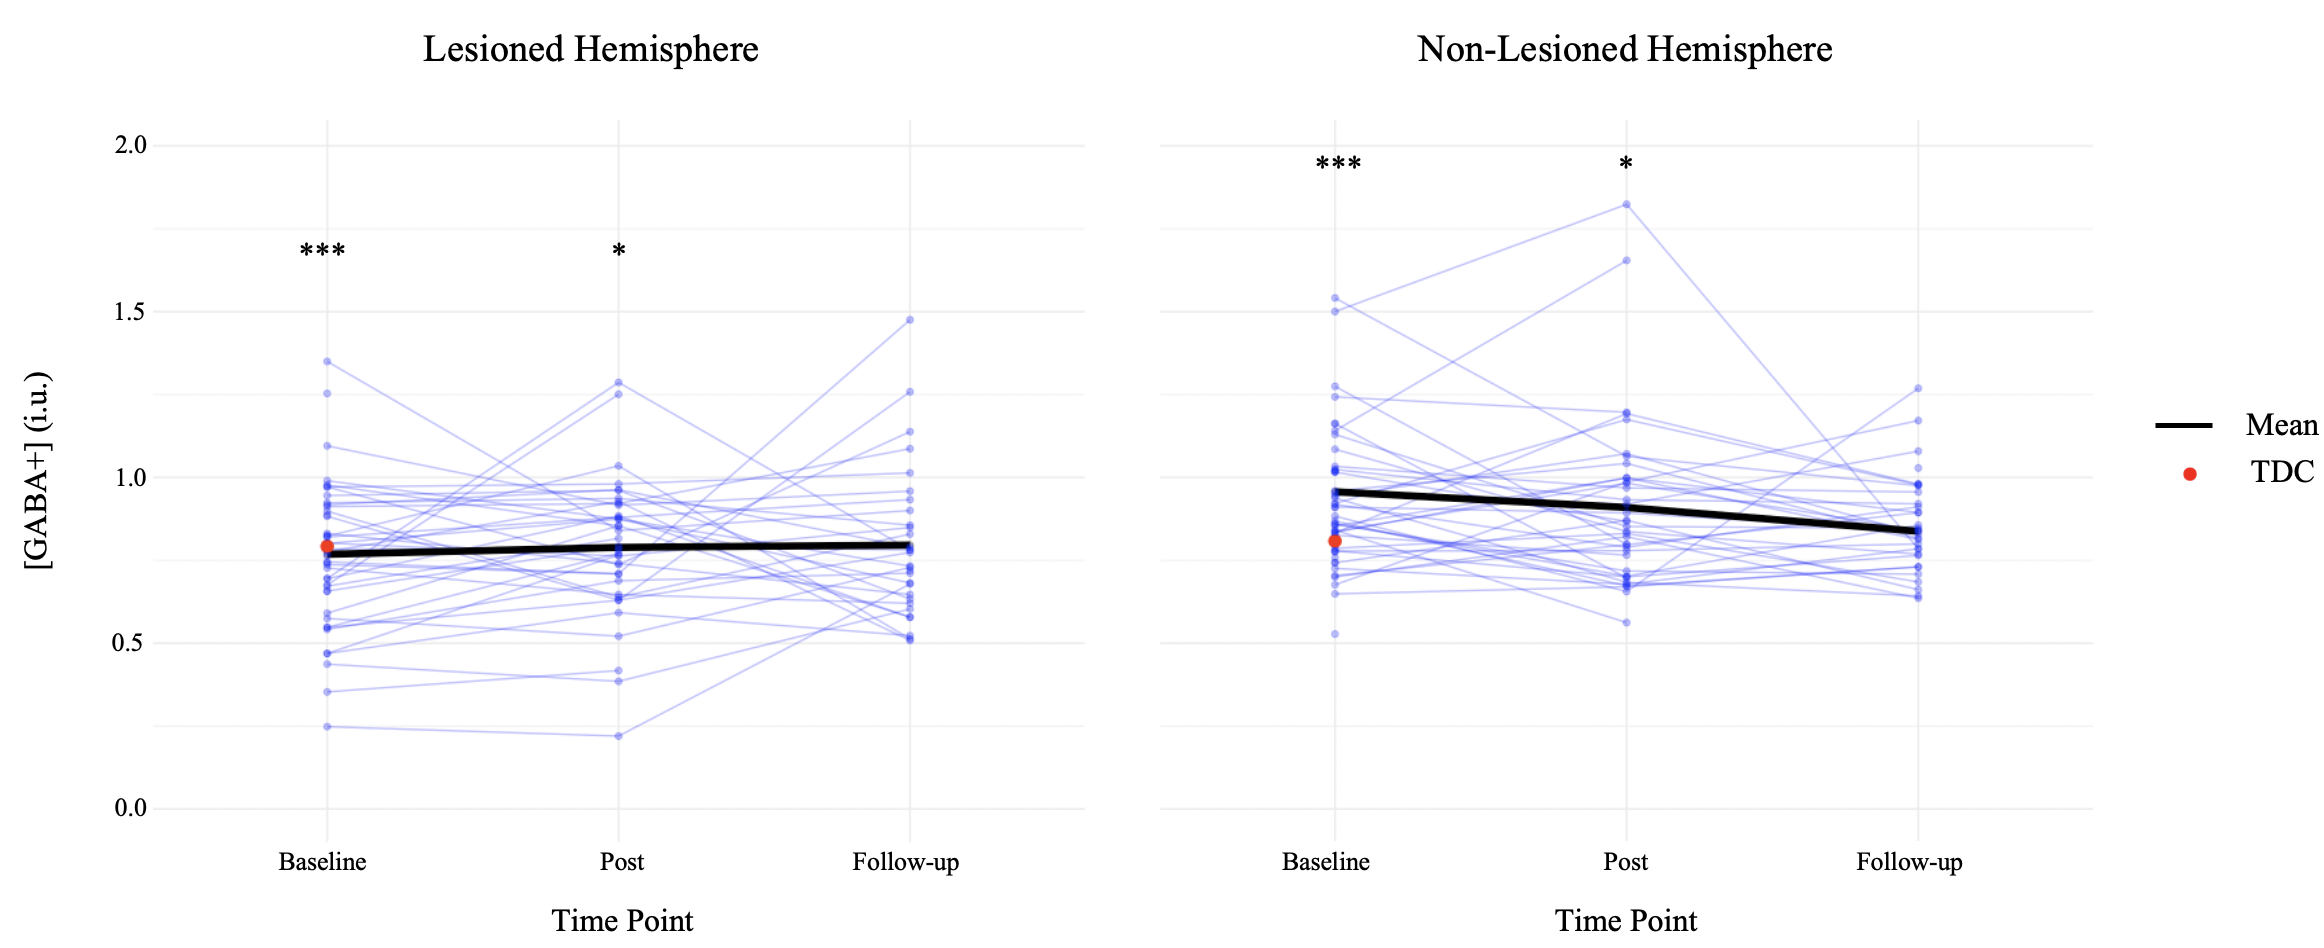
Bilateral M1 GABA+ levels were quantified at each time point (Table 2, Figure 3). At baseline, GABA+ levels were higher in the non-lesioned compared to the lesioned hemisphere, W(43)=164, p<0.001. Following intervention (post), GABA+ levels in the non-lesioned hemisphere remained higher than the lesioned hemisphere, W(32)=192, p=0.044. At 6-month follow-up, GABA+ levels between hemispheres were not different, W(29)=170, p=0.333.
_in_lesioned_and_non-lesioned_hemispheres_for_individual_participants_wi.png)
There was an effect of stroke type on GABA+ in the lesioned hemisphere (PVI>AIS), F(1,40.3)=4.20, p=0.047, but no effect in the non-lesioned hemisphere, F(1,23.3)=03.76, p=0.065. In either hemisphere, there was also no effect of time, and no tDCS by stroke type interaction on GABA+ levels.
A subset of participants (n=10) was matched by age and sex to TDCs (n=10) to compare baseline GABA+ levels (Table 3). Mean GABA+ levels from the TDC subset were included on Figure 3 for comparison. At baseline, GABA+ levels in both non-lesioned (mean=0.792, SD=0.053) and lesioned (mean=0.808, SD=0.09) hemispheres were not different from TDC (lesioned, U(18)=45, p=0.739; non-lesioned, U(18)=28, p=0.105).
M1 levels of tCho, tCre, Glx, mI, and tNAA in both hemispheres at each time point are summarized (Table 2). At baseline and post, NAA levels were higher in the non-lesioned hemisphere, W(43)=-3.53, p=0.001; W(29)=-2.33, p=0.027. At post and follow-up, mI was lower in the non-lesioned hemisphere, W(35)=2.76, p=0.009; W(29)=3.53, p=0.001.
3.3. Metabolite levels and motor function
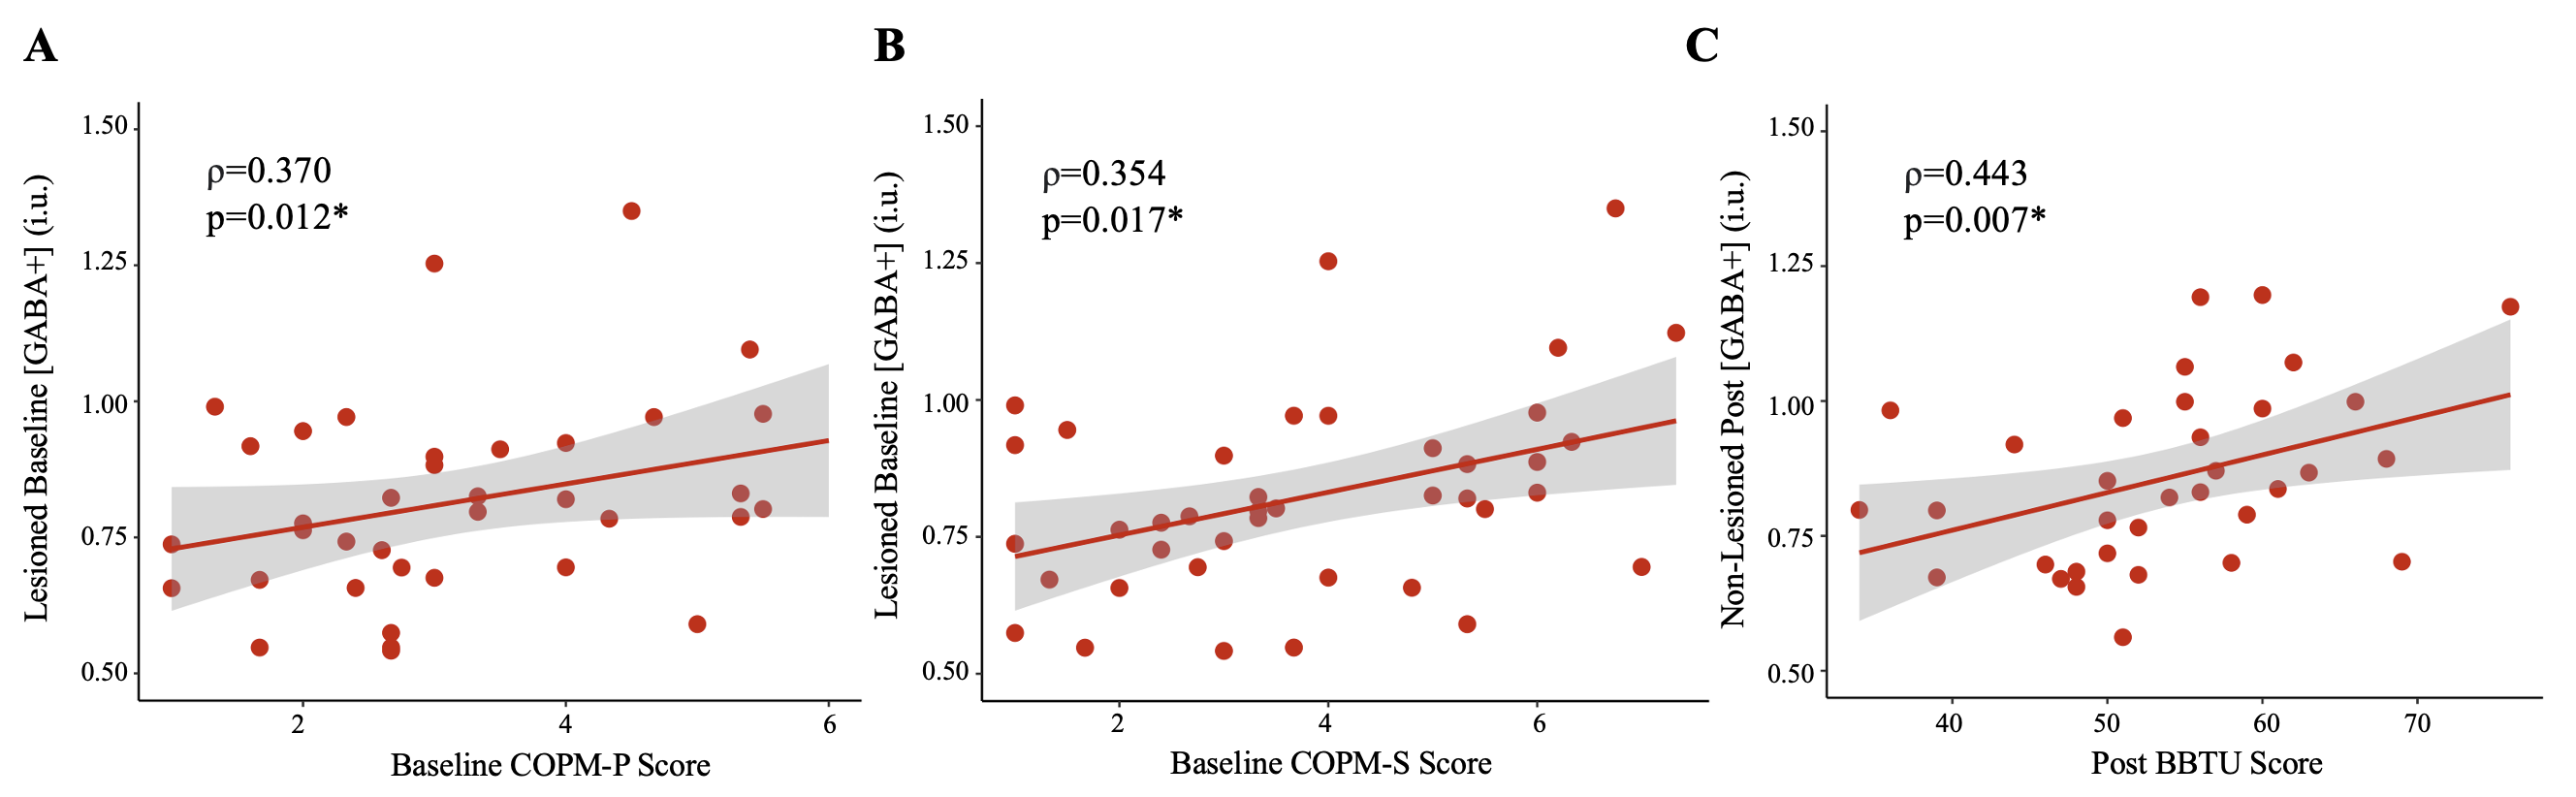
Baseline GABA+ levels in the lesioned hemisphere were positively correlated with baseline COPM-S (rS=0.354, p=0.017) and COPM-P (rS=0.370, p=0.012) scores (Table 4, Figure 4). In the non-lesioned hemisphere, post GABA+ levels were correlated with post BBTU scores (rS=0.443, p=0.007). No other correlations were observed. There was no association between change in GABA+ in either hemisphere to the change in any motor function scores between any time point.

Motor function score correlations with tNAA, tCho, tCre, mI, and Glx were investigated in a supplementary analysis (S2 Table). At baseline, tCho and tCre levels in the non-lesioned hemisphere were negatively correlated with baseline BBTU and BBTA scores respectively. At post-intervention, Glx and mI in the lesioned hemisphere were positively correlated with COPM-P scores, and mI was positively correlated with COPM-S scores. At 6-month follow-up in the lesioned hemisphere, BBTA scores were negatively correlated with Cre and mI, and Cre also had positive correlations with COPM-P and COPM-S scores.
The number of motor therapy repetitions (i.e. dose) varied between participants. Changes in M1 GABA+ levels in either hemisphere were not associated with CIMT counts (week 1), HABIT counts (week 2), or total therapy counts (CIMT + HABIT) (Table 5).
3.4. Effect of tDCS and time on metabolites
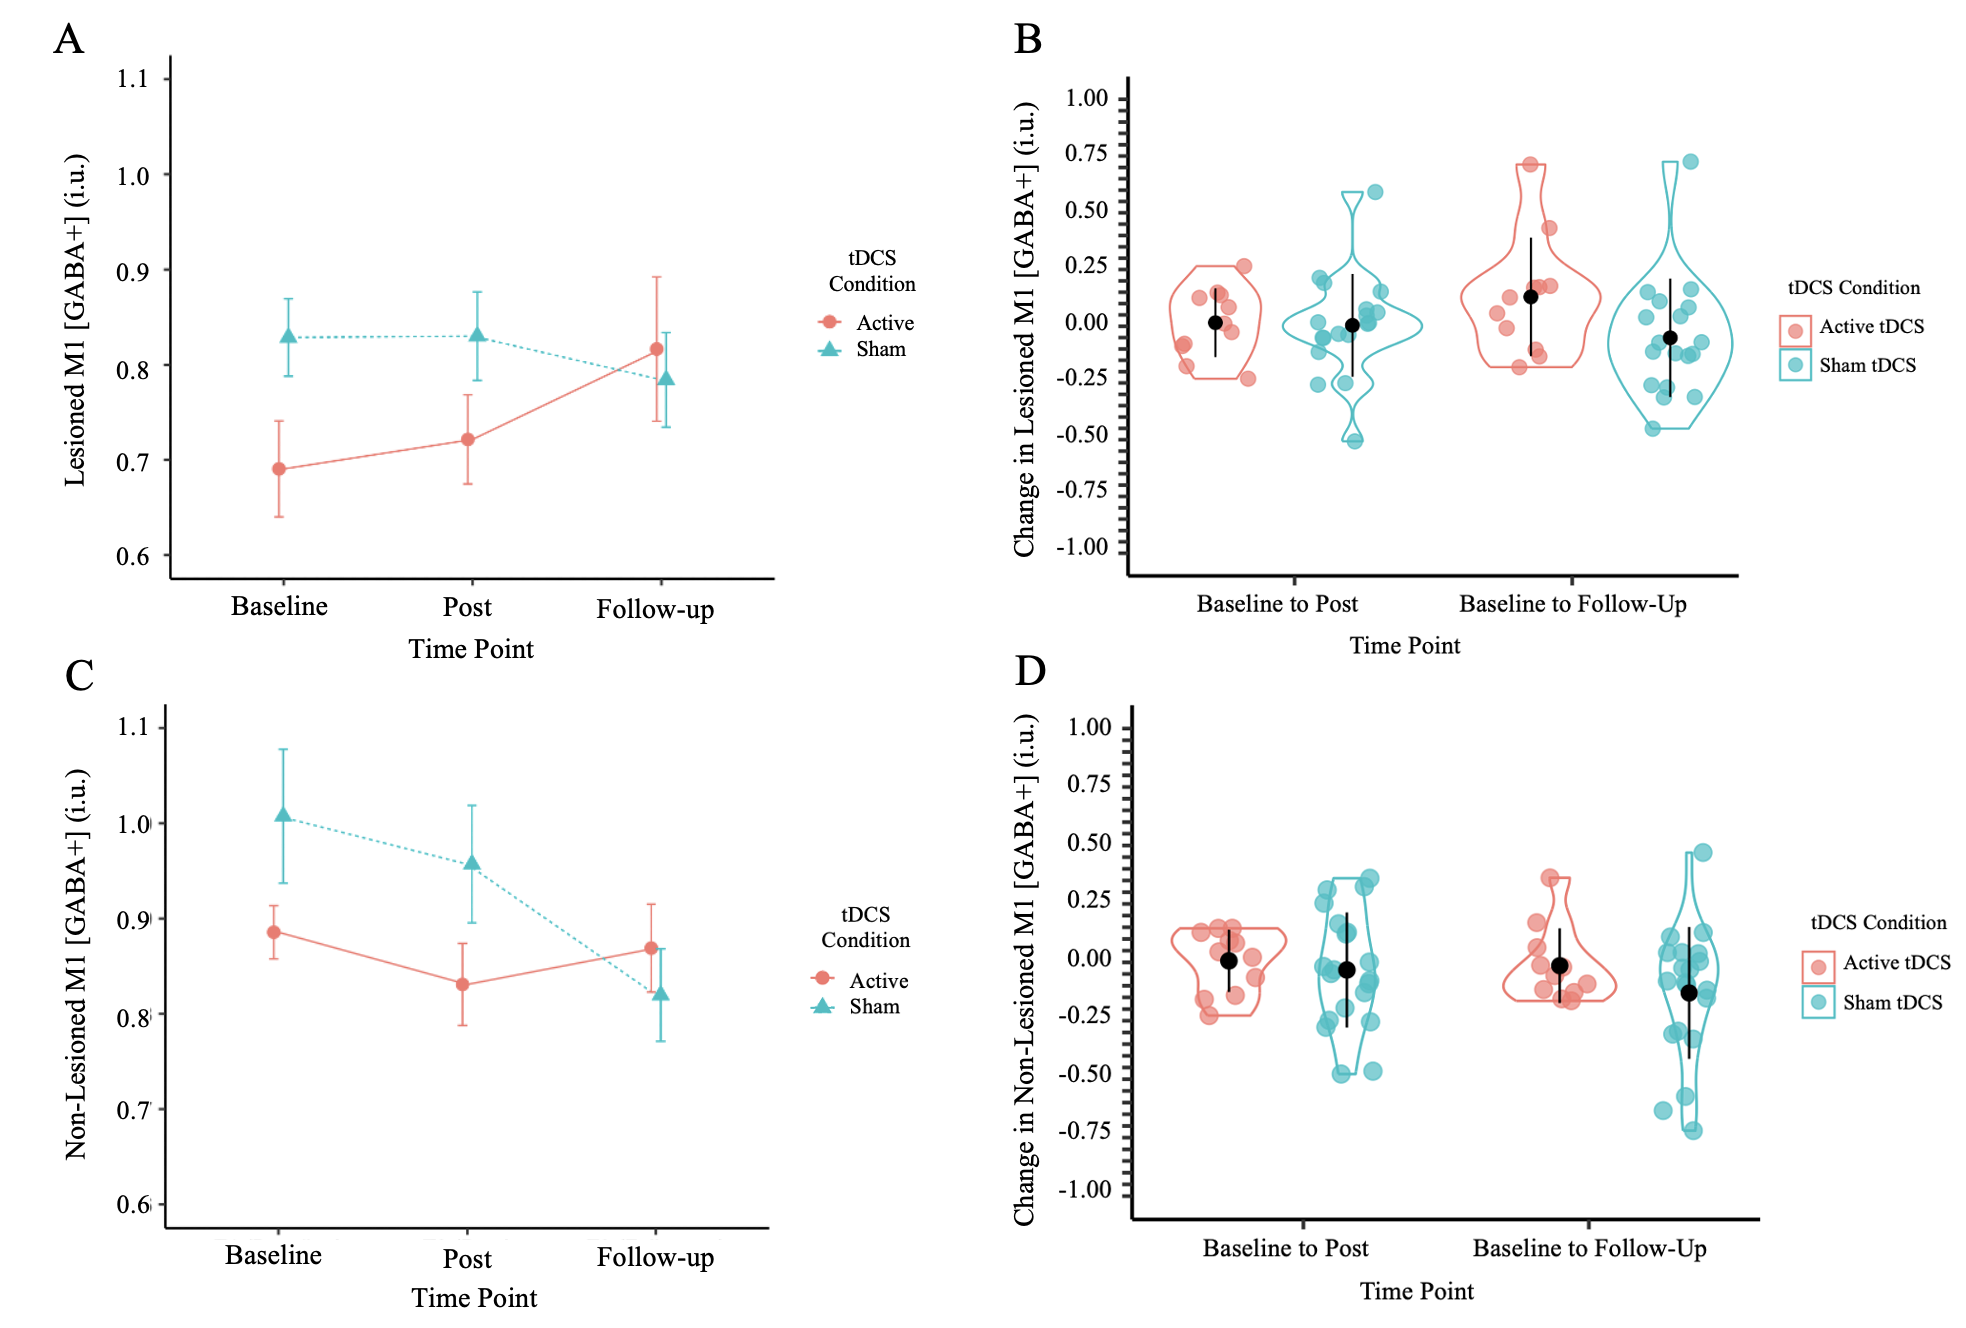
There was no effect of tDCS, time, or tDCS with time interaction on GABA+ in the lesioned, F(2, 72.3)=0.49, p=0.617, or non-lesioned hemisphere, F(2, 54.4)=1.94, p=0.153 (Figure 5A,C). In the second set of LMMs, tDCS as a variable was removed to investigate the effect of time on GABA+. GABA+ appeared to decrease in the non-lesioned hemisphere over time, however this was just a trend (F(2, 56.3)=2.86, p=0.066). There was no main effect of time on GABA+ levels in the lesioned hemisphere (F(2, 74.4)=0.22, p=0.802). The same pattern of results was found when the sample was reduced to include only participants with complete data at all three time points (n=33). There were no differences between tDCS condition in the change in GABA+ levels (post–baseline and follow-up–baseline) (Figure 5B, D).

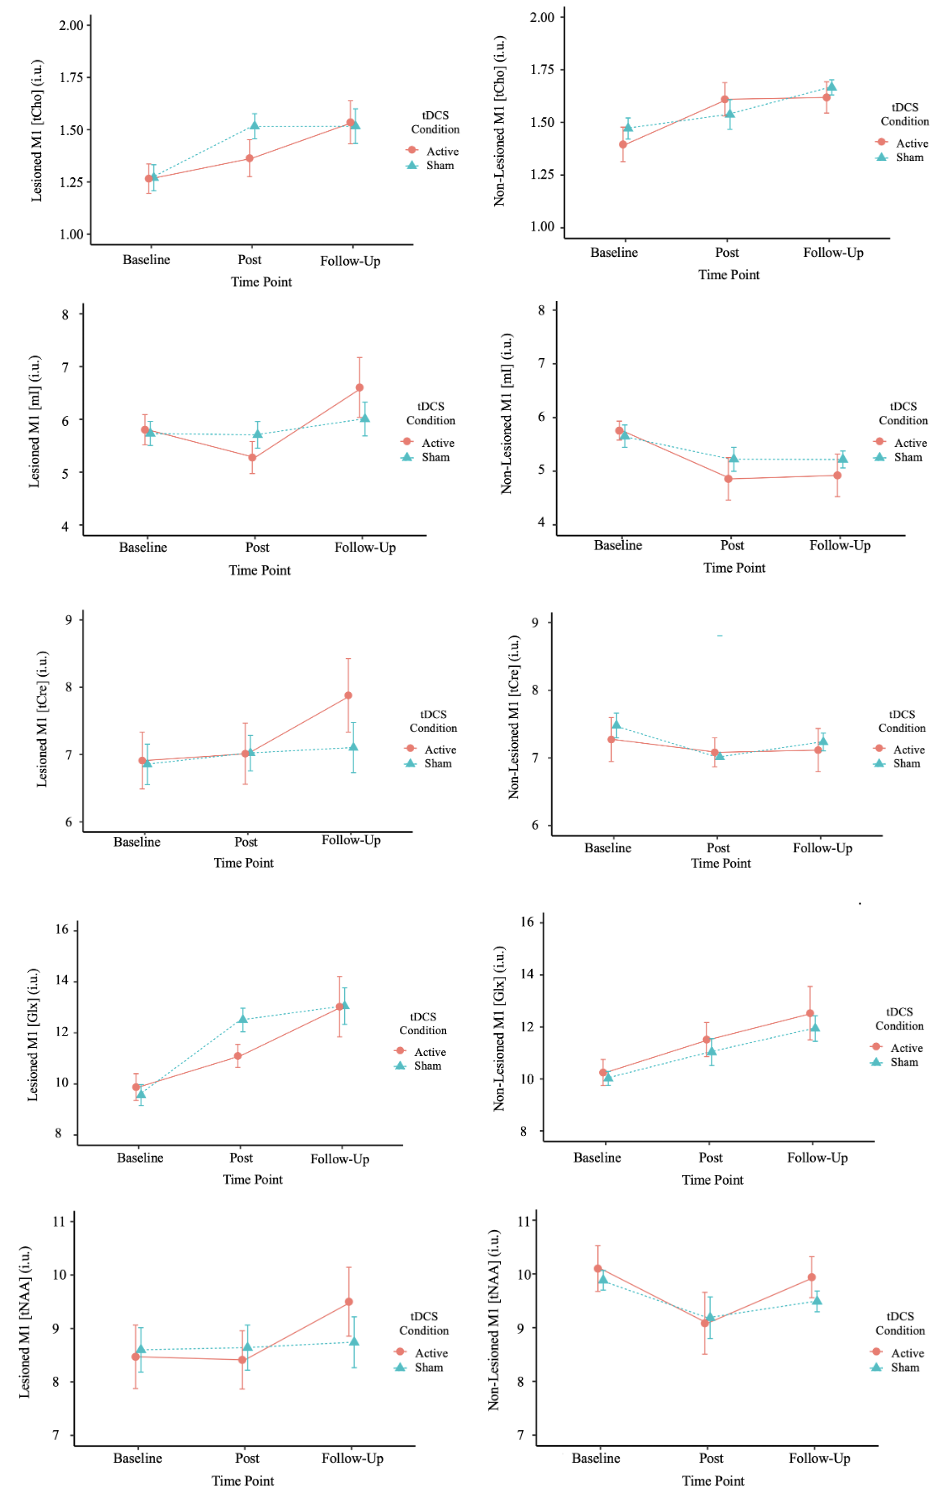
For the other five metabolites that were explored (Table 2), no effect of tDCS was observed for any metabolite (Figure 6). When collapsed over tDCS condition, we observed an increase in Glx in the lesioned (F(2, 79.9)=18.31, p<0.001) and non-lesioned (F(2, 83.2)=10.55, p<0.001) hemispheres from baseline to follow-up. Similarly, tCho increased in the lesioned (F(2, 77.6)=6.88, p=0.002) and non-lesioned (F(2, 80.0)=3.32, p=0.041) hemispheres from baseline to follow-up. In the non-lesioned hemisphere, mI decreased from baseline to follow-up (F(2, 72)=6.64, p=0.006).

4. Discussion
We have demonstrated that bilateral M1 GABA+ is measurable in children with PS undergoing intensive therapy and neuromodulation. GABA+ levels appear to be lower in lesioned hemispheres in children with PS before intervention, and may equalize following intensive manual therapy, with effects lasting 6 months and mirroring the time course of motor function increases. Simultaneous tDCS over the non-lesioned M1 as an intervention does not appear to have large effects on M1 GABA+ levels.
When investigating GABA+ between hemispheres, the lesioned hemisphere had lower M1 GABA+ levels than the non-lesioned hemisphere at baseline and 1-week post intervention, but not at the 6-month follow-up. Over the same period, we observed large motor function improvements. This is consistent with previous MRS research that found that GABA+ in bilateral sensorimotor cortices are correlated in healthy adults,52 which may suggest that effective intervention may be associated with GABA+ levels shifting towards a balance between hemispheres. Additionally, subjective ratings of performance and satisfaction (COPM) correlated with baseline GABA+ measures and improved following the same time course, suggesting possible translational significance relevant to clinical function.
We expected GABA+ levels to decrease with cathodal tDCS, engaging motor cortex plasticity and optimizing motor learning in these patients; however, our comparisons between active and sham tDCS conditions revealed no effect of tDCS on M1 GABA+ levels or motor function. Children in both tDCS conditions showed the same patterns of improvement without the additive effects of tDCS suggested in smaller trials.19 Consistent with this, in the larger SPORT trial sample, there was also no evidence that tDCS had an effect on enhancing motor function improvement53 despite previous evidence that cathodal tDCS may have positive impacts on motor learning in healthy children.16 In our study investigating GABA, there was no difference in GABA+ by tDCS condition and no difference in tDCS condition in functional improvement. This could imply that motor cortex plasticity in children with PS is mediated more by alterations in excitatory (Glx) rather than inhibitory (GABA) systems, which is consistent with our findings of increasing bilateral Glx levels concurrent with therapy, however this requires further investigation.
We found that GABA+ levels varied by stroke type in the lesioned hemisphere. AIS and PVI vary in their timing, location, and resulting neurophysiology which may have contributed to the lack of observable tDCS effects and differences in GABA+. Children with PVI often have intact cortices since their stroke-related damage is usually limited to periventricular areas. By contrast, children with AIS can have variable degrees of cortical and subcortical damage possibly explaining the differential GABA+ levels. Additionally, in children with PS, there are individual differences in neuroanatomy (i.e. skull thickness, gyral folding patterns) that may impact the dose required for maximum effectiveness of therapy, response to tDCS, and impacts on neurochemistry.12,54–57 Though since tDCS was applied to the non-lesioned hemisphere, these idiosyncratic anatomical effects are likely minimal. We could have also chosen to do additional analyses of participants who were “responders” and “non-responders.” This is defined by changes of their assessment scores where “responders” have changed 5 points on the AHA and 2 points on COPM from baseline scores.46,58 To preserve statistical power, we chose not to include this analysis; however, the paper presenting the results from the SPORT trial has included this analysis.34 Additionally, the distribution of active and sham tDCS in our group poses a limitation. Although the SPORT trial recruited many participants and randomly assigned tDCS condition evenly, the group with MRS data used for this study was smaller. This resulted in an unequal distribution of sham (n=29) versus active tDCS (n=20). This may have impacted the interpretation of our results and the potential effect of tDCS on GABA+ levels may have been smaller than anticipated.
We observed positive correlations between baseline lesioned M1 GABA+ levels and COPM performance and satisfaction scores. The COPM is a subjective rating scale for children to rate their physical performance and satisfaction with achieving personalized goals. This contrasts with the AHA, and BBTA measures which are used to objectively measure motor ability after stroke. Although correlations between GABA+ and COPM were observed, the absence of similar correlations with objective motor function measures suggests that baseline GABA+ is not associated with clinically measured motor function in this population but rather with individualized subjective impressions of motor abilities, which is nonetheless important for quality of life and participation. It also may be that clinically implemented standardized assessments, do not accurately capture and quantify all elements of clinically relevant motor function. Our results reinforce the importance of acquiring personalized patient-centered COPM measures since these goals capture what is important to each child in their daily lives. This finding also demonstrates that GABA+ levels could potentially have a role in predicting the participants’ success in therapeutic interventions based on the goals they were hoping to achieve.
An additional correlation between non-lesioned M1 GABA+ and BBTU scores 1-week following intervention was also observed. Since cathodal tDCS was applied to the non-lesioned M1, there was the possibility of an inhibition of that brain region corresponding to a functional decrease in the contralateral, or unaffected, hand. By contrast, we found an increase in Glx in both hemispheres, an improvement of the unaffected hand after intervention, and no effect of tDCS (Figure 6, S1 Table). This generalization of the improvement in function to the unaffected hand may reflect the effects of intensive bimanual (HABIT) therapy performed in the second week of camp and the use of this hand in daily activities as function in both hands improved.
We also found that Glx increased in both hemispheres over time when collapsed over tDCS condition. Trends of increasing Glx were observed when tDCS was included as a fixed factor, however no significant effects were seen. This could imply that motor cortex plasticity in children with PS undergoing intensive therapy is associated with a relative shift in the balance of Glx rather than GABA, however this is currently unknown and requires further investigation. Our finding contrasts to previous research using cathodal tDCS as an intervention in children with PS that observed decreases in Glx in the active tDCS condition in the non-lesioned hemisphere.12 In our study, we also did not find a correlation between GABA and Glx in either hemisphere at any time point. It seems that the relative balance of excitation and inhibition may not be reflected in the covariance between Glx and GABA concentrations. Concentrations of these two neurotransmitters can also vary independently which makes the Glx findings interesting, functionally specific, and possibly clinically relevant.
A limitation of this study is that MRS does not provide information on the underlying cause of metabolite level changes. For instance, MRS does not allow us to know whether changes to M1 GABA+ levels are due to changes to GABAergic neuron density or altered concentration of GABA within a normal density of these neurons.59 A study investigating GABA receptors in children with hemiparesis using F-fluoroflumazenil positron emission tomography found that the binding potential of GABA receptors was increased in the ipsilateral M1, indicating an increase in expression of these receptors. This may be an adaptation following brain injury in these children which could be a contributing factor of the adverse motor development in these children.60 Future studies should investigate multimodal methods in addition to MRS to further understand motor system GABA+ changes in this population.
Our study had additional limitations. Although the SPORT trial recruited many participants, the number of those with high quality MEGA-PRESS GABA+ data was smaller, thus only modestly powered. This may also present a bias, those who are more impacted by stroke (and younger) may have found it harder to stay still while having an MRI scan and were not able to have the MEGA-PRESS sequence. Also, in our sample of TDC data,18 the participants were much older than the PS group, thus only a small subset (10 participants) could be used to match the age of our study participants, making it difficult to make comparisons with low sample size power. Ideally, controls would have been prospectively included in our study.
5. Conclusion
Motor cortex GABA levels are altered in children with perinatal stroke but do not appear to change with intensive motor learning or tDCS. Investigating the role of neurochemistry underlying available interventions can help improve our understanding of PS and the most effective care for these patients.
Data and Code Availability
This paper contains original data which cannot be openly shared due to participant confidentiality. The data and code can be made available from the corresponding author upon request which includes submission of a formal project outline, approval from the requesting researcher’s local ethics committee, and a formal data sharing agreement.
Author Contributions
Paulina M.B. Hart: Conceptualization, Methodology, Software, Formal Analysis, Investigation, Data Curation, Writing – Original Draft, Writing – Review & Editing, Visualization. Tiffany K. Bell: Software, Validation, Writing – Review & Editing. Ashley D. Harris: Validation, Writing – Review & Editing. Helen L. Carlson: Conceptualization, Methodology, Software, Validation, Formal Analysis, Investigation, Resources, Data Curation, Writing – Review & Editing, Supervision. Adam Kirton: Conceptualization, Methodology, Validation, Investigation, Resources, Data Curation, Writing – Review & Editing, Supervision, Project administration, Funding acquisition.
Funding Sources
The SPORT and AMPED trials were supported by funding from the Canadian Institutes of Health Research (CIHR). Additional graduate funding (PMBH) was received via an Alberta Graduate Excellence Scholarship and a William H. Davies Medical Research Scholarship from the University of Calgary, the Bonifield Family Women in STEM Scholarship via the Alpha Omicron Pi Foundation, and the Dr. Gary McPherson Leadership Scholarship from the Government of Alberta. Postdoctoral funding (TKB) was supported by a One Child Every Child Postdoctoral Fellowship and a Cumming School of Medicine Postdoctoral Fellowship from the University of Calgary.
Conflicts of Interest
The authors declare no conflicts of interests that may bias or could be perceived to bias this work.