

Introduction
Overview
Various neuroimaging methodologies, such as single photon emission computerized tomography (SPECT) and functional magnetic resonance imaging (fMRI), have been used to capture clinically meaningful differences in psychiatric populations. Measuring blood oxygenation level-dependent (BOLD) fMRI signals have resulted in many important findings, such as classifying depressive symptoms1 and insights into the brain’s functional architecture.2 Correlating BOLD activation at rest across brain regions (i.e., resting state fMRI functional connectivity3) has identified a number of replicable, canonical functional connectivity patterns/networks that correspond to various functional domains.4–6 Blood flow is related to the BOLD fMRI signal, and has also been measured in SPECT studies7 to provide insight into brain perfusion (i.e., blood flow8,9). Using technitium-99, a nuclear medicine-based radioactive isotope, blood flow throughout the body is visualized in SPECT imaging. Importantly, cerebral blood flow (CBF) is a measure of physiological activity. Consequently, the relationship between blood flow and behavior have been considered in relation to psychiatric symptoms across disorders. To this end, SPECT has been used to broadly study neuropsychiatric disorders10 and to identify regions linked to disorders such as neurodegenerative parkinsonism.11 While resting state fMRI studies have extensively focused on brain networks, SPECT studies have typically utilized voxel-wise correlations in clinical research - for example, in cardiac studies12 and in Parkinson’s disease - by incorporating machine learning techniques.13,14 These studies investigate macro-scale brain networks across disorders, providing insights into covariation among brain regions and allowing identification of network-specific disruptions linked to brain disorders.
Brain network connectivity is an important consideration in neuropsychiatric disorders. fMRI studies have notably focused on intrinsic brain networks, which have been particularly helpful in identifying widespread patterns of dysconnectivity, especially in disorders such as schizophrenia.15 Schizophrenia is a multifaceted, complex disease with no known specific cause for its onset. A complex psychiatric disorder with no diagnostic biomarker identified, schizophrenia is characterized by the presence of positive and negative symptoms such as hallucinations, delusions, grandiose thoughts, and social withdrawal along with cognitive impairments.16–18 Studies have shown robust findings linking auditory hallucinations to brain regions related to visual, memory, and language areas. These areas include Broca’s area, superior temporal gyrus (STG), putamen, and hippocampus, all which demonstrate dysconnectivity broadly related to hallucination symptoms in patients.19–23
The relationship between brain connectivity and hallucinations have also been studied with other imaging modalities. Recent positron emission tomography (PET) and SPECT studies have noted other widespread brain regions associated with hallucinations, including the inferior frontal gyrus, cerebellum, parahippocampus and thalamus showing increased perfusion activity when patients experienced hallucinations.24 Although hallucinations have been extensively studied using various imaging approaches, few studies exist which explicitly compare fMRI- and SPECT-based approaches to identify whether similar perfusion activity is noted while patients experience hallucinations. To understand specific network-related dysfunctions in this disease, various studies have investigated functional network covariation (FNC) between different networks that are disrupted in schizophrenia. More specifically, in SPECT literature, perfusion has been linked with positive and negative symptoms in schizophrenia.25–27 Studies have shown relationships between CBF and antipsychotic medication in first episode psychotic patients (FEP27,28) and broadly in schizophrenia (see comprehensive review and meta-analysis),29 as well as key differences between reward processing, default mode, and language processing in patient groups such as schizophrenia versus depressed subjects.30 Given these findings, perfusion can be considered a robust measure in identifying brain-behavior relationships in schizophrenia.
Additionally, the quest for biomarkers of schizophrenia is ongoing, with perfusion differences considered possible biomarkers of interest.25 The term biological marker or “biomarker” is defined as “quantitative measurements that provide information about biological processes, a disease state, or about response to treatment, providing much-needed insight into preclinical and clinical data” 81. In the context of schizophrenia, a biomarker can be identified as a broad set of methods for clinical diagnosis, with various genetic and neuroimaging methods being used to understand the etiology of schizophrenia.31–35 More specifically, gene abnormalities to dysconnectivity in brain networks have been theorized as possible reasons for the development of schizophrenia.32 Although extensive discussions from genes to neurodevelopmental disruptions to neurotransmitter imbalances have been noted in the literature,34,36 there has not been a consensus to date on a method, marker, or test that uniquely identifies schizophrenia. To aid in precision psychiatry and improving clinical diagnostic measures, various machine learning and classification techniques have been utilized as potential biomarkers.35,36
While fMRI and SPECT are useful methodologies for identifying aberrant connectivity in schizophrenia, multivariate techniques such as independent component analysis (ICA), which assess covarying components/networks in the brain have been widely utilized to identify possible biomarkers pertaining to various psychiatric disorders, including schizophrenia.15,36,37 ICA allows the extraction of components from functional brain networks to understand which parts of the brain are most active both at rest and while performing a task.38 A type of blind source separation, ICA was originally used to solve the “cocktail party phenomenon” where signals from a source (e.g., speech signals) could be separated and unmixed to understand each individual source of noise .39,40
Since its inception, ICA has been adapted to understand individual sources of signal in brain imaging data.41–43 Using ICA allows for more precise estimation of functional brain networks, as well as differentiation of brain networks related to function (e.g., differentiating bipolar, schizophrenia, and healthy controls from each other based on task-based fMRI data).44 ICA has also been used to extract covarying networks in various modalities including structural MRI,45 subject-level fMRI activation, or amplitude of low frequency fluctuation maps,38 PET data,46,47 and in one case, SPECT data.11 Additionally, it has been widely used to identify brain regions that exhibit coherent fluctuations, i.e., functional connectivity, captured in the spatial maps of each component in resting state fMRI data. Using ICA to study dysfunction in schizophrenia has yielded useful results, including identifying functional dysconnectivity between subgroups.48 Additionally, it has proven to be a powerful tool for identifying differences in connectivity patterns with high specificity that would otherwise be undetected using other methods.49
More recently, the use of spatially constrained ICA (scICA) with a template-based approach has enabled a fully automated method for analyzing FNC across various disorders. This approach enhances comparability across studies while also capturing individual subject heterogeneity.50 Spatially constrained ICA has yielded meaningful and exciting results, specifically understanding improved feature classification across disorders. The scICA NeuroMark pipeline has successfully identified unique brain impairments in schizophrenia and autism, with high classification accuracy that distinguishes clinical disorders such as bipolar disorder and major depressive disorder, and has also shown changes in the brains of individuals with Alzheimer’s disease.51 Accurately capturing unique features across diagnostic profiles could assist in more precise clinical diagnoses for clinicians, such as distinguishing schizophrenia from schizophreniform or bipolar disorders. Few studies, to date, have focused on evaluating brain networks estimated from SPECT imaging and understanding their relationship to clinical and cognitive variables related to schizophrenia. A notable gap in the literature is the lack of approaches for providing useful and detailed information about how mental illness impacts covarying brain networks in SPECT data.
Additional gaps in the literature include comparisons between SPECT with fMRI findings, particularly in relation to clinical symptoms such as auditory hallucinations. More specifically, little research has examined whether a comparative approach between fMRI and SPECT can identify intrinsic connectivity networks (ICNs) and independent components (ICs) in brain regions and networks associated with auditory hallucinations.
Thus, the purpose of this current study was to study group differences in patients with schizophrenia and healthy controls using fully automated, whole brain fMRI-guided scICA applied for the first time on SPECT data. We evaluated both the individual subject expression of spatial brain networks as well as the whole brain SPECT connectome (assessed as covariation among subjects) to understand neuroimaging links to schizophrenia. Additionally, we examined the relationships between loading parameters in patients compared to clinical symptoms, as well as demographic covariates such as age and sex. By utilizing insights from previous fMRI studies and the NeuroMark template, our goal was to analyze SPECT data to investigate differences in network covariation between a large clinical sample of schizophrenia patients versus controls. We expect that based on previous fMRI studies utilizing NeuroMark, aberrant/disrupted connectivity will be identified in auditory, subcortical, and thalamocortical networks.52,53 We also expect to see disrupted connectivity in other large-scale brain networks, such as the default mode network ,54 with associations between positive symptoms (i.e., hallucinations) and widespread dysconnectivity.
Methods
SPECT Imaging Procedure and Preprocessing
76 healthy controls and 137 schizophrenia patient SPECT images were acquired from Amen Clinics (https://www.amenclinics.com/). We provide demographic information of subjects in both healthy control and patient groups (Table 1). Race classification was done based on the Center for Disease Control’s guidelines for race reporting (https://www.cdc.gov/nchs/hus/sources-definitions/race.html).
Healthy participants were recruited under a prior study of SPECT in healthy participants and approved by Western IRB (WIRB # 20021714), with all participants consented (Integ Review Board #004-Amen Clinics Inc). Participants were excluded from the original study if they, or their first-degree relatives, had suicidal behavior, unstable medical conditions, epilepsy, any history of mental illness, head injury or other neurological disorders, dementia, intellectual disability, or substance abuse/dependence disorders. All twelve sites utilized either the double- or triple-headed gamma camera for scans with the same data acquisition parameters in line with Amen Clinic regulatory procedures as listed below. Adult participants were scanned with the following dosage amounts calibrated by weight (Table 2):
Each patient participated in two SPECT brain scans, acquired during rest and while performing a Conners Continuous Performance Test (Conners Continuous Performance Test, CCPT-II, Multi-Health Systems, Toronto, Ontario55) across twelve clinical imaging sites. Scans were performed between 2004 – 2022. SPECT scans were acquired using a Picker (Philips) Prism XP 3000 double-headed gamma camera (Picker Int. Inc., Ohio Nuclear Medicine Division, Bedford Hills, OH, USA) as well as the PRISM3000 triple-headed gamma camera (Picker Int. Inc., Ohio Nuclear Medicine Division, Bedford Hills, OH, USA) with low energy high resolution fan beam collimators. Scanning was completed prior to any diagnoses or treatment. Patients that visit the Amen Clinic have visited a high number of providers prior to their intake into the clinic and have tried various medications with little success. More specifically, the average failure rate is 3.3 providers and 5 medications prior to intake into the Amen Clinic (https://www.amenclinics.com/faq/), which accounts for why patients were scanned prior to diagnoses or treatment. For each procedure, an age- and weight-appropriate dose of 99mTc–hexamethylpropyleneamine oxime (HMPAO) was administered intravenously at rest. For the rest scans, patients were injected while they sat in a dimly lit room with their eyes open. Patients were scanned for approximately 30 minutes after injection. Data acquisition yielded 120 images per scan with each image separated by three degrees, spanning 360 degrees. A low pass filter was applied with a high cutoff and Chang attenuation correction performed.56,57 The resulting reconstructed image matrices were 128x128x78 with voxel sizes of 2.5mm3.
Additionally, the SPECT scanner system resolution had the following specs: 3.5 mm at the detector surface, and 8 mm at 10 cm. The ACR resolution phantom resulted in a resolution of 6.4 mm. The dual-headed cameras had the same spatial resolution as the triple-headed cameras, but lower sensitivity. The detector panels were the same for both camera types, however the newer camera has three heads instead, and utilized the same older collimators. This impacted the signal to noise ratio (SNR) of the images, but not the resolution. For both scanners, the algorithms remained the same, with a filtered back projection and the use of a low-pass Butterworth filter (order=5.0, cut off=0.25).
For voxel-based analyses, images were aligned to the Montreal Neurological Institute (MNI) space with the advanced normalization tools (ANTs version 2.2.057, RRID:SCR_004757) using a SPECT template, resulting in an image matrix size of 799668 with isotropic voxel sizes of 2.0mm3. SPECT images were scaled to the within-scan maximum voxel and noise outside of the brain was removed using a 50% of maximum threshold prior to registration. After the thresholded images were aligned to MNI space and the transformation applied to the un-thresholded images, a brain mask derived from the MNI 15258,59 template was used to remove noise outside the brain from the unthresholded images for use in the statistical models. Registered SPECT scans were visually checked for the absence of severe functional abnormalities or artifacts and proper registration to the MNI space.
ICA Processing
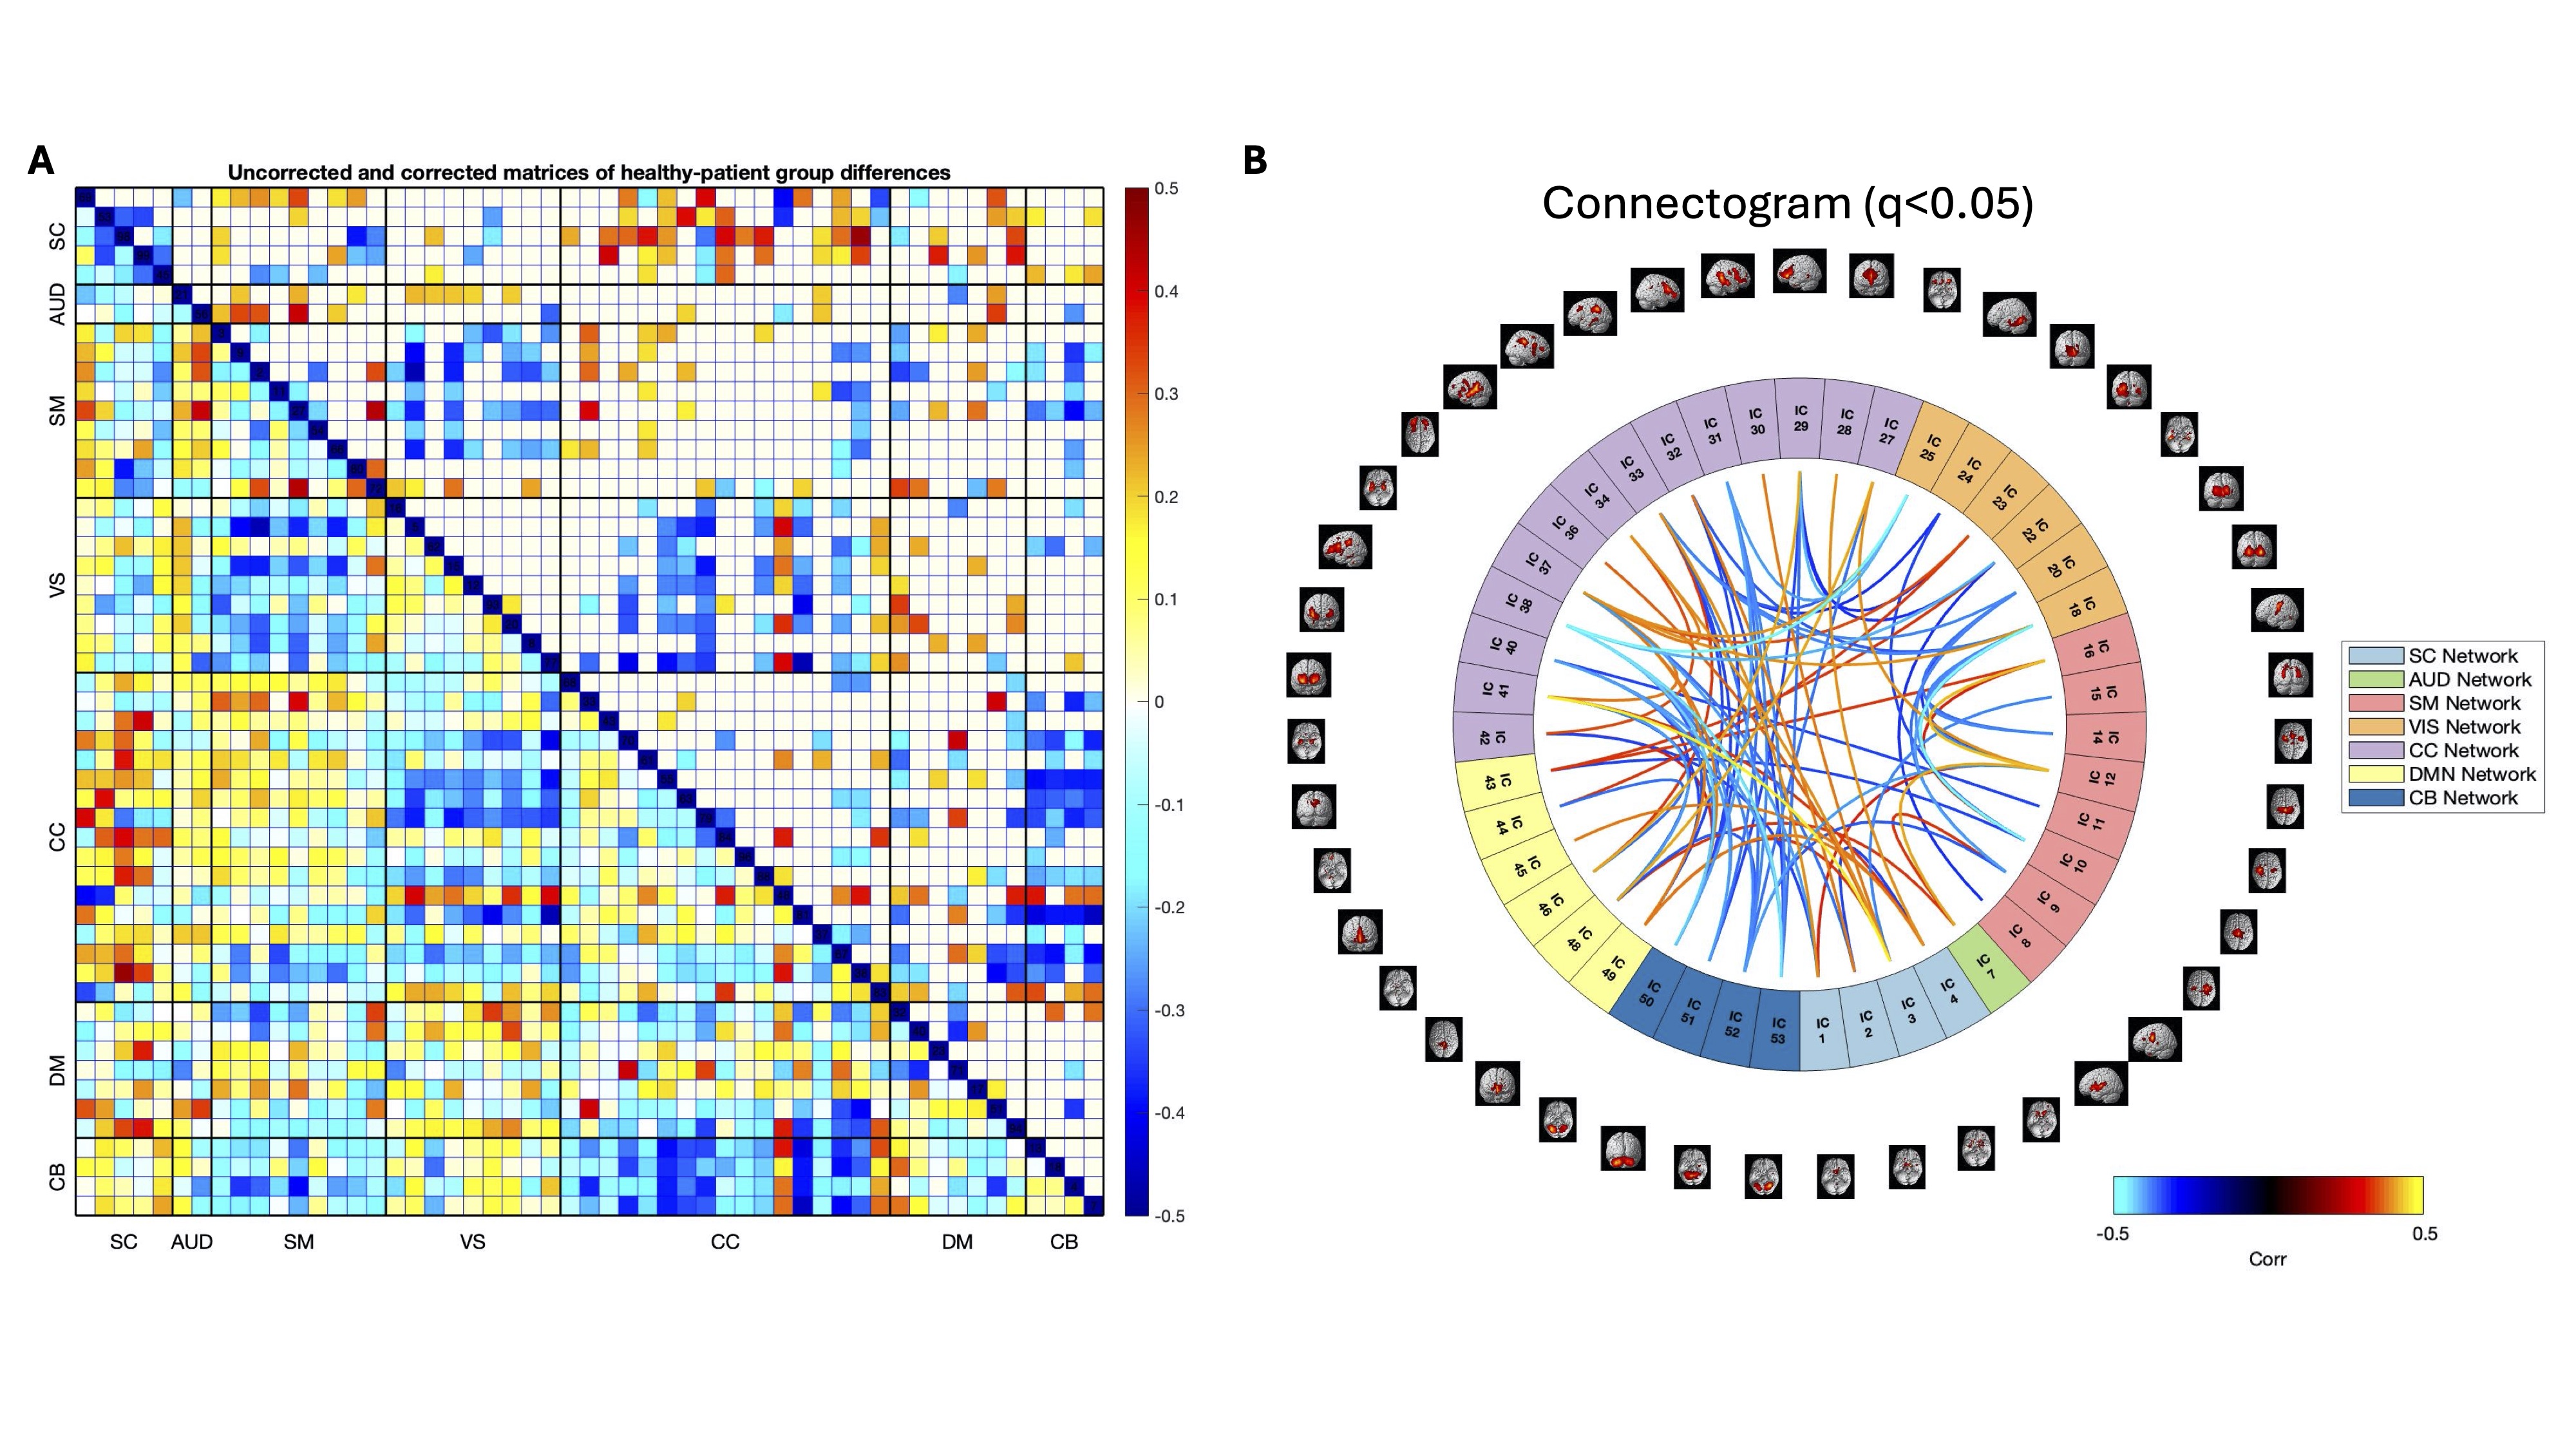
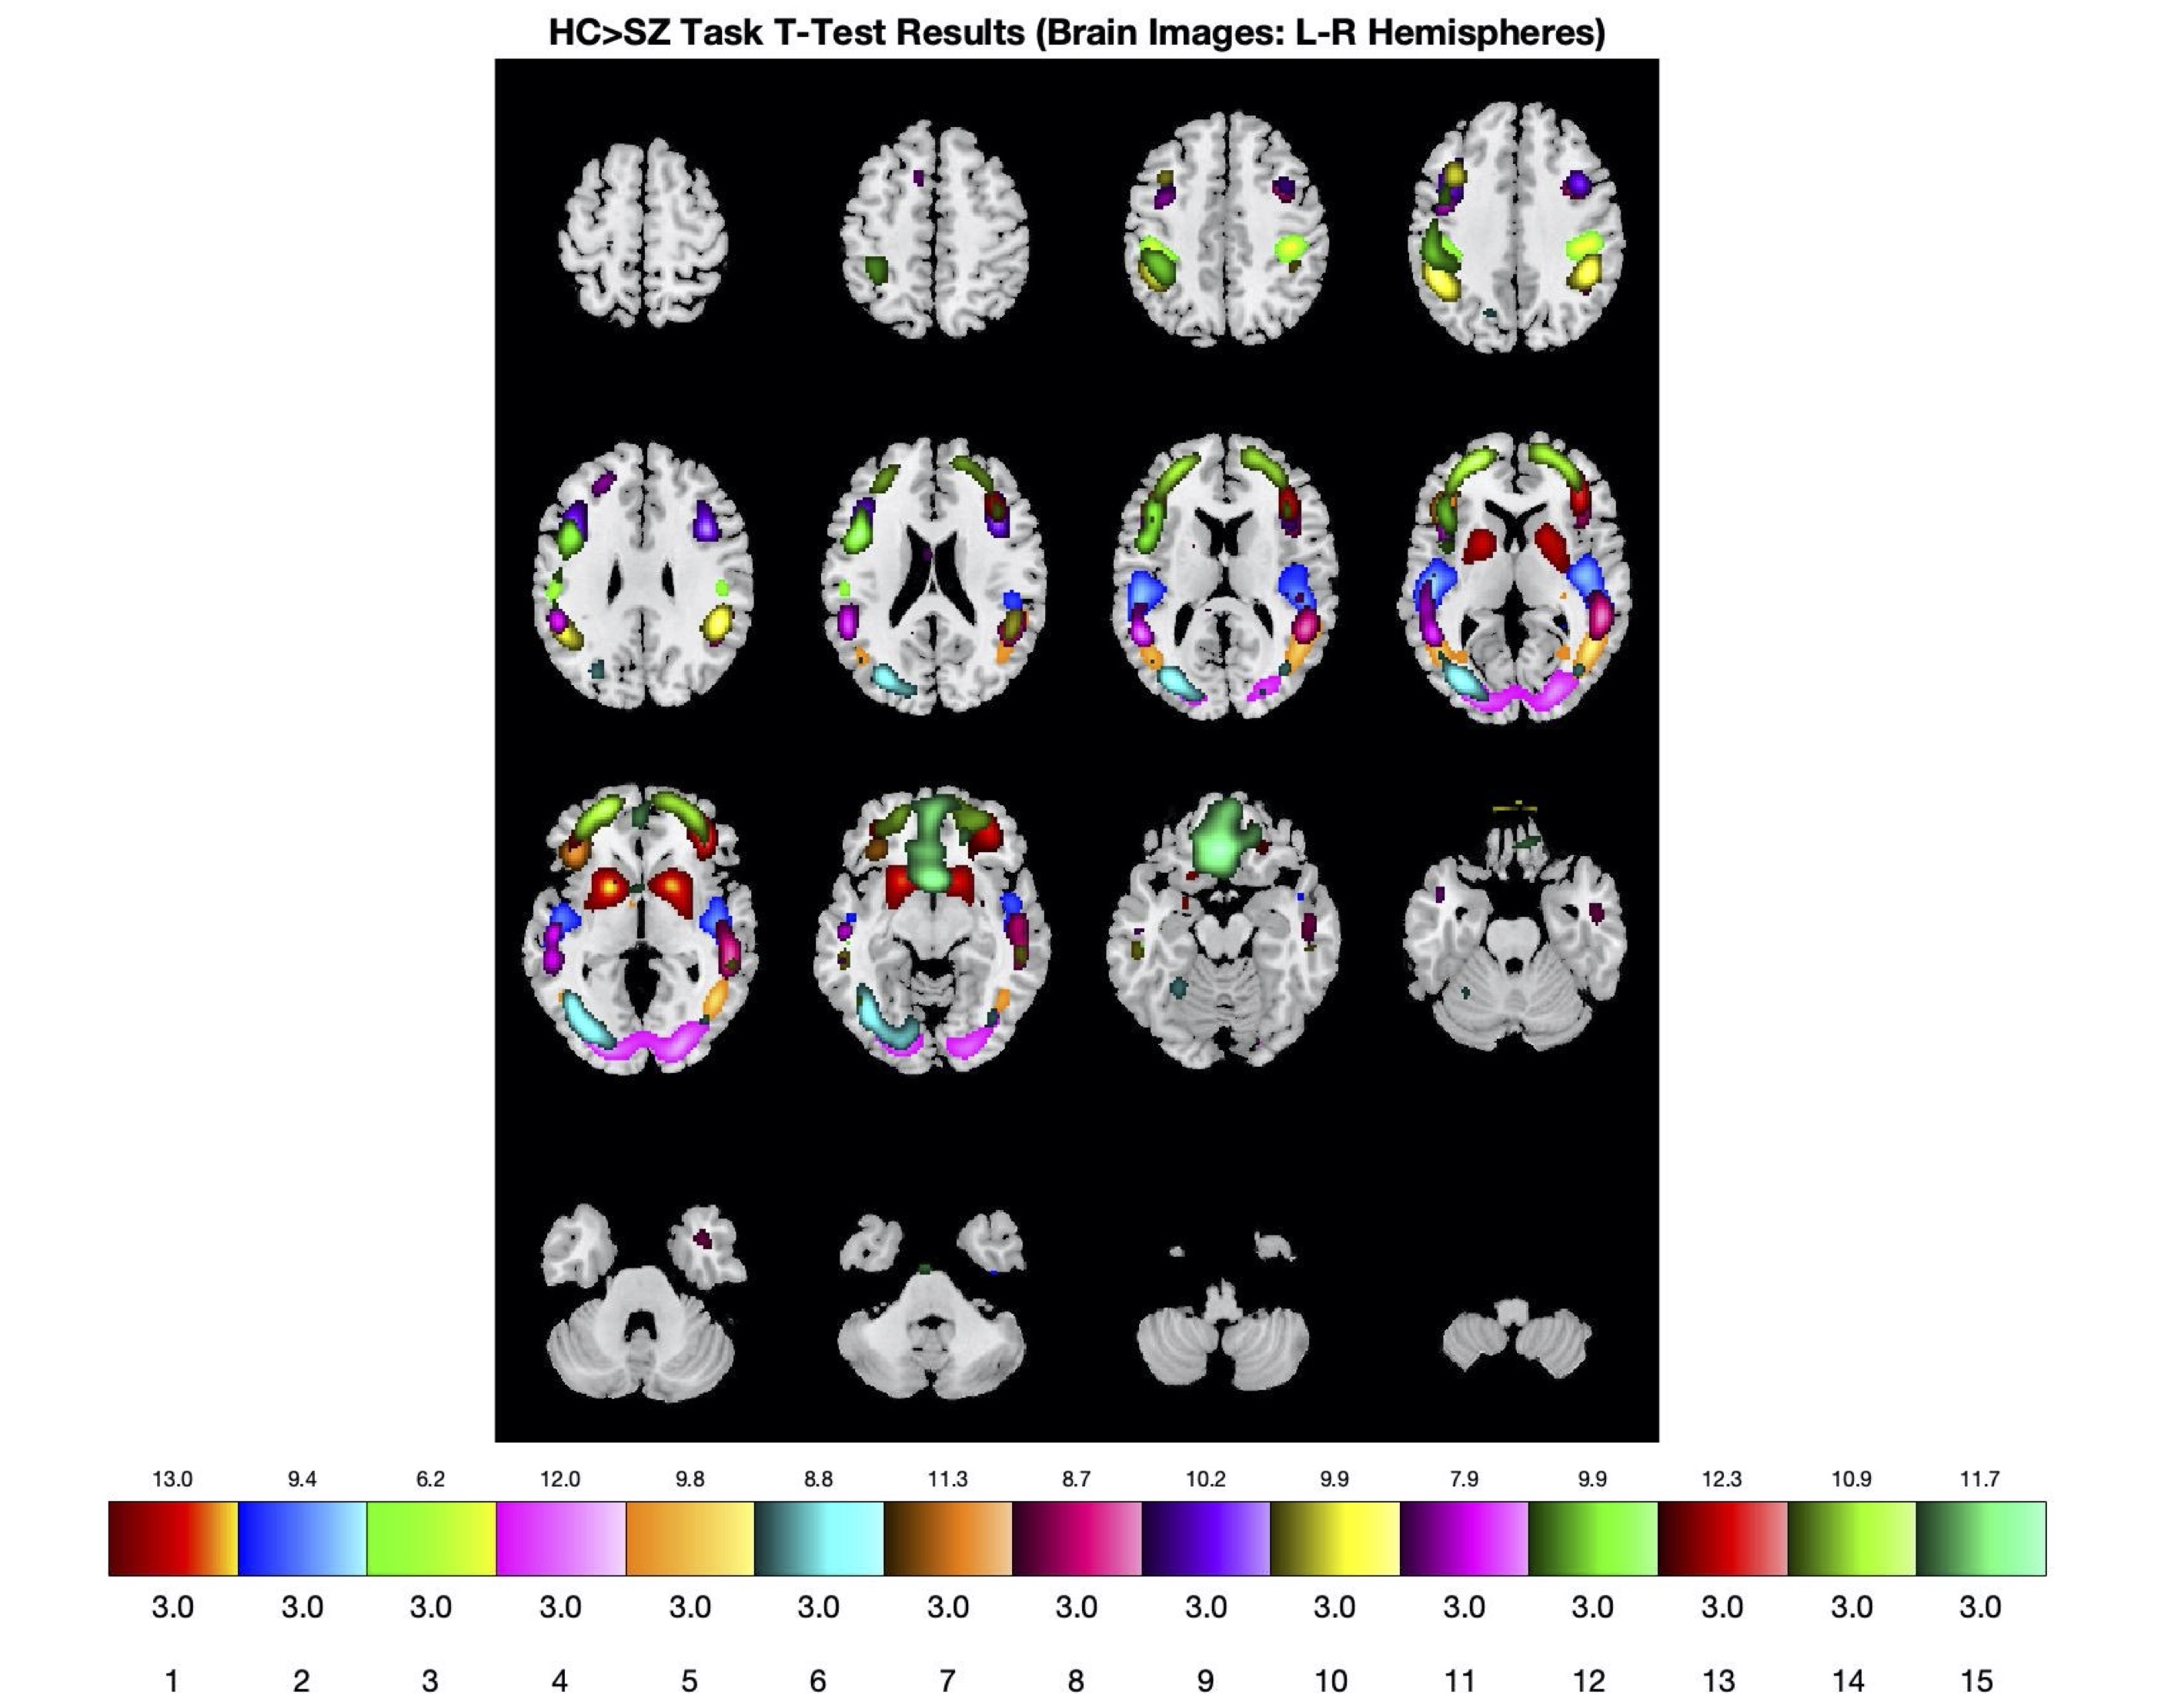
Preprocessed SPECT data were analyzed via spatially constrained ICA using the NeuroMark ICA template through the Group ICA of fMRI Toolbox (GIFT; http://trendscenter.org/software/gift; RRID:SCR_001953) run with MATLAB R2020b60 (Version 9.9.0.2037887). SPECT scans from 213 subjects total (healthy controls and patients combined) were analyzed via the MOO-ICAR algorithm using the NeuroMark fMRI 1.0 template (Table 3) which consisted of 53 ICs that replicated across two large-scale human fMRI datasets (see Du et al., 2020 for a full breakdown of how the template was created, as well as more explanation regarding the MOO-ICAR approach).60 This resulted in 53 SPECT ICs as well as subject specific loading parameters. The 53 SPECT ICs included 7 ICN domains including the subcortical (SC), auditory (AUD), visual (VIS), sensorimotor (SM), cognitive control (CC), default mode network (DM), and cerebellar (CB) component regions for healthy controls and patients (Figure 1).

Statistical Analysis
Following the analysis, loading parameter values for healthy controls, patients, and control – patient differences were tested to identify strong/weak patterns of connectivity in the SPECT data. Group differences were calculated by performing two-sample t-tests on each of the respective 53 control/patient pairs. In addition, pairwise correlations between the loading parameters for the SPECT components were analyzed for within and between group differences.
Finally, regression models were calculated to examine relationships between clinical variables and FNC values for patients. For the regression model of interest, demographic variables such as age and sex coupled with hallucination-related questions (e.g., Item 98: Hearing voices or sounds that are not real, Item 99: Experiencing Disjointed Thoughts or Speech) were examined specifically using the Amen General Symptom Checklist (GSC; https://ancronmedical.com/wp-content/uploads/2015/04/Amen-Adult-General-Symptom-Checklist.pdf), and correlated against average loading parameter values for patients. Regression models were calculated for examining these relationships between demographic and clinical variables regressed against the loading parameter matrices.
All tests were also corrected for multiple comparisons using the false discovery rate (FDR) approach,61 and t-test significant results were displayed in connectograms to visualize the NeuroMark ICs for all 53 ICs pairings that demonstrated group differences. Analysis was performed using MATLAB as well as R Studio with the base package of R (‘Pile of Leaves’), version 4.4.2 (2024-10-31).62 ChatGPT 4-o (version 4.5) was utilized to clean, create, and streamline MATLAB code.63
A main regression model was run to understand relationships between the demographic variables and clinical items correlated with the loading parameters. Model 1 had age, sex, the clinical variables measured from items 98 and 99 regressed against the loading parameters. Sex was coded as a categorical variable, with 1 = male, 2 = female.
Model 1:
\[\begin{aligned}
\text { Loading Parameters }=&\beta_0+\beta_1(\text { Age })+\beta_2(\text { Sex }) \\&+\beta_3(\text { Item 98 })+\beta_4(\text { Item 99 })\\&+\text { Error }\end{aligned}
\]
Additional confirmatory GLMs were run with age, sex, item 98, item 99, site, and medication status of patients on antipsychotics versus patients not on antipsychotics. Because of the small number of patients at certain sites and the fact that controls were scanned at only one site, we were unable to control for site and medication in the full analysis, however we performed targeted analyses to evaluate the impact of site and medication. For medication, given several patients were on multiple antipsychotic and non-antipsychotic medications, a subsample of 23 patients with no antipsychotic medication history were matched with 23 that were on antipsychotic medication. For site, we tested for site differences between sites 2 and 4, the only sites with more than 20 subjects.
Results
Part 1: Resting State SPECT Analyses
Loading Parameter Expression
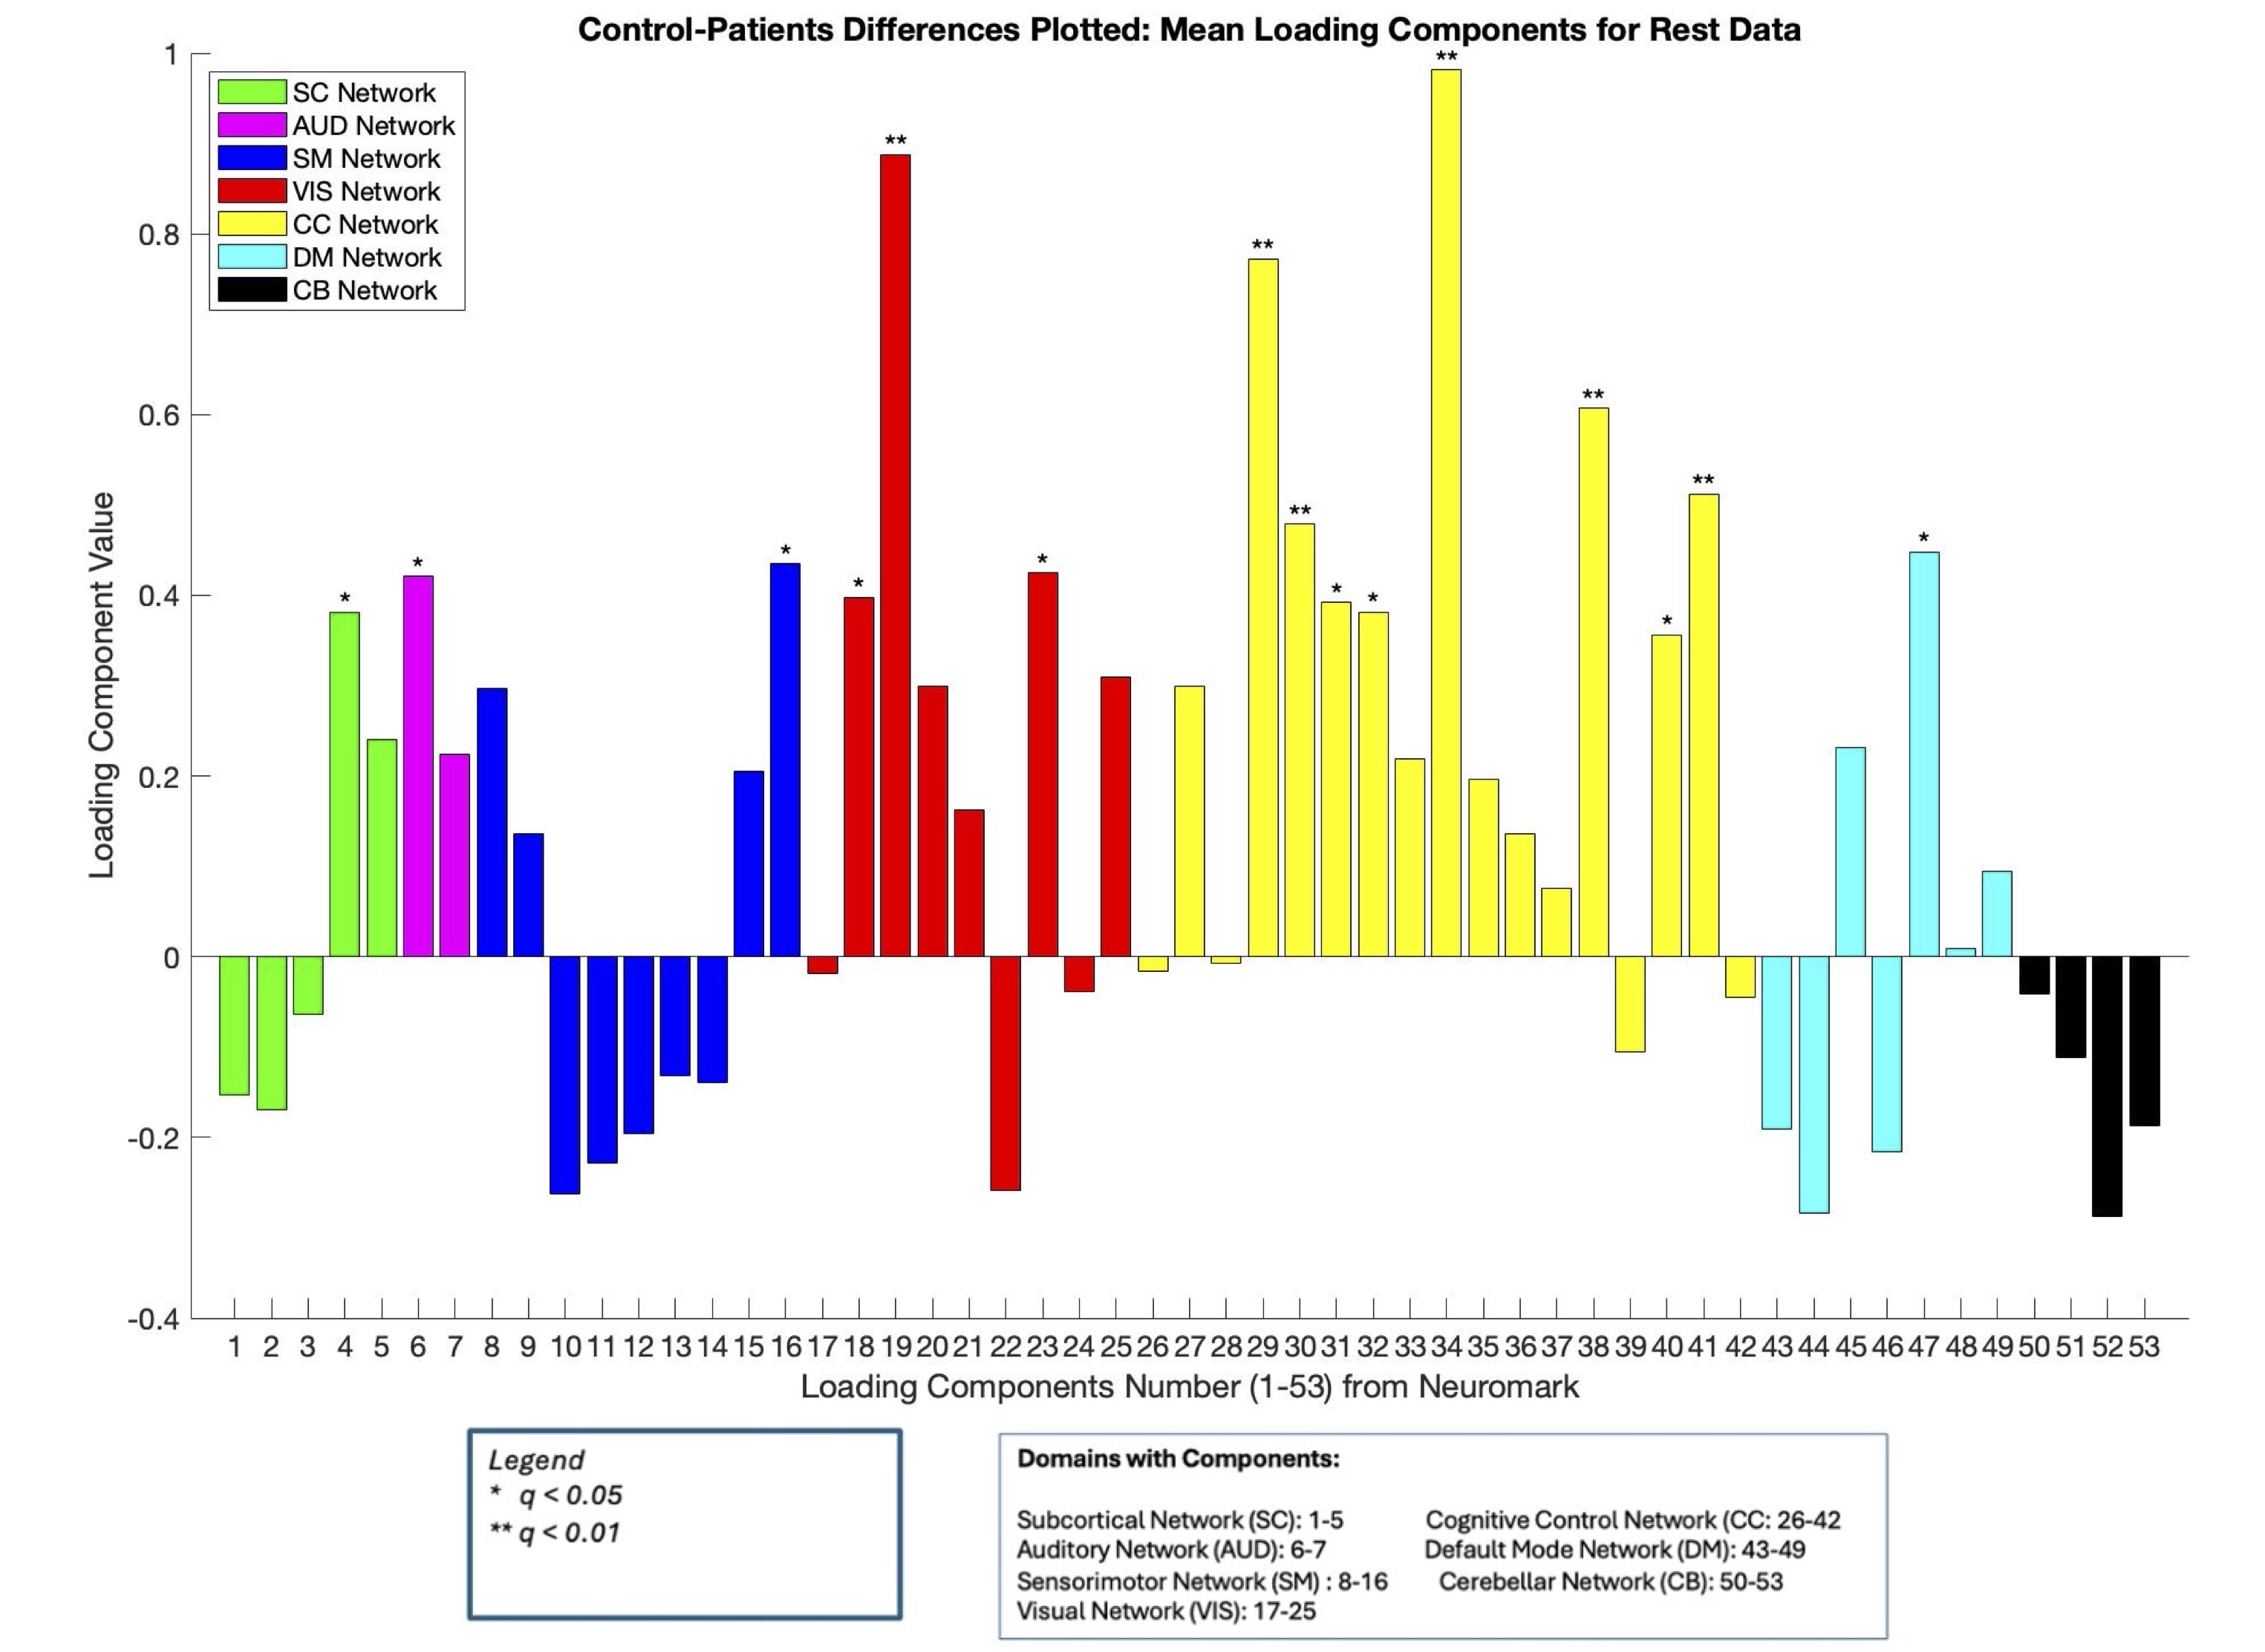
We first evaluated group differences in loading parameter expression between the 53 NeuroMark ICs. Loading parameter expression denoted how strongly an IC was expressed in each of the 53 components, with lower loading parameter values indicating less expression, and high loading parameter values indicating more expression. A high Cohen’s d value (d = 0.92) was calculated to compare effect sizes of mean loading parameter values between patients and healthy controls, suggesting strong group differences (see Supplementary Table 1 for more Cohen’s d exploratory analyses for pairwise group effects). After FDR correction, 15 components (HC > SZ) survived with domains from every network represented. Results from the group t-test comparing healthy controls > patients using mean loading parameter values revealed connectivity in the frontal and medial temporal regions (HC > SZ). No SZ > HC differences survived FDR correction. To visually represent the FDR corrected group differences, a spatial map demonstrating the 15 loading parameters for HC > SZ was displayed below (Figure 2) and as a bar plot demonstrating the distribution of the loading parameter values across group differences (Figure 3). Overall, loading parameter values showed intersubject functional covariance primarily in the frontal and medial regions of the brain. For clarity, the term functional covariance will be used throughout to describe areas of perfusion.

*_with_15_loadi.jpg)
FNC Results
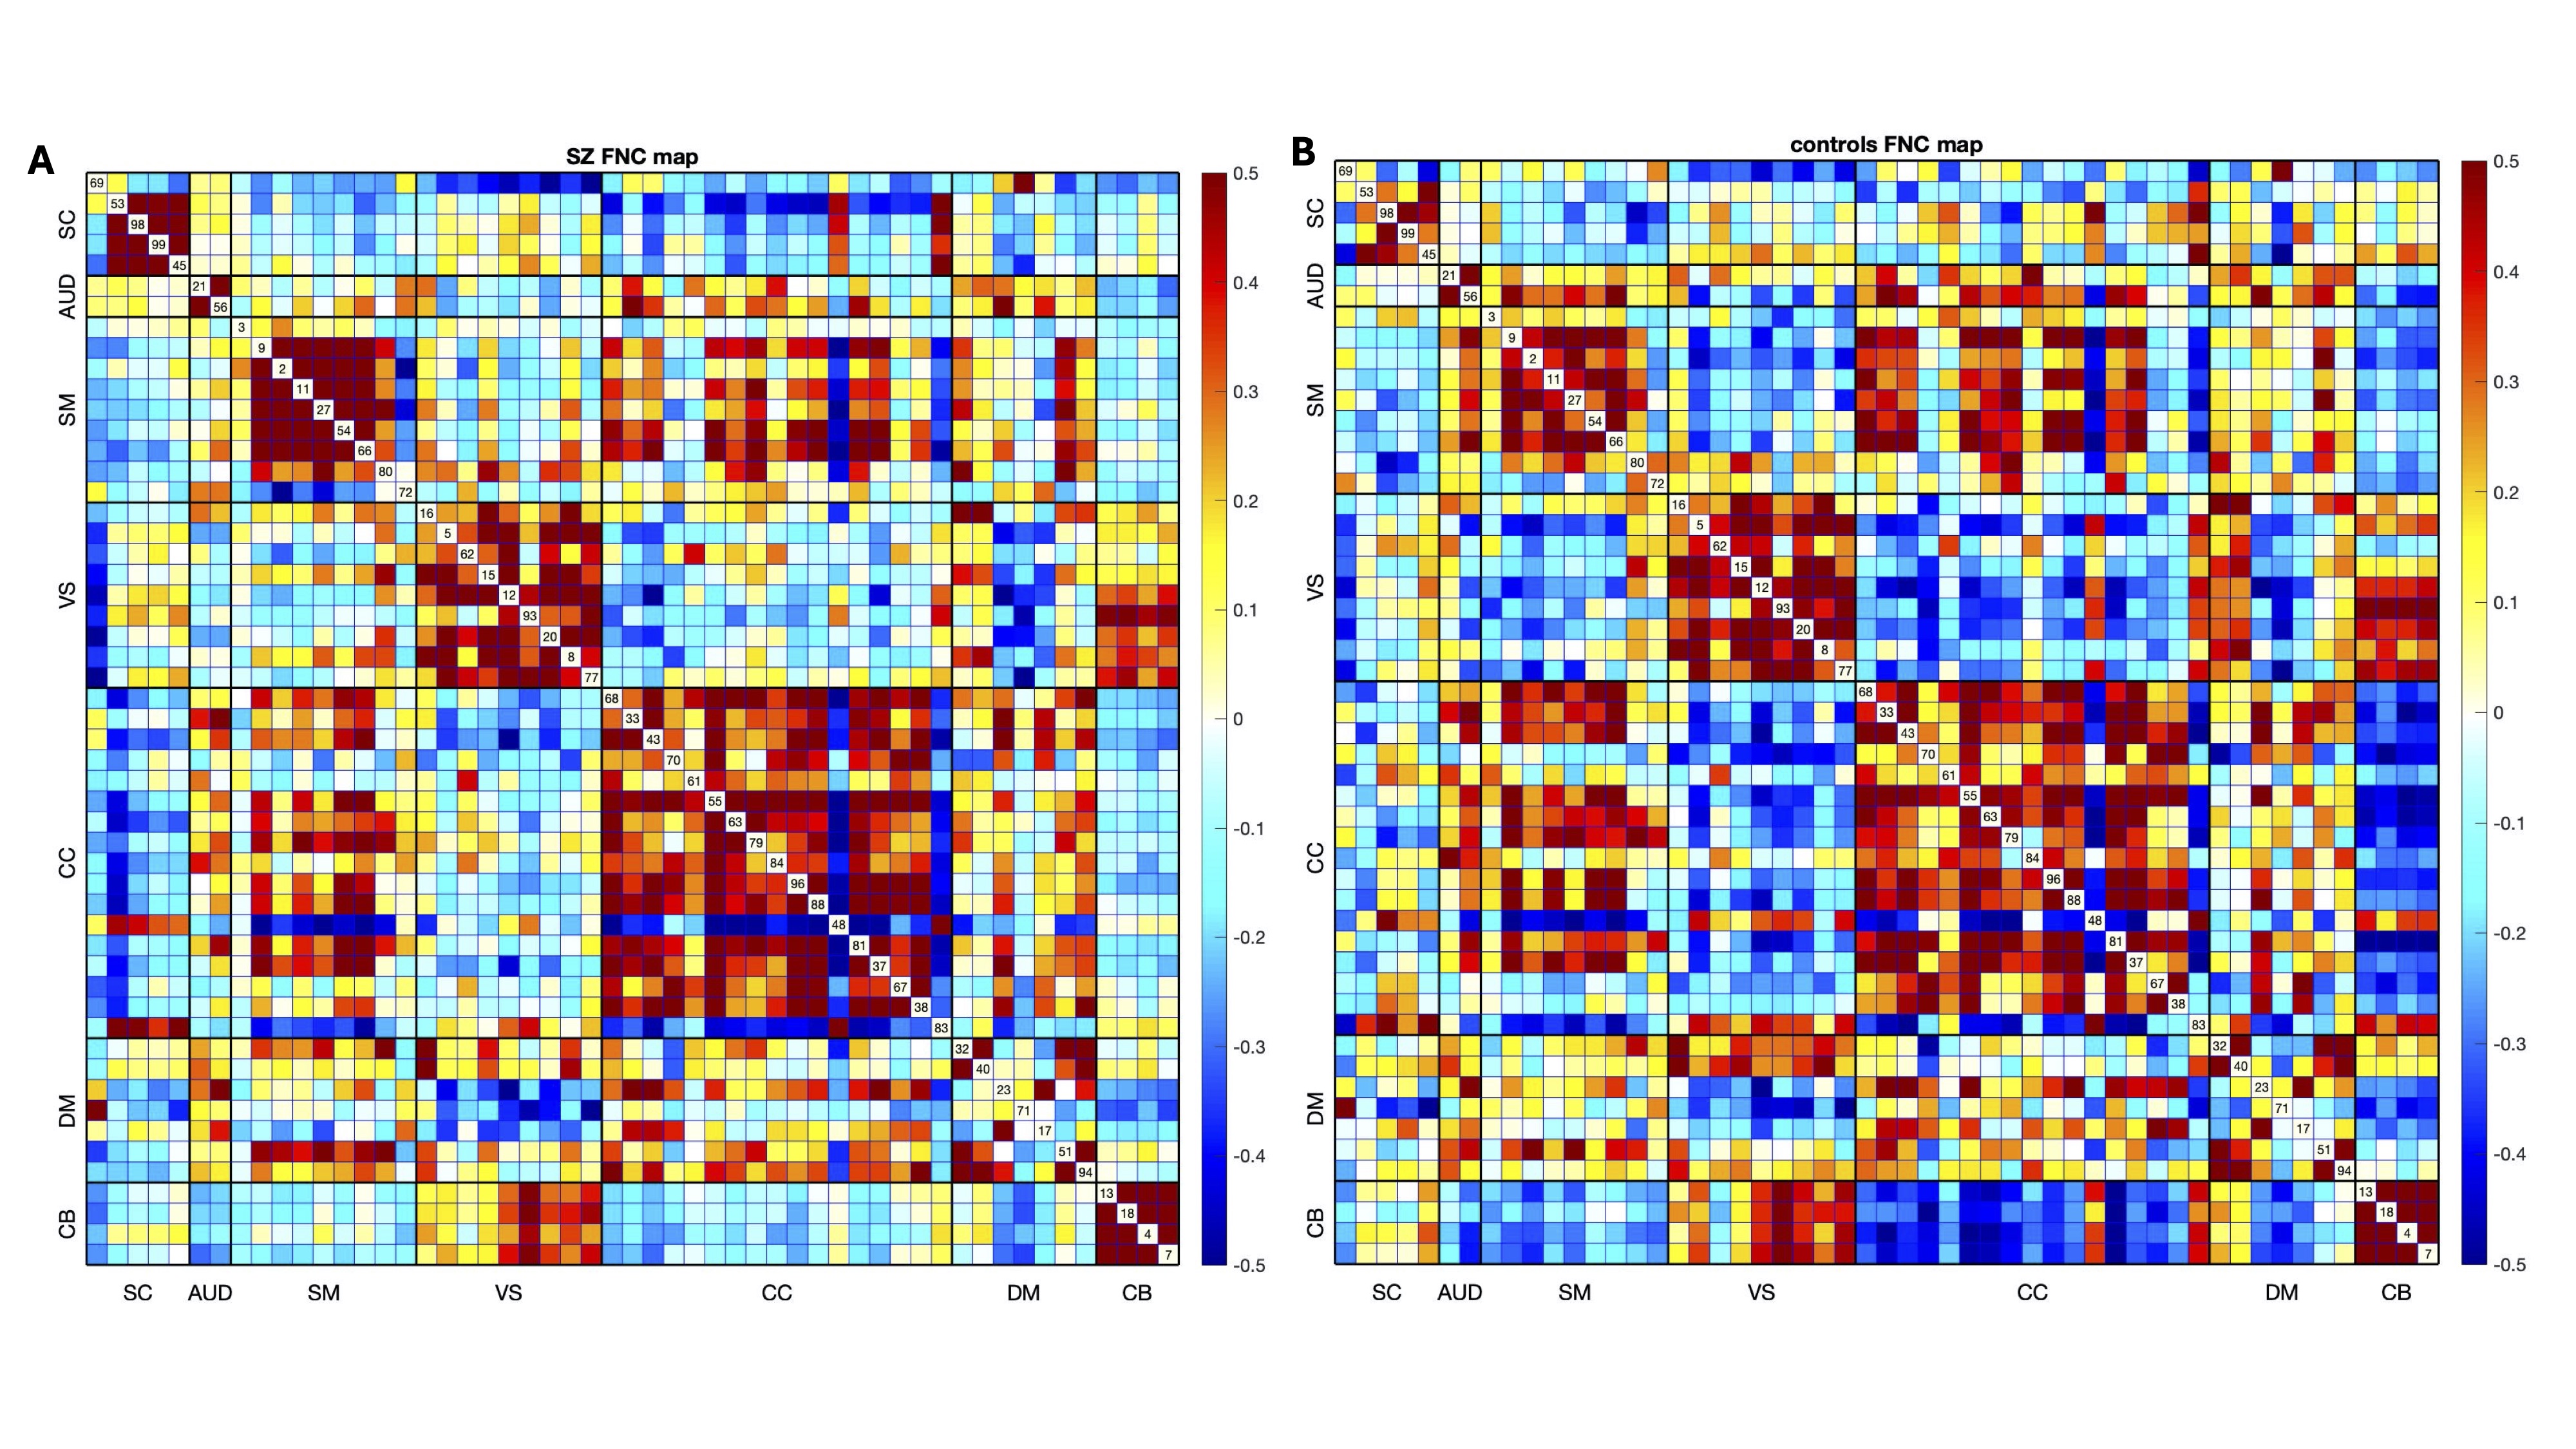
After analyzing IC differences between groups, the next goal was to analyze interactions among networks, denoted as FNC, and computed as the cross-correlation among component loading parameters. We looked at group differences between controls versus patients and patients versus controls. The 7 ICNs mentioned above were investigated for broad network covariation patterns having first identified IC differences between groups in the earlier results. Weak covariation was indicated by the lighter blue colors, and strong covariation between ICNs was indicated by the orange/red colors.
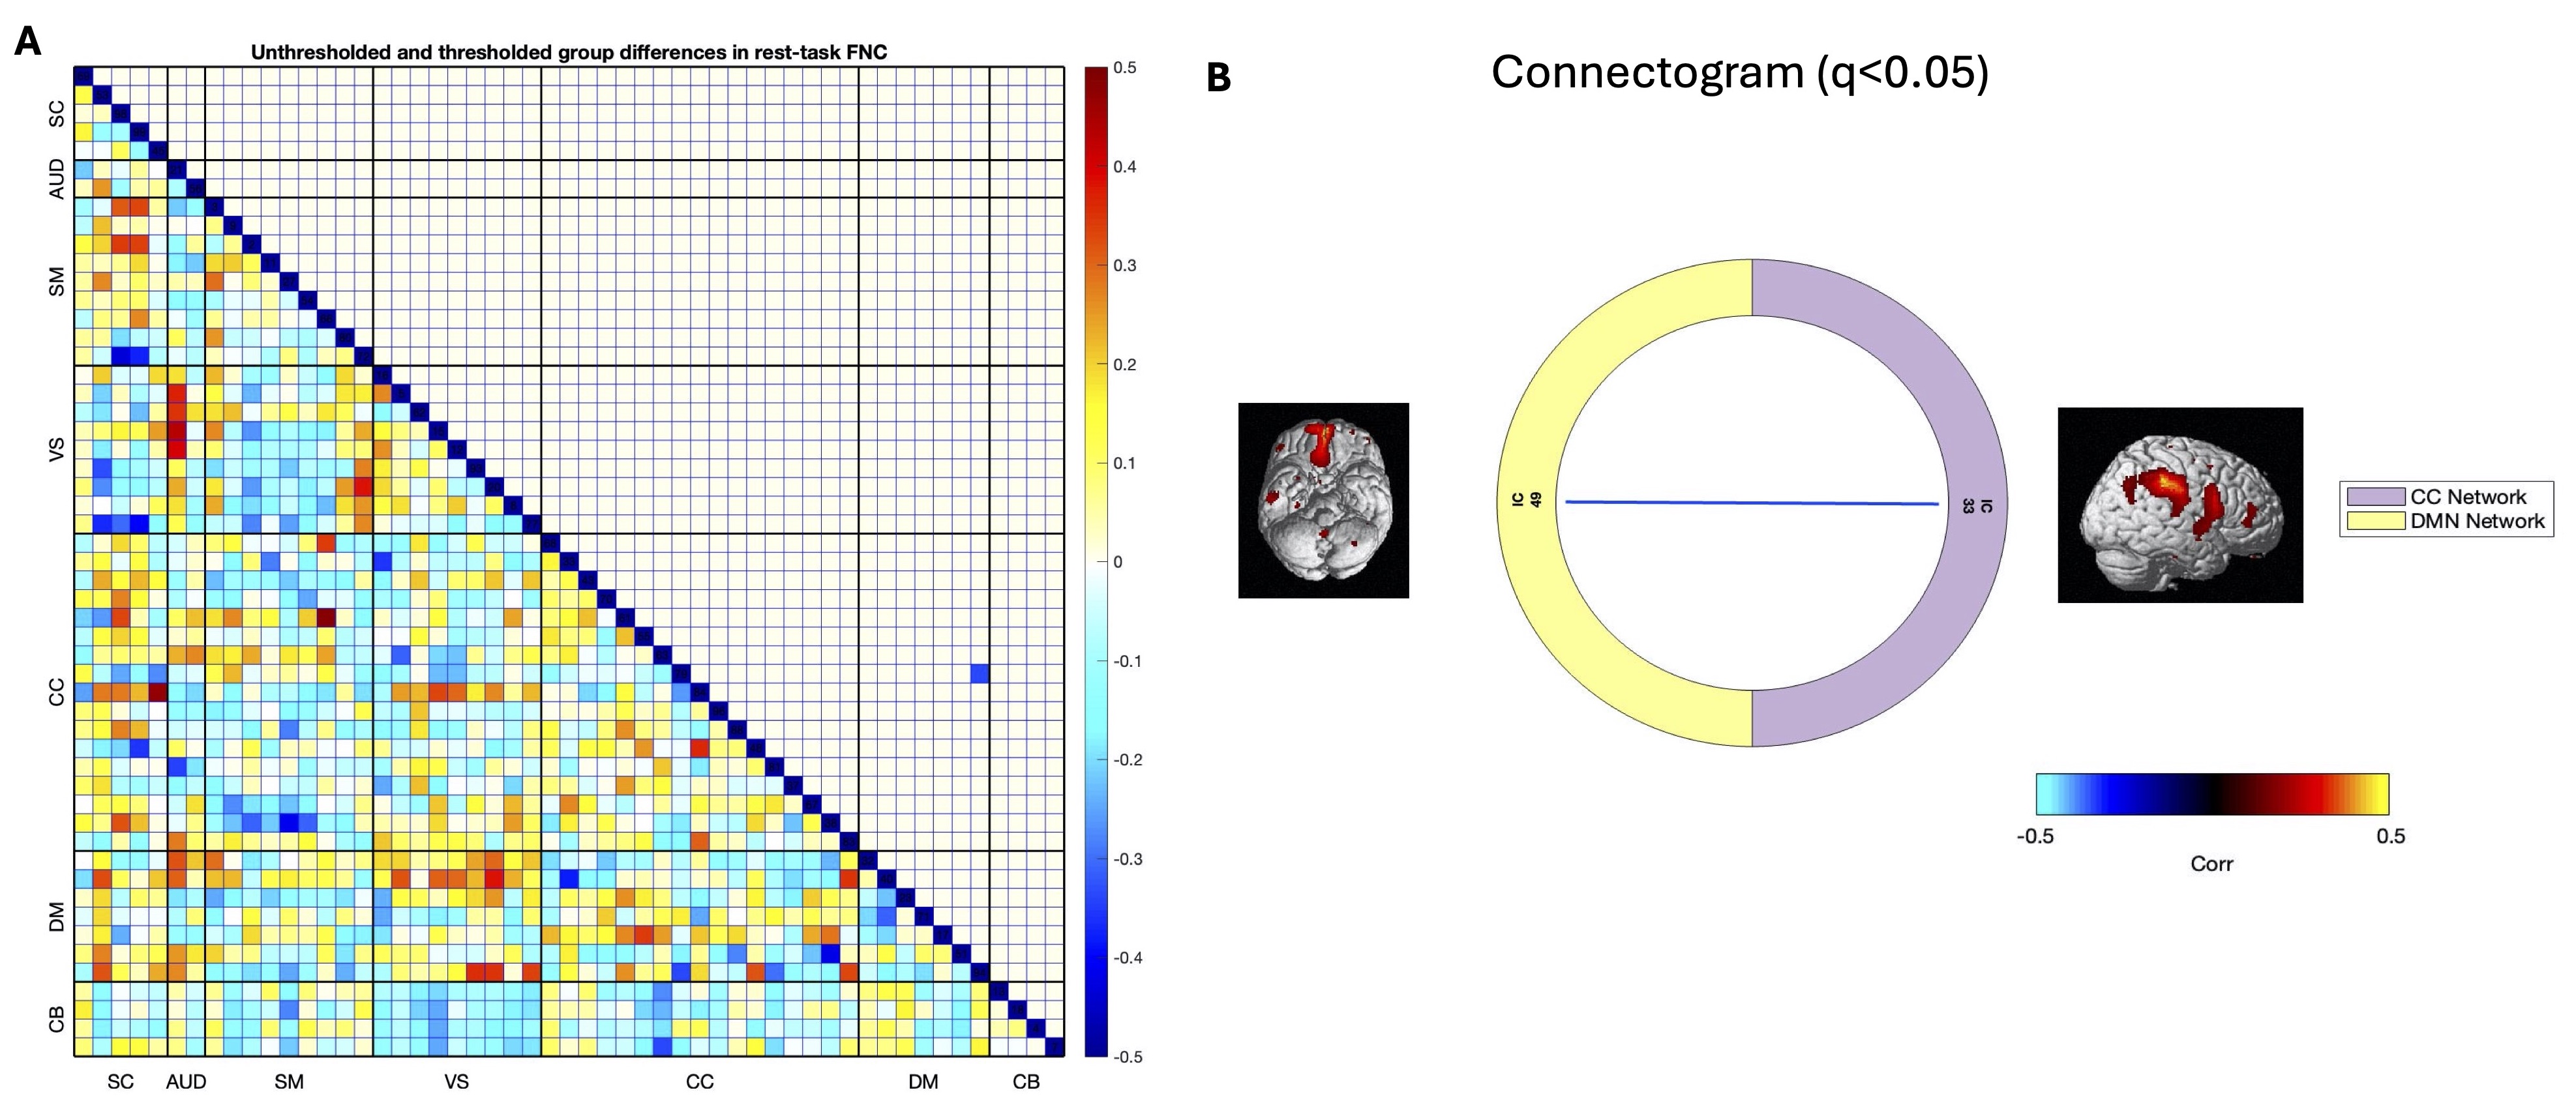
Regarding broad FNC patterns (see Figures 4a and 4b), we noted that for patients (Figure 4a), higher correlations were noted for CC-DM, VIS-CB, and SM-CC networks. Weak covariation was noted for CC-CB, DM-CB, and VIS-CC networks. Strong connectivity in controls (Figure 4b) was noted between the VIS-CB, VIS-DM, SM-CC, and CC-DM regions. Finally, for healthy control-patient differences, FNC was weaker between the CC-CB, SM-CB, and SM-VIS domains (Figure 5a-5b). Regions that survived FDR correction showed weaker covariation between CC-VS, DM-CC, and DM-SM areas, and stronger covariation between the DM-SM, CC-AUD, and DM-SC areas.
_and_controls_(figure_4b__right)_.jpg)
_with_unthr.jpg)
Clinical Regression Results
After identifying relevant components, relationships between loading parameters and clinical variables were examined. To do this, regressions of clinical and demographic variables against the loading parameters for patients were run. We first tested for collinearity between several clinical variables including GSC total scores (i.e., sum across all symptom severity scores in the GSC checklist), and other clinical variables related to positive and negative schizophrenia symptoms. GSC variables did not demonstrate high correlations with each other, with correlations less than 0.33.
A multiple regression was run to examine the relationship between loading parameters and clinical/demographic variables including age, sex, and hallucination symptoms (measured by Items 98 and 99 of the Amen General Symptom checklist). Overall, results (Table 4; clinical variables regressed against the loading parameter values) showed relevant components (i.e., Components 27 and 28; CC Network) were strongly related to hearing voices, as well as disjointed thoughts. The other components, marginally significant at FDR corrected q<0.1, showed a relationship between the AUD, SM, CC, and DM networks and hallucination symptoms. Regarding the analyses run to check for medication and site effects, there were no significant effects of either site, medication, or scanner type, suggesting these aspects are not of major relevance to the results.
Part 2: Task-Based Analyses
Loading Parameter Results
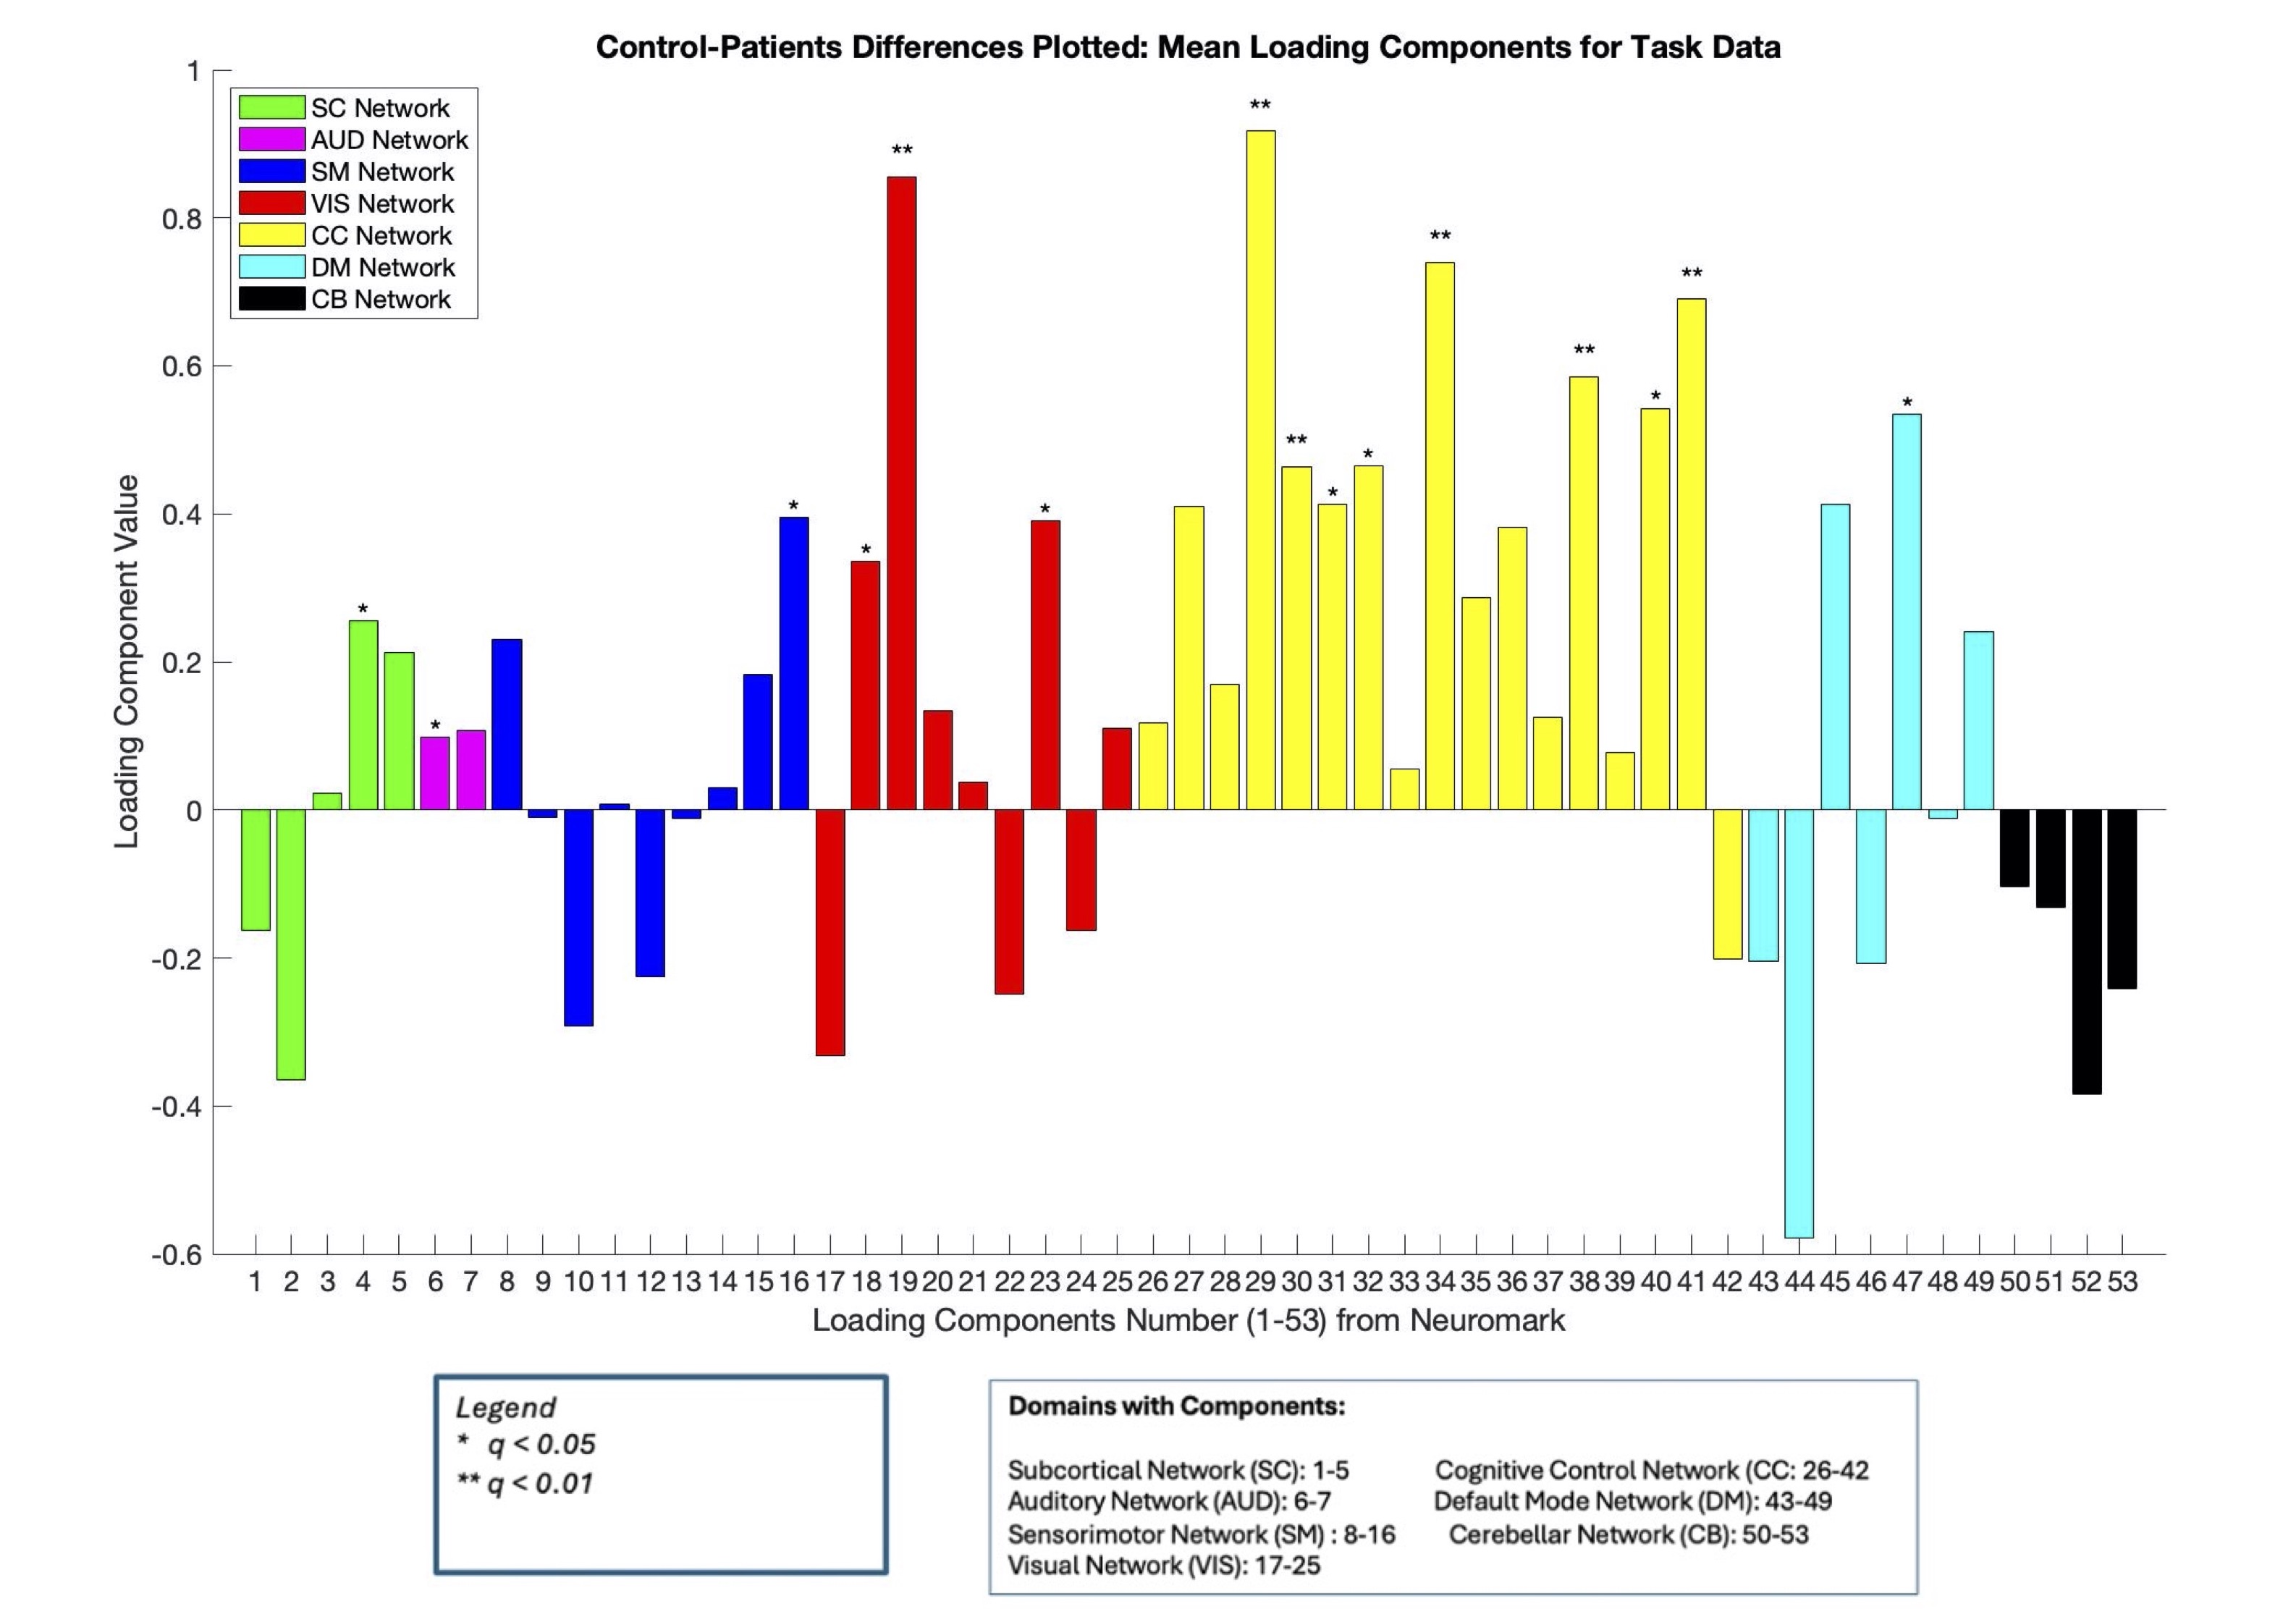
In addition to the resting state SPECT data, we compared task-based results with the CPT and the loading parameters, as well as FNC comparisons between healthy controls and patients. Bar plots were calculated to compare mean loading parameter values for healthy controls, patients, and the healthy control-patient differences, with the FDR corrected results displayed. The same 15 loading parameter components for resting state were significant for the task-based results. Furthermore, patients who did the CPT task showed more negative loading parameter values (i.e., reduced expression) across ICNs compared to healthy controls, who had positive loading parameter values across ICNs (i.e., increased expression; Figure 6). A spatial map displaying the relevant components (Figure 7) with group differences are shown below.


To summarize overall patterns, group differences in resting state data found 15 networks that were significant and replicated across the same components in the task data. Together, rest and task data show similar group effects with 7 common networks in the following regions: Component 4: Caudate, Component 6: Superior Temporal Gyrus; Component 16: Postcentral Gyrus; Component 18: Middle Occipital Gyrus, Component 19: Middle Temporal Gyrus, Component 23: Inferior Occipital Gyrus, Component 29: Inferior Frontal Gyrus, Component 30: Right Inferior Frontal Gyrus; Component 31: Middle Frontal Gyrus; Component 32: Inferior Parietal Lobule; Component 34: Supplementary Motor Area; Component 38: Left Inferior Parietal Lobule; Component 40: Inferior Frontal Gyrus; Component 41: Middle Frontal Gyrus, and Component 47: Anterior Cingulate Cortex.
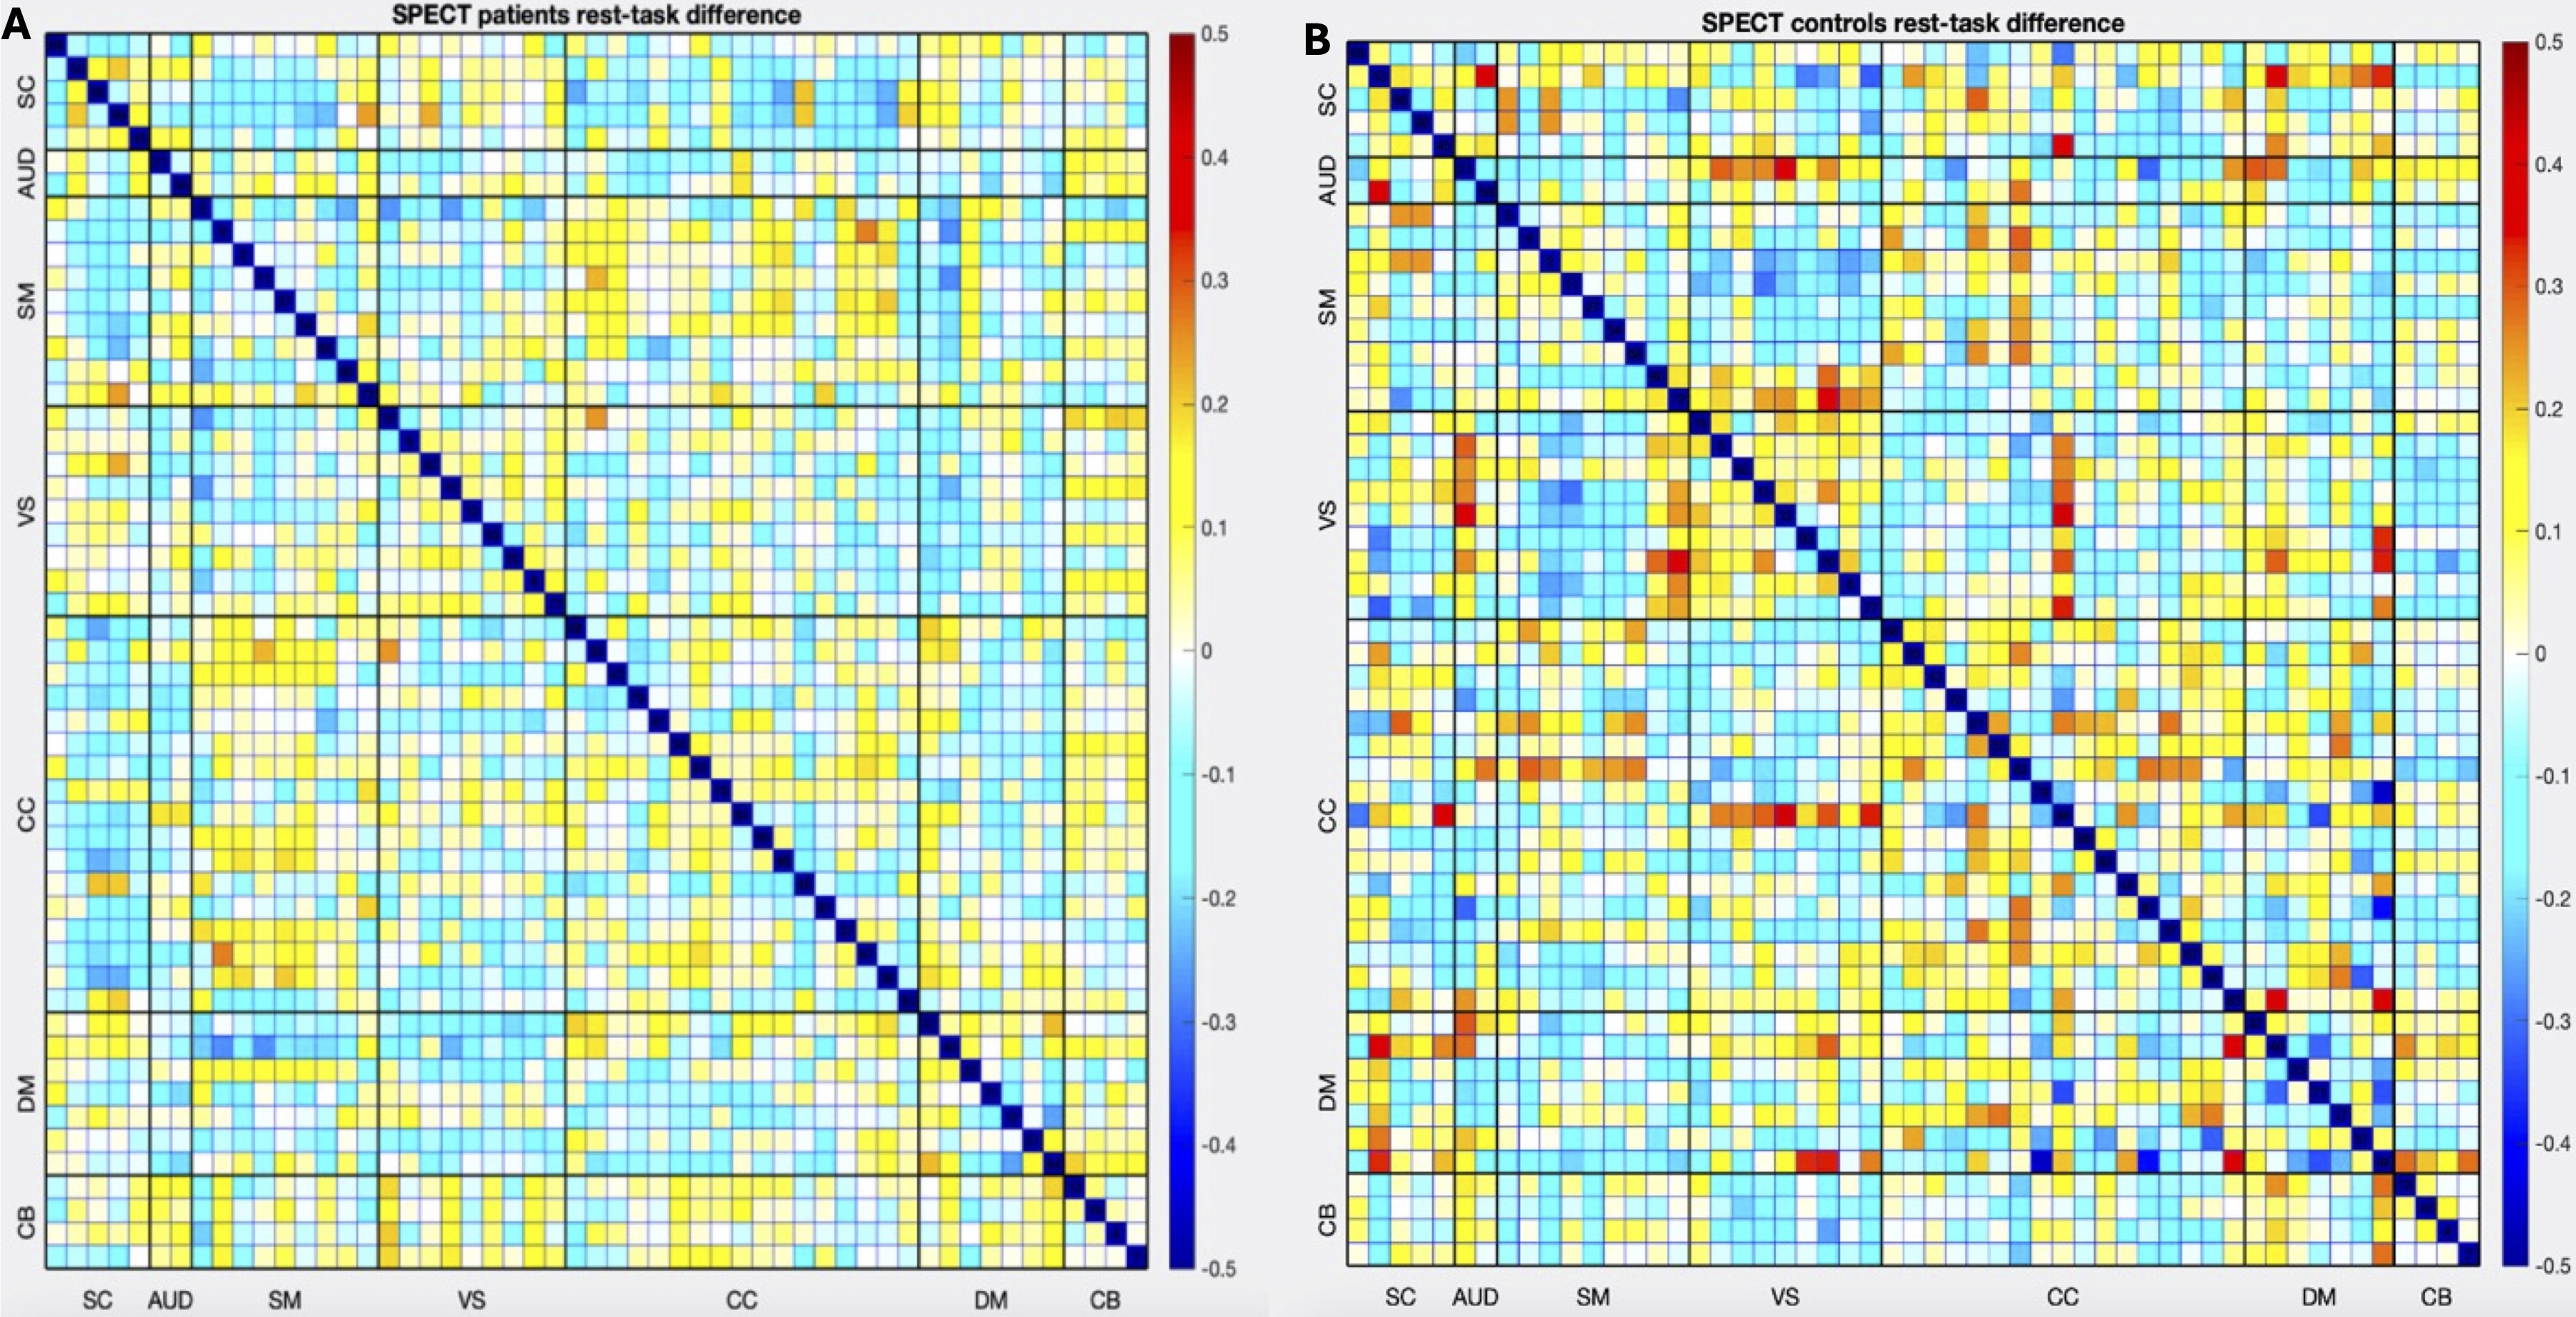
FNC Task vs Rest Differences
Finally, FNC results were plotted for controls and patients to see differences between groups for rest-task FNC differences (Figures 8a and b, 9a and b). Patients overall showed decreased FNC as demonstrated by reduced loading parameter expression across ICNs including the CC-DM, VIS-DM, SC-CB and AUD-CB for example. By contrast, controls showed increased FNC across the 7 ICNs, namely in the VS-CB, DM-CB, and VS-CC regions. Overall, resting state data and task data complement each other and confirm perfusion activity broadly across the 7 ICNs in the NeuroMark networks, and demonstrate differences in ICN loading parameter expression between patients and controls. When comparing rest-task data, one association survived FDR correction, namely the CC-DM association. This suggests that despite performing an attention-based task, the CC and DM areas continue to be active and engaged in both patients and healthy controls. Task-based data additionally show that patients had generally reduced perfusion covariation across networks compared to healthy controls. More importantly, patients showed reduced covariation in AUD-DM, AUD-CC, VS-DM, and SC-CC networks. This suggests that as patients completed the CPT, engagement of the auditory, attention, visual, and cognitive control networks was quite reduced compared to healthy controls.
_and_healthy_controls_(right)__specifically_s.jpg)

Discussion and Conclusions
Here, we present the first study to utilize a NeuroMark sc-ICA approach to perform an fMRI-guided analysis of SPECT data. These results show the benefits of using a fully automated yet flexible approach to estimate brain networks and their covariation. The significant group differences in loading parameters between healthy controls and patients are consistent with and extend prior reports,15,21,64 which indicate that variability in loading parameters is possibly linked to alterations in functional connectivity and structural disruptions. Indeed, our study noted FNC alterations across a variety of networks, including all seven of the NeuroMark domains, but particularly in the AUD, SM, and CC domains related to clinical variables measuring age, sex, and hallucination symptoms (e.g., hearing voices). Phenomena such as “disrupted cross talk” in patients with auditory hallucinations have been well documented22 as disruptions in connectivity pertaining to hippocampal and auditory regions. These miscommunications could also be due to chemical imbalances, namely glutamate and GABA connectivity gone awry.20 Interhemispheric miscommunication has been a theory in schizophrenia, and another possibility for the onset of auditory verbal hallucinations in patients. Indeed, interhemispheric miscommunication has been attributed to several causes, including possibilities of increased levels of glutamate in prefrontal and auditory regions, as well as N-methyl-D-aspartate (NMDAR) receptor dysfunctions.65
Studies have also shown evidence of disrupted interhemispheric connectivity, particularly in auditory- and memory-related networks, specifically decreased interhemispheric connectivity measured through voxel-mirrored homotopic connectivity (VMHC) in the STG, insula, Rolandic operculum, fusiform gyrus, and parahippocampus.23 Taken together, these neurotransmitter dysfunctions, coupled with widespread disruptions in connectivity across multiple brain regions, may explain our findings of altered network connectivity across several large-scale networks. Disruptions in large-scale functional networks have been widely observed with DM hypoconnectivity and relationships with DM functional connectivity and clinical symptoms a common feature .66 We noted disruptions specifically in areas such as the parietal lobule, hippocampus, and frontal gyri which tie well with previous studies noting similar abnormalities in patients, and linking disruptions in the sensorimotor and auditory cortices .40,62,63,67
Other things to consider include the limitations of using HMPAO SPECT in general. It is well known that SPECT imaging has poor spatial resolution compared to other techniques, along with costly/inefficient approvals and prior authorizations for its use in medical imaging.68 Due to poor spatial resolution of SPECT imaging, other methods such as fMRI and PET are preferred in translational clinical work,69,70 and provide much higher spatial and temporal resolution. However, it can be argued that SPECT imaging boasts high clinical accuracy10,70,71 with machine learning techniques assisting with improvements in accuracy.72 Thus, the use of SPECT in clinical settings should not be completely eliminated; rather, it could be used as a complimentary tool to fMRI, PET or other measures used in neuroimaging studies.
We also noted some similarities between our results and prior fMRI work. Previous fMRI studies have found increased functional covariance in regions such as the anterior cingulate cortex and left inferior parietal lobe in PET studies.73 Previous studies have also noted differences in connectivity between affective versus non-affective early phase psychosis using the NeuroMark template,53 with another PET study utilizing the NeuroMark template to provide fMRI-guided analysis of Pittsburgh Compound-B (PiB) PET data, revealing distinct patterns of covariation in mild cognitive impairment versus control subjects.73 In studies looking at patients with FEP and early psychosis using NeuroMark, differences in FNC were found in several regions, including the inferior frontal gyrus and superior medial frontal gyrus, indicating disruptions in the cortical-subcortical-cerebellar circuits.52 Previous ICA studies investigating disruptions in the DM, specifically abnormal dynamic functional connectivity in the precuneus and posterior cingulate cortex seem to suggest possible similarities between SPECT and fMRI methods capturing similar disruptions in connectivity.54 Together, these results support multiple networks of dysconnectivity, particularly in the cortical, cerebellar, and default mode network regions that require further exploration.
Finally, we note relationships between the CC-DM pair remain significant in a sustained attention task for healthy-patients, as well as reduced FNC patterns across the AUD, CC, and DM networks in patients compared to healthy controls. This is suggestive of patients experiencing challenges with attention and focus due to the possible presence of auditory hallucinations interfering with sustained attention efforts. Previous fMRI studies using ICA have also noted relationships between hallucination symptoms and networks in the fronto-temporal-parietal regions,21 which broadly point to widespread disruptions of functional networks. Studies also discussed regions such as the insula, ventral striatum, hippocampus, and superior/middle temporal gyri being implicated in processes related to source monitoring and aberrant salience in schizophrenia.67 These processes are related to aberrant cognitive perceptions that patients have about themselves and the world. The findings from our study related to decreased FNC in many of these related regions suggest that patients experience challenges with attention and general cognitive processing that need to be further explored. Given that controls had stronger FNC with the same networks, it could be that they were able to focus more extensively on the task without the interference of hallucinations affecting these cognitive states. However, since it is unclear how frequently hallucinations occurred or whether they were present in patients during the attention task, further research is needed to fully understand these patterns.
Some limitations of this study included not having other SPECT covariation studies in schizophrenia to which to compare results. While a novel study such as this one is promising, more translational and clinical research in schizophrenia using SPECT imaging is needed to extend these findings to other datasets or populations including, but not limited to, comorbid populations. Future directions should utilize large-scale datasets and perform comparative ICA processes similar to this study to see if results replicate.
Another limitation was the challenge of controlling for differences across sites and scanner types, as participants were scanned using both types of scanners at various locations. Additional challenges included accounting for varying subject totals across sites and for the use of antipsychotic medications across sites. Table 1 clearly shows the breakdown of subjects across sites, particularly their limited samples. Because controls were all collected at one site, and small numbers of patients were collected at the other clinic sites, we observed that it was a challenge to control for site as a covariate. However, we tested for group differences between patients collected at the two largest sites and found no differences, which suggests that site is not a major factor in driving the results. The other challenge was controlling for medication status. Some patients had multiple medication statuses (e.g., being on antipsychotics and non-antipsychotics) which left a small sample size to further analyze this covariate. To account for this, we compared patients on multiple medications versus those that were not on any medications. Despite adjusting for this, no results survived. Therefore, a larger sample size of medicated patients solely on antipsychotics is needed to further analyze the effects of antipsychotics on perfusion data.
The potential of ICA as a biomarker, especially in the context of SPECT data, warrants discussion. Numerous fMRI studies utilizing ICA in schizophrenia have noted the robustness of ICA identifying brain networks, despite the type of ICA used. For example, coefficient constrained ICA,35 group information-guided ICA (GIG-ICA74), and spatially constrained ICA50 all demonstrate ways in which ICA can be used as a potential biomarker despite the type of algorithm used. In the case of translating ICA usage to SPECT data, this study aims to be the first of hopefully many to utilize fMRI spatial priors to relate aberrant patterns of blood flow to hyper/hypoconnectivity patterns in schizophrenia. We note that the SPECT resolution is around 6.5 mm, with the NeuroMark spatial resolution for each voxel being 3 x 3 x 3 mm3. Given these dimensions, the spatial resolution should not be too affected. Since fMRI is a measure of resting cerebral blood flow (rCBF) from which large-scale human brain networks have been mapped,30,60,62,75 this could explain comparable network patterns across prior fMRI studies and this current one. This study was able to find patterns similar to those in prior fMRI studies, including aberrant patterns in cerebello-thalamocortical (CTC) areas64 and the default mode network,54 which could in the future be mapped or overlayed onto fMRI regions. Given that we did not have concurrent fMRI data to which to compare the SPECT data, this would be a promising avenue of research for future studies, and to examine sources of potential bias when working cross-modally between fMRI and SPECT. Additionally, although we do not have specific genetic, blood, or brain markers that pinpoint to causes of schizophrenia, we hope that more translational studies will compare SPECT and fMRI datasets in tandem for further insights that will help with quicker diagnosis and treatment.
In conclusion, analyzing SPECT data using ICA revealed multiple significant group differences in healthy controls versus schizophrenia patients. This poses interesting clinical questions related to possible disruptions in schizophrenia, particularly in the superior temporal gyrus, default mode network, and subcortical networks. Given that this is the first fMRI-guided network-based analysis of SPECT data, these results shed further light on patterns of functional dysconnectivity identified in various studies relating disruption in these networks correlated with positive and negative symptoms in schizophrenia. Thus, findings from this study can be taken as a first step to conduct future SPECT and other modality-related studies to compare FNC in schizophrenia. Taken together with clinical data, we hope to further analyze the SPECT data to see how group differences emerge across a variety of neuropsychiatric disorders. In conclusion, utilizing SPECT imaging could be a useful complement to existing fMRI research in finding novel biomarkers of schizophrenia.
Data and Code Availability Statement
Due to the sensitive nature of this clinical data, the SPECT data has not been posted publicly but the anonymized demographic and other clinical data used in this study is freely available for research by request to Dr. Keator. The code in MATLAB and R, and other associated files are available on Github: (https://github.com/trendscenter/gift-bids/tree/main/misc/spect/proj/march2024).
Funding Sources
This work was funded by the National Institute of Mental Health grant R01MH123610, awarded to Vince Calhoun.
Conflict of Interest Disclosures
The imaging data was collected by the Amen Clinics as part of their routine patient intake for clinical treatment. Upon consent (Integ Review Board (004-Amen Clinics Inc.)), patients provide their de-identified data for research use, made available by the non-profit Change Your Brain Foundation to academic and research institutions.
TReNDS used the retrospective imaging data from Change Your Brain Foundation to study functional connectivity in schizophrenia across imaging modalities.
Dr. Keator is currently a research scientist at the Amen Clinic and receives a salary from the clinic to perform neuroimaging research. Dr. Amen is the founder and CEO of Amen Clinics, receives salary, and owns private stock of the company.
Amritha Harikumar will be funded full-time as a graduate research assistant by the Amen Clinic beginning July 2025.