
Introduction
Background
Noise exposure is the main cause of preventable hearing loss worldwide,1 and can be incurred occupationally (e.g. when working with noisy machinery) and/or recreationally (e.g. by attending nightclubs and live music events). Hearing loss reduces quality of life,2 can lead to social isolation and depression, and is a potentially modifiable risk factor for dementia.3,4 Noise-induced hearing damage is likely predictive of more severe hearing loss in old age,5–8 but may also lead to measurable auditory deficits in mid-life.
Until recently, it was assumed that damage caused by noise exposure affects mainly the sensory hair cells in the cochlea. However, findings from animal studies suggest that even moderate noise exposure can cause substantial damage to the synapses between inner hair cells and cochlear nerve fibres (cochlear synaptopathy), which can occur without any noticeable damage to hair cells.5,6,9–12 Crucially, such damage need not affect sensitivity to quiet sounds but may lead to tinnitus and hearing difficulties and may exacerbate the effects of ageing on the auditory system.7,13
Hearing loss is usually diagnosed using pure-tone audiometry (PTA), which measures the sensitivity of the ear to quiet sounds by determining the levels of tones that can just be heard at several frequencies. However, alternative measures can be used to study noise damage. Extended high-frequency (EHF) audiometry (testing frequencies above 8 kHz) assesses the function of the basal hair cells and is suggested as a sensitive measure of early noise damage.14 Distortion product otoacoustic emissions (DPOAEs) originate from the outer hair cells in the cochlea and provide one of the most direct measures of cochlear function.15 The auditory brainstem response (ABR) provides an electrophysiological measure of the latency and amplitude of the neuronal responses to auditory stimuli in the cochlear nerve and auditory brainstem and may be sensitive to noise-induced cochlear synaptopathy.16 The middle ear muscle reflex (MEMR) is an alternative measure of synaptopathy, assessing the integrity of the afferent auditory pathway through an involuntary contraction of the stapedius muscle that can be measured through alterations in the acoustic impedance of the tympanic membrane.17 Behavioural tasks such as the Digits-in-Noise (DiN) test (a measure of speech perception in noise) are used to provide measures related to real-world listening ability, and therefore functional impairments due to noise exposure.18
Neuroimaging studies also have potential to improve our understanding of the neurobiological processes underlying auditory damage. The cochlear nerve has previously been imaged using structural magnetic resonance imaging (MRI) to assess hypoplasia and neuropathy,19–23 for example patients with auditory neuropathy have been reported to have reduced cochlear nerve diameter compared to normally hearing individuals (long diameter: 0.65 ± 0.20 mm vs. 1.4 ± 0.21; short diameter: 0.44 ± 0.15 mm vs. 1.0 ± 0.15 mm).22 However, we are not aware of previous studies which have assessed changes in the cochlear nerve diameter associated with noise-induced hearing loss (NIHL).
Structural changes associated with hearing loss have been shown throughout the central auditory pathway using MR morphometric parameters (cortical thickness, cortical surface area, grey matter (GM) and white matter (WM) volume).24 Studies (e.g., Alfandari et al. 2018,25 or see Slade et al. 2022 for a systematic review26) have demonstrated increased grey matter volume in the right angular gyrus and decreased white matter volume in the left fusiform gyrus in listeners with elevated audiometric thresholds compared to listeners with normal hearing, with a significant correlation between hearing acuity and cluster volume in the right angular gyrus in the hearing-impaired listeners. Hearing loss has been associated with reduced myelination27,28 and diffusion-based measures29,30 throughout the central auditory pathway. Blood-oxygen level dependent (BOLD) resting-state functional MRI (rs-fMRI) has shown widespread alterations across multiple networks in participants with noise-induced hearing loss,31 or linked to listening effort in age-related hearing loss.32
The authors are not aware of any human studies that have comprehensively examined the consequences of damage resulting from noise exposure in both the peripheral and central auditory systems using audiological, behavioural, and MR methods. This paper provides an overview of the NExpo Study design, including the rationale and hypotheses to be tested, measures used, and planned analyses.
Aims
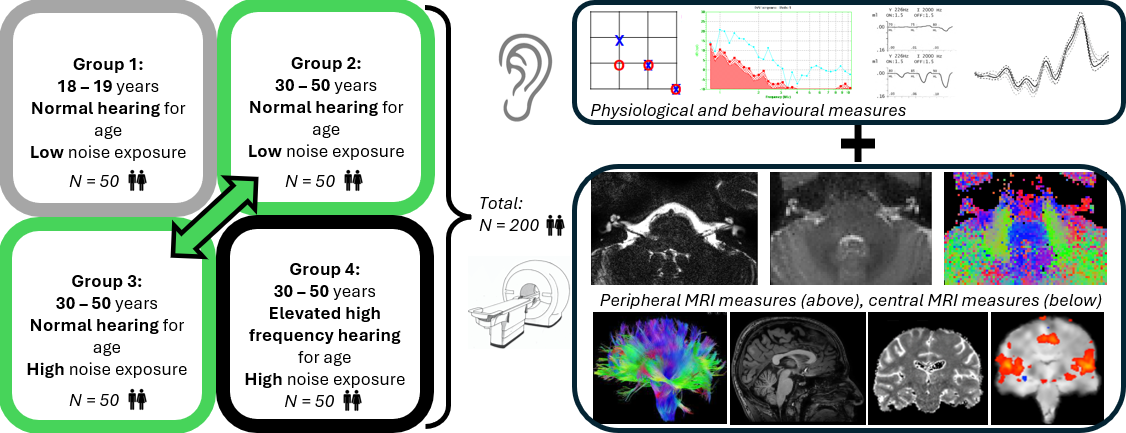
The NExpo Study aims to determine the functional and structural consequences of damage to the human peripheral and central auditory systems resulting from cumulative lifetime noise exposure. Specifically, to determine (1) the neural correlates of noise exposure in the peripheral (cochlear nerve) and central (auditory brainstem and auditory cortex) auditory system; (2) the relative contributions of age and hearing thresholds to these observed neural correlates of noise exposure; (3) how these structural and functional MRI measures of the auditory pathways correlate with measures of peripheral and central auditory function. This will be achieved by recruiting 200 healthy individuals split equally between four groups: Group 1: Young adults with low noise exposure and normal hearing, Group 2: Older adults with low noise exposure and normal hearing for their age, Group 3: Older adults with high noise exposure and normal hearing for their age, and Group 4: Older adults with high noise exposure and suspected NIHL.
Primary and secondary hypotheses
Primary hypotheses to be tested relate to the effects on structural MRI metrics of high noise exposure compared to low noise exposure in age-matched participants with normal audiometric thresholds (Group 3 versus Group 2). The inclusion of only normally hearing participants minimises the influence of audiometric hearing loss on physiological measures (e.g., ABR and MEMR). Secondary hypotheses relate to fMRI metrics and physiological and behavioural measures of noise exposure (Group 3 versus Group 2), as well as effects of age alone while controlling for audiometric threshold (Group 2 versus Group 1), and the effects of NIHL alone within individuals with similarly high levels of noise exposure (Group 4 versus Group 3). Table 1 provides the directions of hypothesised changes of primary and secondary effects.
Group comparisons with increasing severity of auditory nerve damage (Group 1 < Group 2 < Group 3 < Group 4) are hypothesized to be associated with:
-
Reduced cochlear nerve cross-sectional area and fractional anisotropy (FA);
-
Reduced volumetric measures throughout the central auditory pathway;
-
Reduced myelination throughout the central auditory pathway represented by reduced FA and increased T1 measures (reduced myelination);
-
Reduced cochlear nerve function (lower ABR wave I amplitudes and higher MEMR thresholds);
-
Reduced hair-cell function (higher EHF audiometric thresholds and lower OAE amplitudes);
-
Reduced speech-perception-in-noise ability (higher DiN thresholds).
Exploratory objectives
Exploratory objectives include assessment of associations:
-
between cochlear nerve cross-sectional area and both MEMR thresholds and ABR amplitudes;
-
between FA within the cochlear nerve and both MEMR thresholds and ABR amplitudes.
This protocol is pre-registered on the Open Science Framework website (https://osf.io/crx8z/).
Methods and analysis
Study setting and design
The NExpo Study is a single-site cross-sectional study funded through a UK Research and Innovation Medical Research Council Programme Grant (MR/V01272X/1) between The University of Manchester and University of Nottingham. The study is registered on ClinicalTrials.gov (ClinicalTrials.gov ID: NCT05076344). All data acquisition will be conducted at the Sir Peter Mansfield Imaging Centre (SPMIC), University of Nottingham as outlined in Figure 1. This manuscript reports the methods in sufficient detail such that they may be fully replicated, and that future publication of the results from this study can be supported by the availability of this protocol, in line with the process of research reproducibility64 recommended by the Organization for Human Brain Mapping (OHBM) Committee on Best Practice in Data Analysis and Sharing [COBIDAS; 65].

The NExpo Study plans to recruit 200 healthy adults comprising 50 participants in each of four groups, with Groups 2-4 being stratified for age and sex:
-
Group 1: Young adults (18-19 years) with low noise exposure and normal hearing;
-
Group 2: Older adults (30-50 years) with low noise exposure and normal hearing for their age;
-
Group 3: Older adults (30-50 years) with high noise exposure and normal hearing for their age;
-
Group 4: Older adults (30-50 years) with high noise exposure and suspected NIHL.
The primary hypotheses compare individuals with high and low noise exposure who have similar PTA thresholds (Group 3 versus Group 2) to isolate the effects of noise exposure alone. Recruiting individuals aged 30 to 50 years allows time for gradual changes to the structure of the cochlear nerve in the years following the period in which the individuals incurred the majority of their noise exposure, a process that is suggested to take at least a decade.9 Recruitment of a group of individuals over the same age range (30 to 50 years) but with noise exposure and PTA thresholds consistent with NIHL (Group 4) allows assessment of a larger potential effect size and determines whether MR measures have the required sensitivity to detect more extensive damage to the auditory pathway in the event of a negative result in the study’s primary group comparison. The inclusion of participants aged 18 to 19 years in Group 1 facilitates the isolation of effects associated with ageing.
Statistical power for group sizes was calculated conservatively based on measures of ABR wave I amplitude, a parameter likely to show the largest between-participant variability of all measures in the present study with a between-participant coefficient of variation (CoV) of ~30% for wave I amplitude16,65 for young individuals with low noise exposure. In contrast, the CoV for an MRI measure of normal cochlear nerve canal diameter was 5.6% in a recent study.19 Assuming a 25% loss of synapses in cases of noise damage compared to low-noise controls,66 an equivalent 25% reduction in wave I amplitude (and cochlear nerve volume), and therefore a Cohen’s d of 0.25/0.30 = 0.833, a power calculation resulted in 41 participants in each group required to achieve 80% power at alpha = 0.005 (adjusted for 10 multiple comparisons across the primary hypotheses). Assuming cochlear nerve diameter reduces with the square root of the number of fibres, a reduction in 25% results in the change in AN diameter of ~ 14%, suggesting ABR is less sensitive for detection of changes than MRI. Allowing for attrition, this study aims to recruit 50 participants into each of the four groups, totalling 200 participants. Prior MRI studies have used similar (or smaller) group sizes to assess alterations in hearing loss than used in our NExpo study. For example, T1-weighted structural data was used by Ren et al. to assess acquired hearing loss comparing 26 presbycusis patients and 26 matched normally hearing controls,67 whilst Alfandari et al.25 studied brain volume differences associated with hearing impairment in adults by comparing 17 individuals with hearing loss to 17 normally hearing controls. For DTI measures, Ma et al.68 used DTI to study presbycusis comparing results in 15 patients with presbycusis and 14 matched normally hearing controls, whilst Profant et al.38 studied DTI and MR morphometry in ageing and hearing loss in 20 young normally hearing controls, 17 elderly adults with mild presbycusis, and 17 elderly adults with profound presbycusis. Functional connectivity was studied by Chen et al.69 to assess disruption due to presbycusis in 22 presbycusis patients versus 23 normally hearing controls.
Other physiological measurements such as MEMR and DPOAE have CoVs of the order of 5-25%.70,71
Participant recruitment, eligibility and ethical issues
Recruitment opened in May 2022 and is expected to close in April 2025. Participants are recruited through advertisements displayed in public areas of university buildings (e.g. library noticeboards, departmental noticeboards allocated to recruitment leaflets), on noticeboards in other public and private buildings (with the owners’ consent), internet message boards (including Reddit and special interest groups for noise exposure, hearing loss, and occupations and hobbies associated with high levels of noise exposure), departmental websites, social media, local radio, and community magazines, and by targeting locations associated with activities that incur noise exposure, for example live music venues. Participants are recruited where possible using peer-referral approaches (e.g., snowball sampling, respondent-driven sampling72). Recruitment of participants with suspected NIHL is performed through the National Institute for Health and Care Research Clinical Research Network (NIHR CRN). Research audiologists screen patient records for potential participants and a member of the patient’s own care team approaches anyone who may be eligible to take part in the study. If individuals are interested in finding out more about the study, with no commitment to participate, they are given the contact details of a member of the research team.
Recruitment is stratified to ensure a balanced distribution of participant age in Groups 2 to 4, with equal numbers of individuals in subgroups of 30-32 years, 33-35 years, 36-38 years, 39-41 years, 42-44 years, 45-47 years, and 48-50 years. Recruitment criteria defining audiometric and noise exposure thresholds of each group are given in Table 2. Groups 1 to 3 have normal-hearing thresholds (500 Hz to 8 kHz) for their age as defined by the National Study of Hearing73,74 and measured using PTA. Group 4 exceeds the normal PTA thresholds for their age for at least one frequency in each ear in the range 3-8 kHz, consistent with NIHL, but do not exceed these thresholds in the frequency range 0.5-2 kHz, as this is indicative of other aetiologies of hearing loss.75,76 The inclusion of the 3-kHz threshold in the definition of NIHL is based on data from a prior study.77
Exclusion criteria comprise any contraindication for MRI, any sign of conductive hearing loss or diseases of the external or middle ear, identified by otoscopy and tympanometry,78 and any motor or cognitive impairment. Participants with Type I diabetes mellitus, often associated with peripheral neuropathy,79 or any other health condition associated with peripheral neuropathy, will be excluded from the study to avoid confounding measures derived from imaging of the peripheral cochlear nerve. Further, any participants reporting exposure to explosions (large infantry weapons, light artillery or anti-aircraft guns, large artillery weapons, or naval guns) are excluded due to the uncertainty around quantifying such kurtotic exposures.80
Ethical approval was granted for the NExpo Study by the London Stanmore Research Ethics Committee (21/LO/0615) on 21st September 2021. Potential participants are given an electronic copy of the information sheet, informed consent form, and MRI safety screening questionnaire at least 24 hours prior to participating in the study. On arrival at the imaging centre, participants are given paper copies of all study materials asked to sign an informed consent form prior to any further procedures being undertaken. All study participants provide written informed consent prior to participation in the study. Table 3 shows a schematic of enrolment and assessments for participants based on the SPIRIT guidelines.81
Measures
Screening procedure
Eligibility based on contraindications for MRI is determined by asking the participant to complete a 19-item screening questionnaire referring to the participant’s surgical history, implants and foreign bodies, epilepsy or blackouts, claustrophobia, tinnitus, tattoos, and willingness to remove all metal (body-piercing jewellery, false teeth, hearing aids etc.). Ineligible participants are excluded from the study at this point.
Otoscopy and tympanometry are performed in accordance with British Society of Audiology (BSA) guidelines78,83 to confirm the absence of any signs of conductive hearing loss or ear disease. Audiometry is performed to determine the participant’s hearing thresholds in a soundproof environment, free from distractions. Clinical PTA is performed in both ears at frequencies of 0.5, 1.0, 2.0, 3.0, 4.0, 6.0, and 8.0 kHz using a GSI Arrow Clinical Audiometer (Grason-Stadler, MN, USA), following the BSA recommended procedure.84 Participants exhibiting conductive hearing loss or ear disease, or who do not fit the audiometric profile required for recruitment into any of the unfilled participant groups, are excluded from the study at this stage. If any participant is concerned by the outcome of their audiometry, tympanometry, or otoscopy investigation they are recommended to visit their primary care physician or hearing healthcare provider.
Lifetime Noise Exposure Structured Interview (NESI): Total lifetime noise exposure is estimated using a structured interview procedure based on the Noise Exposure Structured Interview (NESI).14 The durations and levels of a participant’s noise exposures over their lifetime are combined to yield units of noise exposure linearly related to total energy of noise >80 dB(A). Levels and durations are estimated using a systematic approach, incorporating exposures accrued from (1) occupational and educational settings, (2) recreational settings, (3) use of personal listening devices, and (4) firearm noise. For (1) and (2) (free-field continuous-type exposures), the participant is asked to identify activities they have engaged in that take place in environments estimated to exceed 80 dB(A). For each activity, the participant is asked to estimate the level of exposure using a vocal effort scale ranging from “raised voice” (87 dB(A)) to “impossible to communicate” (110 dB(A)). For each noise exposure level, the participant is asked to estimate the duration of exposure, in years, weeks per year, days per week, and hours per day. Finally, the participant is asked to recall whether any ear protection was used, and if so, what type of ear protection, and estimate the proportion of the exposure time that ear protection was worn. The procedure for personal listening devices differs only in the method used to estimate sound level (based on typical volume-control setting). For firearm exposure, exposure duration and level are not estimated, due to the impulsive nature of firearm noise; instead, number of rounds and type of firearm are reported, and converted to energy-based units of noise exposure with an adjustment for the greater auditory hazard posed by impulsive noise.80
Participants who do not meet the noise exposure criteria (when combined with their age and audiometric profile) for recruitment into any of the unfilled groups are excluded from the study at this stage. Participants meeting all study criteria are given the opportunity to complete further data collection, including the MRI scan at a subsequent appointment.
Questionnaires: This covers participant demographic data, including handedness, residential post code (from which their socioeconomic status will be derived), smoking and vaping status, alcohol consumption, skin tone (melanin has been associated with otoprotective effects85), and tinnitus. If a participant reports that they have experienced spontaneous continuous tinnitus in the past year, their tinnitus symptoms and severity are further characterised using the Tinnitus Functional Index.82
Behavioural tests
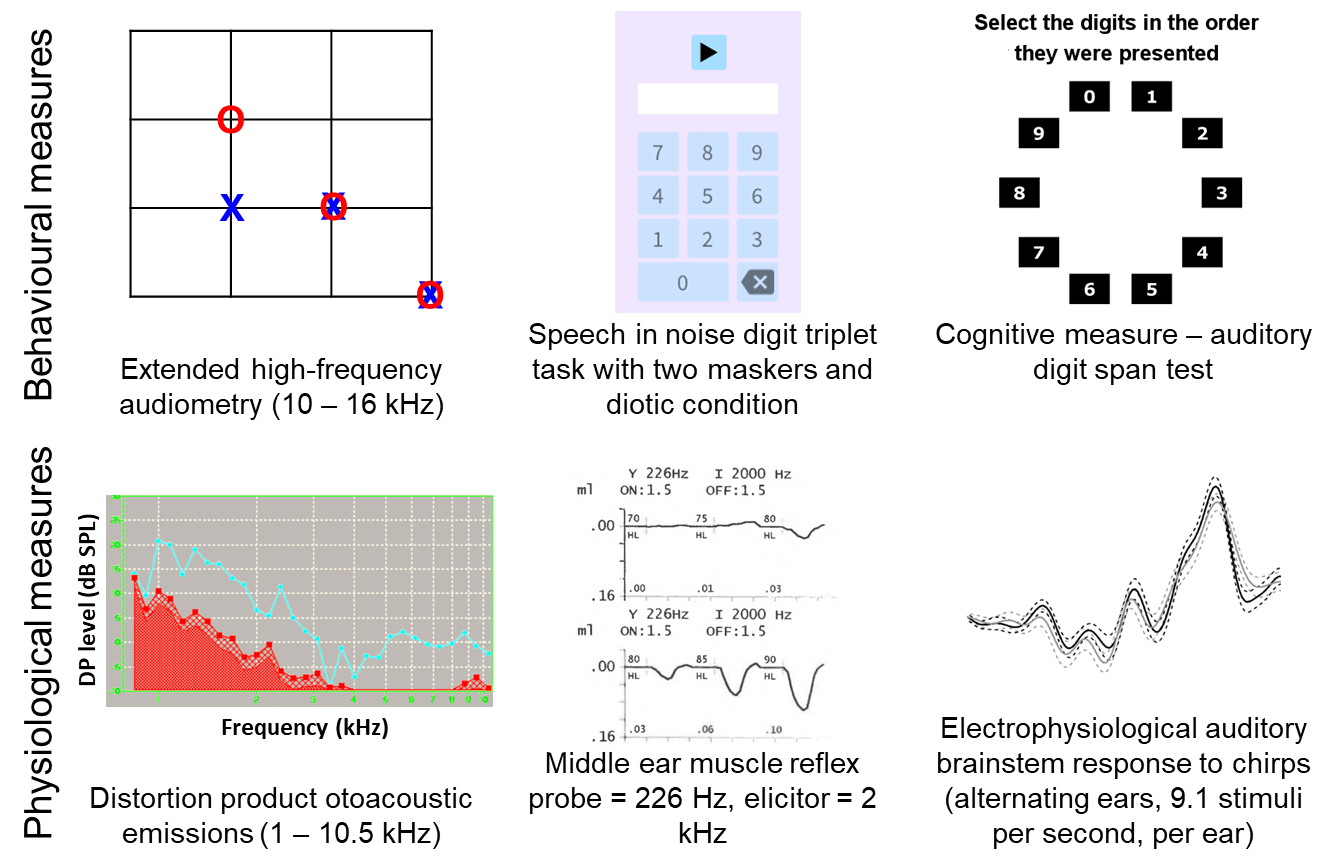
EHF audiometry: This is performed using third-octave narrowband noise stimuli centred on the frequencies of 10,080 Hz (bandwidth = 2,339 Hz), 12,700 Hz (bandwidth = 2,946 Hz), and 16,000 Hz (bandwidth = 3,712 Hz), following the procedure previously reported.77,86 EHF stimuli are presented using an M-Audio M-Track Quad external sound card (M-Audio, Cumberland, Rhode Island, USA) over Sennheiser HDA300 audiometric headphones suitable for high-frequency audiometry (Sennheiser electronic GmbH & Co. KG, Wedemark, Germany). Stimuli are generated using in-house software written in MATLAB (version 2021b, The MathWorks Inc., Natick, Massachusetts) and use a three-interval, three-alternative, forced-choice, visually cued adaptive paradigm with a two-down, one-up rule and a step size of 2 dB. The adaptive procedure is terminated after six reversals, and the mean of the signal level across all reversals computed. This process is used to establish monaural thresholds in the left ear first, followed by the right ear.
DiN test17: The DIN test has been shown to be sensitive to the hearing loss associated with noise exposure,87,88 whilst other tests (including those that involve contextual cues) are likely more influenced by cognitive processes such as working memory and attention.87,89 While it is acknowledged that the DIN test is less reflective of communication in the real world, it was chosen as it provides a reasonable compromise.87
Testing is performed in a quiet room with participants sitting comfortably at a desk, in a chair adjusted to the correct height, viewing a computer monitor placed 30 cm away showing the digits 0 to 9. Sound stimuli generated in Python using the Manchester Online Speech-perception Suite (MOSS) are presented using the same equipment as for EHF audiometry. The target comprises a carrier phrase, “The digits…”, followed by three digits sampled without repetition from the range 0 to 9 spoken by a female British-English talker. The participant enters the digits using a computer mouse and on-screen number pad. Thresholds are determined by varying the signal-to-noise ratio (SNR) according to a two-down, one-up stepping rule. Two or three digits must be entered correctly for a trial to be counted as correct. The adaptive track consists of an initial phase (with two reversals and 6 dB steps) and a threshold phase (with six reversals and 2 dB steps). Threshold is defined as the mean of the SNR values at the final six reversals. Both target level and masker level are varied to achieve the required SNRs, while overall stimulus level is held constant at 70 dB SPL; this approach is designed to prevent loudness discomfort even at very high or low SNRs.
A short practice block of two reversals, precedes the measurement blocks. Two listening conditions are employed in the measurement blocks, with one measurement block per condition. In the “diotic” condition, the masking noise is a speech-spectrum-shaped Gaussian noise and both target and masker are presented diotically. In the “spatial” condition, the masker is 10-person babble (female British-English talkers only) and the target and masker sounds are separated spatially (target at 0° azimuth, maskers at -60° and +60°) by convolving the sound files with a head-related impulse response function.
Digit span: Participants perform an auditory version of the forward digit span test (Inquisit Web, Millisecond Software, LLC, Seattle, Washington, United States), a working-memory test comprising a series of numbers spoken by a female American-English talker. Testing is performed in a quiet room, with participants sitting comfortably at a desk at optimal height whilst a computer monitor placed 30 cm away presents response options. Auditory stimuli are presented free-field at a comfortable level using Logitech LS11 2.0 stereo speakers (Logitech International S.A., Lausanne, Switzerland) arranged either side of the computer monitor facing the participant. The task is to listen to the series of digits and to recall them in order, and to respond by clicking on each digit in turn using the computer mouse. Participants are initially presented with a two-digit sequence. Subsequently, the sequence length is adjusted based on performance (increased by one following a correct trial and decreased by one following two incorrect trials). The task consists of two practice trials with feedback and 14 scored trials without feedback. The metric taken forward into group analysis is the maximal sequence length of correctly recalled digits.
Physiological tests
DPOAEs: DPOAE amplitudes are measured using an Echoport 292 (Otodynamics Ltd., Hatfield, UK) with primaries over the range 1 - 10.5 kHz at eight points per octave, resulting in an Fmin of 1.125 kHz and Fmax of 10.375 kHz. The f2/f1 ratio is 1.2, with a f1 level of 65 dB SPL and f2 level of 55 dB SPL.90 The frequency range is swept in a “cyclic down” order, i.e., dropping from 10.5 to 1 kHz, with three cycles per ear. The manufacturer default noise rejection settings are used. Participants are seated for the duration of testing.
MEMR: MEMR thresholds are measured from both ears using a TympStar diagnostic middle-ear analyser (Grason-Stadler, MN, USA) as described by Guest et al.90 The probe tone frequency is 226 Hz and elicitors are ipsilateral pulsed pure-tones with a frequency of 2 kHz and a duration of 1.5 s. For each ear, elicitors are presented at levels ranging from 55 - 100 dB HL, ascending in 5-dB steps, with two artefact-free presentations at each level (if significant measurement artefact is observed during the response period, the presentation is repeated). Reflex amplitudes are recorded as changes in middle-ear compliance following presentation of the stimuli. Response amplitudes are recorded for each of the 20 clean presentations made to each ear, then averaged within each level and ear to yield an MEMR growth function for each ear, from which the MEMR threshold is obtained (see Data Pre-Processing and Analysis Methods).
ABR: Electrical activity is recorded using the BioSemi ActiveTwo multi-channel electroencephalography (EEG) system with active electrodes (BioSemi B.V., Amsterdam, Netherlands). Three channels are used; with electrodes attached to the (1) high forehead, (2) right mastoid and (3) left mastoid with 10/20 electrode paste. Two additional electrodes are attached to the low forehead, less than three inches apart, to form the ground (Common Mode Sense and Driven Right Leg). Stimuli are generated using in-house software written in MATLAB, and the same external sound card as for EHF audiometry. Stimuli are transmitted via shielded Etymotic ER3A transducers with disposable insert foam ear tips. ABR stimuli consist of chirps presented at 72 dB nHL. Stimulus presentation alternates between ears, at a rate of 18.2 s-1 (9.1 s-1 per ear) for a total of 6000 clicks per ear. The recording lasts approximately 11 minutes. The recording is performed in an electrically shielded, darkened, soundproof room. Participants lie flat or near-flat and are instructed to close their eyes, relax as much as possible, and told that they should feel free to fall asleep if they are able. Stimuli are presented near-continuously throughout the relaxation and recording periods.
_behavioural_and_(b)_physiological_measures_used_in_this_study_to_assess_the_effects_of.png)
Neuroimaging measures and procedures
MRI is conducted using a Philips 3.0 T Ingenia MR scanner (Philips Healthcare, Best, Netherlands) with a 32-channel SENSE head coil in a 1-hour scan session. Participants wear both earplugs and active noise cancelling headphones, OptoActive Active Noise Cancellation Headphones system (Optoacoustics, Moshav Mazor, Israel), throughout the scan session. MRI data are acquired to assess structural and functional properties of the ascending auditory pathway, from the cochlear nerve, through the auditory brainstem of the cochlear nucleus (CN), superior olivary complex (SOC), nucleus of the lateral lemniscus (NLL), inferior colliculus (IC), and medial geniculate body (MGB), to the auditory cortex (AC). Table 4 provides key descriptions and parameters of the scans collected.
Cochlear nerve assessment
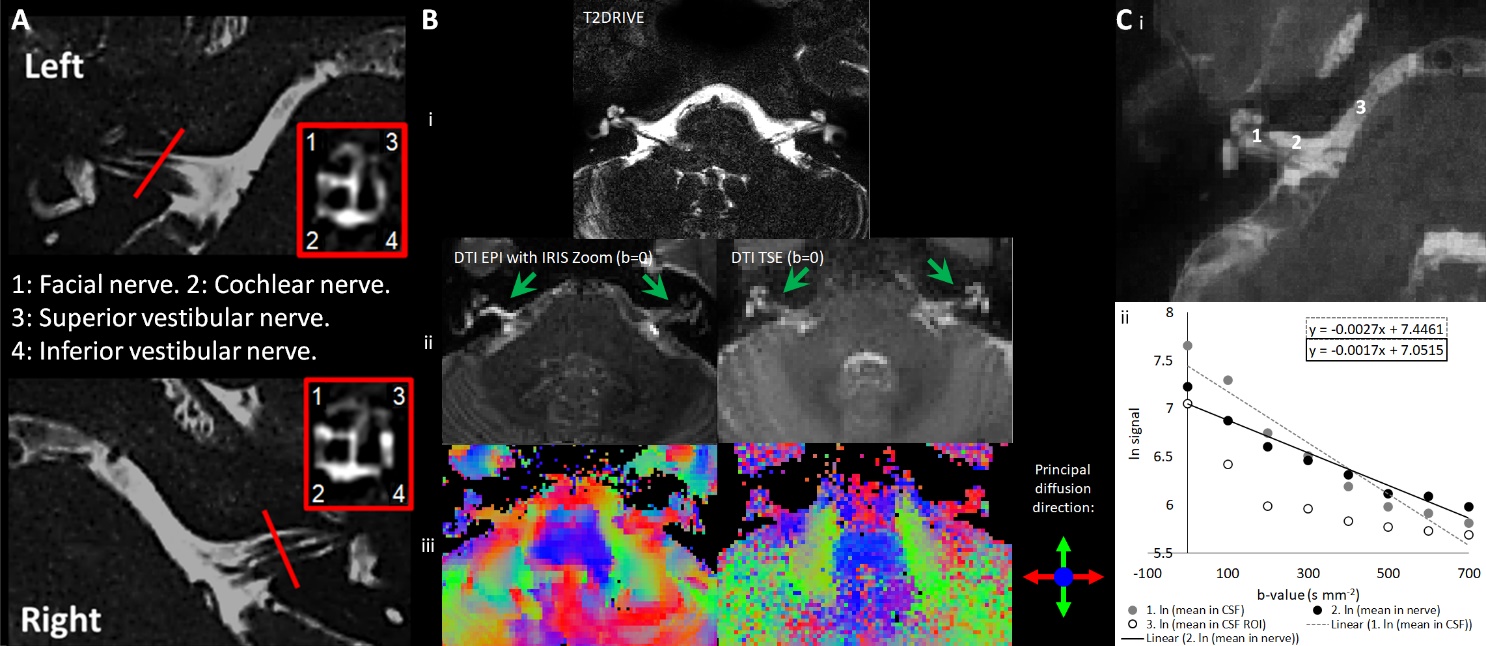
MRI neurography: This is planned from the coarse resolution T2DRIVE image. Anatomical detail of the cochlear nerve is assessed using a high resolution T2DRIVE image (Figure 3A).
DTI of the Cochlear Nerve: This reflects the changes in the diffusion anisotropy of water molecules in the nerve fibre bundles. The DTI scheme was optimised by comparing a Turbo Spin Echo (TSE) readout (Table 4) with an IRIS-Zoom echo-planar imaging (EPI) readout [1 mm isotropic spatial resolution, no slice gap, TE/TR of 84/3000 ms, 6 EPI shots, 90° FA, frequency/phase-encoding BW of 926.9/31.5 Hz, FOV of 120 × 120 × 12 mm] (Figure 3B). The TSE readout prevents EPI geometric distortions allowing diffusion metrics to be overlaid onto the T2DRIVE images, and so despite the slightly lower spatial resolution, the TSE scheme was chosen. The DTI TSE scan was optimised for b-values across 0-700 smm-2 in 100-smm-2 steps, with a maximum b = 700 smm-2 based on recommendations for imaging peripheral nerves.91 Figure 3C shows the signal measured in the cochlear nerve, CSF adjacent to the nerve and a pure CSF region. A b = 300 smm-2 can be seen to provide the optimum difference in signal between the pure CSF and the cochlear nerve canal. DTI data were then collected at b = 300 smm-2 and 700 smm-2 with the number of repeated acquisitions of each b-value analysed systematically for the resultant maps from DTIFIT while minimising the total duration of the acquisition (FSL10). The optimised DTI TSE protocol uses b = 0, 300, and 700 smm-2 collected with NSA=3 (number of signal averages) with 1, 2, and 6 repeated acquisitions respectively, in 6 vector directions evenly distributed around the sphere (Philips opt 6). Magnitude and phase data is saved, and a dynamic noise scan (no RF, no gradients) collected for NOise Reduction with DIstribution Corrected (NORDIC) PCA denoising.92
_t2drive_slice_shown_at_the_level_of_the_cochlear_nerve_and_annotated_for_anatomical_re.jpeg)
Structural and Functional assessment of the brainstem and brain
Structural brain measurements: A whole-brain 3D anatomical Magnetisation Prepared Rapid Acquisition Gradient Echo (MPRAGE) acquisition is acquired (Figure 4B). High-resolution whole brain quantitative T1 mapping93 is acquired using a fast field echo (FFE) EPI acquisition. In this scheme, a segment of k-space is acquired after each excitation to maintain a short acquisition window, thereby minimising image distortion and dropout and ensuring a narrow point-spread function.93 Multiple inversion times are collected by varying the slice acquisition order using slice offsets [0, 12, 24, 36, 48, 60, 72, and 84] across eight dynamics, with magnitude and phase data saved and a final dynamic noise scan collected for NORDIC PCA denoising.92 T1 is sensitive to alterations in myelin, axons, free water, and iron (e.g., demyelination, axon loss, oedema, and chronic inflammation) leading to prolonged T1 relaxation times.94
Whole brain DTI: This is acquired using a multishell DTI protocol matched to the UK Biobank95 with 50 diffusion-encoding directions acquired at b=1000 s/mm2 and b = 2000 s/mm2 using a multishell approach. DTI data is collected with a single-shot EPI readout with fold-over in the anterior-posterior (A-P) direction and fat shift in P, and a b=0 smm-2 image acquired with fat shift in both P and A for TOPUP distortion correction.
rs-fMRI: High resolution gradient echo (GE) EPI rs-fMRI data is acquired with slices planned in a coronal oblique orientation for coverage of the brainstem and Heschl’s gyrus, with 300 volumes acquired in 10 minutes. Breathing and heart rate data are recorded throughout using respiratory bellows and a peripheral pulse unit to correct for physiological noise in the analysis (RETROICOR96). The OptoActive Active Noise Cancellation headphones are used to provide noise cancellation during the rs-fMRI acquisition.97 Throughout the rs-fMRI, subjects fixate on a 6-cm white cross in a black background on a 32" BOLDscreen with a 1920 × 1080 widescreen LCD display (Cambridge Research Systems Ltd., Rochester, UK) using a mirror attached to the head coil. Following this, spin-echo (SE) EPI volumes are acquired with the fat shift direction as above and reversed for image distortion correction, of particular importance for the brainstem.77,86,97 In addition, a B0 map (dual echo ∆TE= 1ms) and a B1 map (DREAM = Dual Refocusing Echo Acquisition Mode) are acquired for scanner quality assurance.
_central_brain_sub-cortical_and_cortical_rois_(identified_from_a_prior_functional_study.png)
If any MRI scan shows an abnormality, the images are sent to a neuroradiologist who then contacts the participant’s primary care physician if they decide that the finding warrants further investigation.
Data management
All data are collected and stored under a de-identified Research ID and visit number. A link between research ID and personal details is made using the Trial Master File. All electronic data are stored on secure remote data storage drives maintained and backed up by the University of Nottingham and Nottingham University Hospitals Trust. All imaging data are stored on PACS (Picture Archiving and Communication System) and held on a secure XNAT server (an open-source imaging informatics software platform) hosted at the University of Nottingham. Access to data and request for collaboration are welcome and will be conducted under the rubric of the European Union’s General Data Protection Regulation. Data sharing of the dataset (in DICOM format) will be made available on request via XNAT. For this, imaging data will undergo DICOM tag anonymisation with the removal or modification of potentially identifiable information from DICOM metadata before distributing the data. Further, brain images will be run through the XNAT Face Masking package which implements anatomical surface modification algorithm customized to de-identify MR head images that minimizes the impact on the resulting image statistics.98 An excel file containing all behavioural data will also be available to download from XNAT.
Data pre-processing
Screening data
Lifetime noise exposure data: Noise exposure units are calculated for each continuous-type noise-exposure activity using Eqn.1,99
noise exposure units=Y×W×D×H2080×[P×10L−A−9010+(1−P)×10L−9010]
where Y = number of years of exposure, W = number of weeks per year of exposure, D = number of days per week of exposure, H = number of hours per day of exposure. L = level of exposure, in dB(A), as estimated by the participant. A = attenuation of hearing protective equipment (dB), and P = proportion of time protective equipment was worn, between 0 and 1. Units for all activities are calculated and summed to give a participant’s total lifetime noise exposure, a measure linearly related to total energy of exposure above 80 dB(A). Energy-based units for firearm noise are calculated using values from,80 incorporating an adjustment for the greater auditory hazard posed by impulsive noise.
Behavioural data
EHF audiometry: The mean threshold in each ear is calculated as the mean of the thresholds across the range [10.08 – 16] kHz.
DiN: This produces a “diotic” threshold (for diotic digits in diotic speech-shaped noise) and a “spatial” threshold (for central digits in spatially separated babble). The difference between the two thresholds is computed as an additional measure of masking release for use in exploratory analysis. The spatial DiN is expected to have greater sensitivity than the diotic DiN to temporal processing deficits arising from auditory neural damage, due its use of modulated maskers and reliance on inter-aural time differences.
Digit span: If the maximal sequence length of correctly recalled digits is found to correlate with the primary predictor (NESI units) or to any of the DiN outcomes, this may be a sign that participant cognitive ability may bias the data. If this is the case, the maximal sequence length will be added as a covariate.
Physiological data
DPOAE data: “Standard-range” DPOAE amplitude in each ear is calculated as the mean of the DPOAE amplitudes across3–6 kHz; “EHF” DPAOE amplitude will be the mean amplitude across [8.25-10.5] kHz.
MEMR data: MEMR thresholds for each ear are obtained algorithmically from the measured amplitude-growth functions.54 Threshold is defined as the lowest elicitor level at which the growth function crosses a criterion value (baseline amplitude minus a fixed value, applied across all participants). For any participants whose MEMR thresholds exceed the maximum presentation level (100 dB HL), a threshold of 105 dB HL and an amplitude of 0 mmho will be recorded.
ABR data: ABR data are processed using in-house software written in MATLAB. For each ear, the time-course of the potential difference between the high forehead and the ipsilateral mastoid is filtered (using a fourth-order Butterworth filter between 100 Hz and 2 kHz) and divided into epochs extending from 10 ms pre-stimulus to 13 ms post-stimulus, after correcting for the 0.91 ms acoustic delay introduced by the tube connecting the transducer to the ear. Epochs with a root-mean-square amplitude of more than two standard deviations above the mean are rejected and remaining epochs averaged. An automatic peak-picking algorithm is used to identify ABR waves I and V for each ear based on the waveform maxima and minima observed in pre-specified time windows. Optimal window timings are determined based on the peak latencies observed across the sample and these windows applied when analysing all participants’ waveforms. Effort is made to avoid manual deviations from the algorithm, and any such deviations will be reported fully. If >20% of waveforms cannot be interpreted by the automatic peak-picking algorithm, then waveforms will instead be manually interpreted. Exploratory analyses will use ABR wave I and wave V amplitudes (measured peak-to-trough) and peak latencies of waves I and wave V for each ear, while wave I amplitude will be the secondary outcome measure.
Neuroimaging data
Image Archiving and Quality Control
Participant digital imaging and communications in medicine (DICOM) session files are uploaded onto an XNAT (Washington University School of Medicine) database infrastructure. Once the session is archived within XNAT, it is put into a quarantined state awaiting quality control (QC).
All MRI scans are visually inspected for data quality, with quality assessment ratings of image SNR and temporal SNR assessed using the MRIQC v0.11.0 and local fMRI quality assurance (QA) pipelines including temporal signal-to-noise ratio (tSNR) assessment.100 BOLD rs-fMRI data MRIQC reports are checked for frame-wise displacements larger than 3 mm, average frame-wise displacement over 1 mm, image artifacts, or long-lasting intensity changes owing to motion in the carpet plot. If any of these are present the BOLD rs-fMRI fails QC, and the participant will be removed from subsequent statistical analyses.
Pre-processing of the structural and functional MRI data uses tools from the following packages: Statistical Parametric Mapping v12 (SPM12 (http://fil.ion.ucl.ac.uk/spm/)101 FMRIB Software Library (FSL) v5.0.11102 and Freesurfer v6,103 the SPMIC-BRC pipeline,104 and local MATLAB and Python software toolboxes. Analysis pipelines developed in this study will be made available on GitHub (https://github.com/SPMIC-UoN/).
Cochlear nerve data assessment
MRI neurography: Manual drawing to define the cochlear nerve is performed by two investigators on 48 datasets evenly distributed across the four groups, from which to extract nerve metrics of the cross-sectional area of the left and right cochlear nerves. Binary masks of the cochlear nerve will be used for machine learning using a convolutional neural network (CNN) for feature extraction and Transformer for segmentation prediction to segment the cochlear nerve.105 A further 48 datasets will be used for model validation and estimation of the dice scores with the manual masks. The CNN will then be applied to the remaining 104 datasets to estimate cochlear nerve cross-sectional area.
DTI of the Cochlear Nerve: DTI TSE datasets are first denoised using NORDIC PCA (MATLAB).92 Datasets are then processed using DTIFIT (FSL) on a voxel-wise basis using a weighted least-squares approach106 to calculate the mean value of the FA and mean diffusivity (MD) within each cochlear nerve mask for both the left and right cochlear nerve for each individual. FA indicates the directional preference of diffusion with physiologically high values in more intact nerves, while MD reflects the average magnitude of molecular displacement by diffusion of the tensor. The cochlear nerve binary mask from the MRI neurography is then resampled into DTI TSE space using FSL FLIRT.107
Structural and functional analysis of the auditory pathway pre-processing and analysis
Structural brain measurements: The T1-weighted MPRAGE dataset is brain extracted using the Brain Extraction Tool (BET, FSL) to remove any non-brain tissue from the image. Nonlinear Image Registration Tool (FNIRT, FSL)108 is then used to transform the MPRAGE data from native to the 1-mm MNI 152 template reference space. In this template space, group features are then generated to assess (i) global, and (ii) auditory pathway specific brain measures. First, the SIENAX tool109,110 is used to derive segmented global tissue measures including total brain volume, and total volume of white matter (WM), grey matter (GM), and cerebrospinal fluid (CSF). The GM is then segmented using FMRIB’s Automated Segmentation Tool (FAST)111 and ROIs of the central ascending auditory pathway (CN, SOC, NLL, IC, MGB, and auditory cortex) defined from an independent fMRI dataset published in Dewey et al.77,97 using a broadband stimulus are used to assess GM volume. To confirm the appropriateness of these functional ROIs77 their overlap with a high-resolution (100 μm) ex-vivo atlas published online by Sitek et al.112 was assessed.
T1 myelination mapping data undergo NORDIC PCA denoising92 and a binary mask applied using BET (FSL, fMRIB). The multiple datapoints acquired with different T1 weightings are fit with an in-house Python script93 to generate a T1 map (Figure 4B). Each participant’s T1 map is transformed to the MNI 152 template (as for the MPRAGE data).
For the MPRAGE and T1 myelination mapping data, GM auditory cortical and subcortical ROIs are interrogated for between-group differences.
Whole brain DTI: DTI data are pre-processed in FSL following the analysis procedure used by the UK Biobank.113 First data is corrected for geometric distortions and participant motion using the eddy tool,114 which accounts for eddy currents and participant motion and corrects susceptibility-induced distortions using an off-resonance field computed using the TOPUP algorithm.109,115 Following this, the DTIFIT tool106 is used to apply a diffusion tensor model to provide FA and MD, measures of directionality and magnitude of diffusion. The data are fed into AMICO116 a non-linear solver for fitting the NODDI (neurite orientation dispersion and density imaging) model,117 a multi-compartment biophysical model from which to obtain microstructural properties of neurite density index (NDI) and fibre orientation dispersion index (ODI). DTI and NODDI metrics (FA, MD, NDI, and ODI) are then extracted using a white matter atlas of 48 standard-space tract masks defined by the JHU Template.118,119 To reduce partial volume contamination, these ROIs are further filtered using an FA skeleton (obtained through the TBSS pipeline,120 so that only the “core” of each tract is depicted in the values.
On the skeletonised FA, MD, NDI, and ODI maps, permutation-based statistics are carried out (using randomise of FSL; 5000 permutations) using a design with Group as a between-subjects factor including covariates. P-values are corrected using Threshold-Free Cluster Enhancement (TFCE)121 at a corrected alpha of 0.05. Resulting statistical DTI group maps are compared across measures to evaluate overlap of discriminating voxels and unique contributions.122
BOLD resting state functional MRI (BOLD rs-fMRI): Data are first denoised using NORDIC PCA,92 followed by EPI distortion correction by inputting the positive and negative phase-encoded acquisitions into TOPUP109,115 before physiological artefact correction for respiratory and cardiac effects using RETROICOR.96 Data are transformed into MNI space to perform group analyses, using the co-registration of the MPRAGE images to MNI space as described above to allow the ROIs of the central ascending auditory pathway (left and right CN, SOC, NLL, IC, MGB, and auditory cortex) in Dewey et al.32 to be assessed. Seed-to-seed resting-state functional connectivity analysis is then carried out in the CONN toolbox in SPM12 implemented in MATLAB.123 Images are pre-processed using the standard pipeline in CONN (Artifact Detection Tools (ART) toolbox (www.nitrc.org/projects/artifact_detect), band-pass filtering (0.008–0.09 Hz) to discard cardiovascular and respiratory noise, and spatial smoothing using a Gaussian kernel of full-width half-maximum 2 mm. Movement parameters derived from the realignment are included in the model as additional regressors to correct for motion artefacts (CompCor method). The averaged signal from each ROI (seed) is then correlated with the signal of every other ROI (target) and normalised using Fisher’s r-to-z transforms.
Table 5 lists the primary and secondary outcome measures.
Statistical analyses
To address the primary hypotheses, quantitative MRI measures in the cochlear nerve, and in ROIs in the ascending auditory pathway and primary auditory cortex will be evaluated for symmetry and averaged across hemispheres before examining differences between participant groups using a group analysis of covariance (ANCOVA). Any data that are not normally distributed are examined using the relevant non-parametric statistical tests (Mood’s median test, Mann-Whitney U test, Kruskal-Wallis’ test). Bivariate statistical significance will be assessed at a threshold of p < 0.05 after Bonferroni-Holm correction across the five tests of primary outcomes.
Functional connectivity correlation coefficients from each participant are entered into a 2nd-level model with Group as a between-participant factor including nuisance covariates and corrected for multiple comparisons to provide seed-level false-discovery rate (FDR)-corrected p < 0.05 p-values using Benjamini and Hochberg’s algorithm,124 as implemented in the CONN toolbox.
The dependent variables of cochlear nerve cross-sectional area, and diffusion (FA), ABR wave I amplitude, MEMR threshold, DPOAE thresholds, and EHF thresholds are used in separate ANCOVAs/non-parametric equivalents as they are distinct from each other.
Exploratory analysis of interactions with audiometric thresholds, tinnitus experience, and other participant variables such as skin colour are also considered using partial regressors. ANCOVAs of non-parametric tests are run without exploratory variables in the first instance and then exploratory variables added as partial regressors for the tests to be conducted again to observe the effect of those exploratory variables on the effects seen. Analyses are based on all observed data, but the number of participants excluded, and those with missing data, will be reported in publications.
Although the above pipeline is described, any analyses carried out for final publication will seek to use further developed state-of-the-art pipelines to make the best use of the data at the time. Thus, later versions of software or new tools may be incorporated into this pipeline.
Results
The first participant was recruited on May 31, 2022, and data collection is ongoing. To date, 193 participants have completed the protocol, but no data analysis has yet taken place. The processing and analysis steps described in this manuscript will be considered the definitive version for the primary and secondary outcomes, and findings from any further or exploratory analyses will be published explicitly as exploratory outcomes.
Conclusion
The findings of this ongoing study, the NExpo Study, will provide a comprehensive characterisation of the physiological effects of noise exposure and hearing loss in a cross-sectional cohort. Physiological data in the age range of 30 to 50 years will be compared between groups with high and low noise exposure, and with and without suspected NIHL, and placed into the context of a control group of individuals aged 18 and 19 years, with low levels of lifetime noise exposure and with audiometric thresholds in the normal range. This is the first study to assess the associations between these measurements in individuals with and without noise exposure and noise-induced hearing loss while controlling for age. One of the aims of this study is to identify more sensitive tests for the early detection of noise damage, for use in the clinic and for monitoring hearing health in the workplace. Animal research suggests that physiological measures such as the ABR and the MEMR may be sensitive to the neural changes that occur before hearing thresholds are elevated, while DPOAEs have particular sensitivity to outer hair cell loss. Some human studies suggest that noise exposure impacts hearing thresholds in the EHF range before the standard range. If shown to be sensitive, tests such as DPOAEs and EHF audiometry have particular promise, since they are quick to run and use standard clinical equipment. However, for identifying neural changes, ABR or MEMR might be needed. Our study should provide validation data regarding their relation to auditory nerve volume measures. While it is unlikely that any of the imaging measures implemented in this study will be incorporated into clinical diagnostic and care settings, outcomes of the research could result in the development of diagnostic tests, as well as provide evidence for a reduction in legal noise exposure limits to help prevent hearing loss, improve patient outcomes, and reduce usage of limited healthcare resources.
Acknowledgements
This research is funded by the Medical Research Council (MR/V01272X/1) and supported by the National Institute for Health and Care Research (NIHR) Manchester Clinical Research Facility (NIHR203956) and the NIHR Nottingham Biomedical Research Centre (NIHR203310), Nottingham University Hospitals NHS Trust, and the University of Nottingham. The views expressed are those of the authors and not necessarily those of the NIHR or the Department of Health and Social Care.
Conflicts of Interest
The authors declare no competing interests.
Abbreviations
ABR = auditory brainstem response; AC = auditory cortex; BSA = British Society of Audiology; CN = cochlear nucleus; CS = compressed SENSE; CSF = cerebrospinal fluid; DPOAE = distortion product otoacoustic emission; DRIVE = driven equilibrium; DTI = diffusion tensor imaging; EEG = electroencephalography; EHF = extended high frequency; EPI = echo planar imaging; FA = fractional anisotropy; FFE = fast field echo; fMRI = functional magnetic resonance imaging; GE = gradient echo; HL = hearing level, IC = inferior colliculus; MB = multiband; MEMR = middle ear muscle reflex; MGB = medial geniculate body; MNI = Montreal Neurological Institute; MPRAGE = magnetisation prepared rapid acquisition gradient echo; MRI = magnetic resonance imaging; NESI = noise exposure structured interview; NLL = nucleus of the lateral lemniscus; OAE = otoacoustic emission; PTA = pure tone audiometry; rs-fMRI = resting state functional magnetic resonance imaging; SE = spin echo; SENSE = sensitivity encoding; SNR = signal to noise ratio; SOC = superior olivary complex; SPL = sound pressure level; T2DRIVE = T2-weighted driven equilibrium; TE = echo time; TFI = tinnitus functional index; TR = repetition time; TSE = turbo spin echo