Introduction
Analysis of positron emission tomography (PET) data is usually performed based on macro-anatomical regions of interest (ROIs; e.g., the Desikan atlas1). In many cases, however, chemo-architectural boundaries do not correspond well to anatomical atlases.2 Moreover, they are not hard boundaries, but rather spatially varying densities of molecular targets, which can overlap in complex ways and vary from participant to participant. The anatomical atlas does not allow voxels to be shared by multiple regions, which simplifies the anatomical representation but may reduce the accuracy in complex areas where the boundaries of different regions may actually overlap. Here, we propose to use an independent component analysis (ICA) framework, which allows for separation of the PET signal into whole brain covarying networks. ICA allows for multiple overlapping networks across participants for a given PET radiotracer. Simultaneously, each network is kept as distinct as possible from the others, ensuring that every network remains unique. Even with unique networks, a single voxel can be part of more than one network, with each network contributing a certain “weighted intensity” to that voxel. The voxel weight represents the strength or degree to which it is associated with each network. This allows for a more nuanced understanding of how different brain networks might interact or coexist within the same anatomical space. ICA may also identify networks that are consistent across different participants, meaning the same patterns or networks are observed in similar ways across a population, which can be particularly useful in understanding common functional or molecular patterns in the brain. In PET, molecular patterns are also affected by the radioligand used, with differences in affinity and binding characteristics.
In this study we use florbetaben3 (FBB) and florbetapir (FBP) radioligands that bind to amyloid-beta (Aβ) plaques. Aβ plaques have been shown to accumulate with healthy aging and can be measured using PET with FBP and FBB, among other radioligands,4–6 which likely reflect specific binding to these plaques. The following gray matter (GM) regions track both disease and healthy aging using standardized uptake value ratios (SUVR) and FBP4,7: medial orbital frontal, temporal, anterior and posterior cingulate, parietal, and precuneus. A study by Fleisher et al.7 shows that older healthy control subjects have a steeper SUVR increase after age 58 than before, while AD patients have a stronger SUVR increase regardless of age. Since FBB is similar to FBP, FBB may quantify age and disease analogous to FBP.
Both FBP and FBB exhibit off-target binding in the white matter (WM) thought to be explained by their affinity for the beta-sheet structure of the myelin basic protein.8,9 Such off-target binding can contaminate the signal originating from Aβ binding owing to partial volume effects, thus affecting quantification. Since this study focuses on Aβ targets and not beta-sheet structure, regions that target beta-sheet structures will be excluded. In addition to off-target binding in WM, increased ventricle size with age, even among control participants,10 may distort the uptake measures for both FBB and FBP. The enlarged ventricles may lower SUVR values with age, especially for older adults, in regions adjacent to CSF and ventricles, which is why those regions are excluded as well.
A previous blind ICA study11 that may have similarities to our study, even though it employed the flortaucipir radioligand, identified ten tau-related independent components. Most of these components were bilateral but were not assessed for their replicability. Typically, ICA approaches are ‘blind’ and thus, in the case of spatial ICA, make no assumptions about the shape of the spatial maps. To facilitate statistical analyses, group ICA approaches were developed to provide a common inferential framework,12 solving component matching within a study. While this framework solves within-study component matching, comparisons across studies remain difficult, due to variations in model orders and other methodological differences that affect the extracted components. Therefore, spatially constrained ICA approaches allow a set of reference components to be used as spatial ‘priors’ which are then adapted to a given dataset.13 A leading spatially constrained ICA algorithm is the multivariate-objective optimization ICA with reference (MOO-ICAR), which performs well in capturing subject-specific information and removing artifacts.14,15 The automation of the NeuroMark pipeline was accomplished through the development of its specialized templates, notably the NeuroMark version 1 template,16 NeuroMark version 2 multiscale templates,17 and NeuroMark version 3 age-specified templates.18 The NeuroMark method circumvents manual selection of model orders and provides a framework that robustly yields reliable components across different participants and studies. This approach allows for the spatial correspondence of atlas-based approaches while benefiting from the adaptive nature of data-driven approaches. NeuroMark has been widely applied to functional magnetic resonance imaging (fMRI) data and extended to structural magnetic resonance imaging (MRI) and diffusion MRI, and includes a set of modality-specific ICA templates (http://trendscenter.org/data) as well as an automated pipeline implemented in the GIFT software12,19 (http://trenscenter.org/software/gift).
Multivariate NeuroMark templates, containing spatial independent component (IC), as with univariate atlases, are often derived from control participants. For example, the DKT atlas1 was built using control participants (excluding those with tumors, infarcts, or dementia) but is still applied to patient populations. Likewise, the first NeuroMark template was created from control participants, successfully differentiated schizophrenia patients from a control group seen in publication16 (as shown in Figure 7B of referenced publication), and this group-difference detection has been replicated.16 By the same principle, a NeuroMark PET template generated from a control group may be used to contrast groups, for instance, comparing healthy controls versus Alzheimer’s disease (AD) patients. In addition, the NeuroMark template, serving as a prior for the subjects to whom the algorithm is applied, uses a multi-objective optimization solver,15 a feature that was extended from group ICA to NeuroMark, making the estimation of outliers even more robust. In this study, we aim to evaluate how well an anatomical atlas versus NeuroMark ICA tracks biological factors. In neuroimaging, a commonly tracked biological factor is age. Therefore, in this study, we also track age to compare the anatomical atlas to NeuroMark ICA, which may be representative of other biological factors. First, we show that blind ICA reliably decomposes PET data - here, FBP - into biologically meaningful networks related to Aβ or myelin basic protein. Next, we generate NeuroMark ICA templates for FBP following the NeuroMark fMRI template.16,20–22 Subsequently, we apply the NeuroMark template to analyze a separate dataset with FBB data. Since FBB and FBP are structurally similar molecules with highly correlated binding patterns in the brain, the patterns across FBB and FBP subjects may be similar, providing a tracer-independent validation of the multivariate template. We also show, through a correlation analysis between tracer binding/amyloid and age, that using ICs provides more statistical power than macro-anatomical ROIs.
Methods
Participants
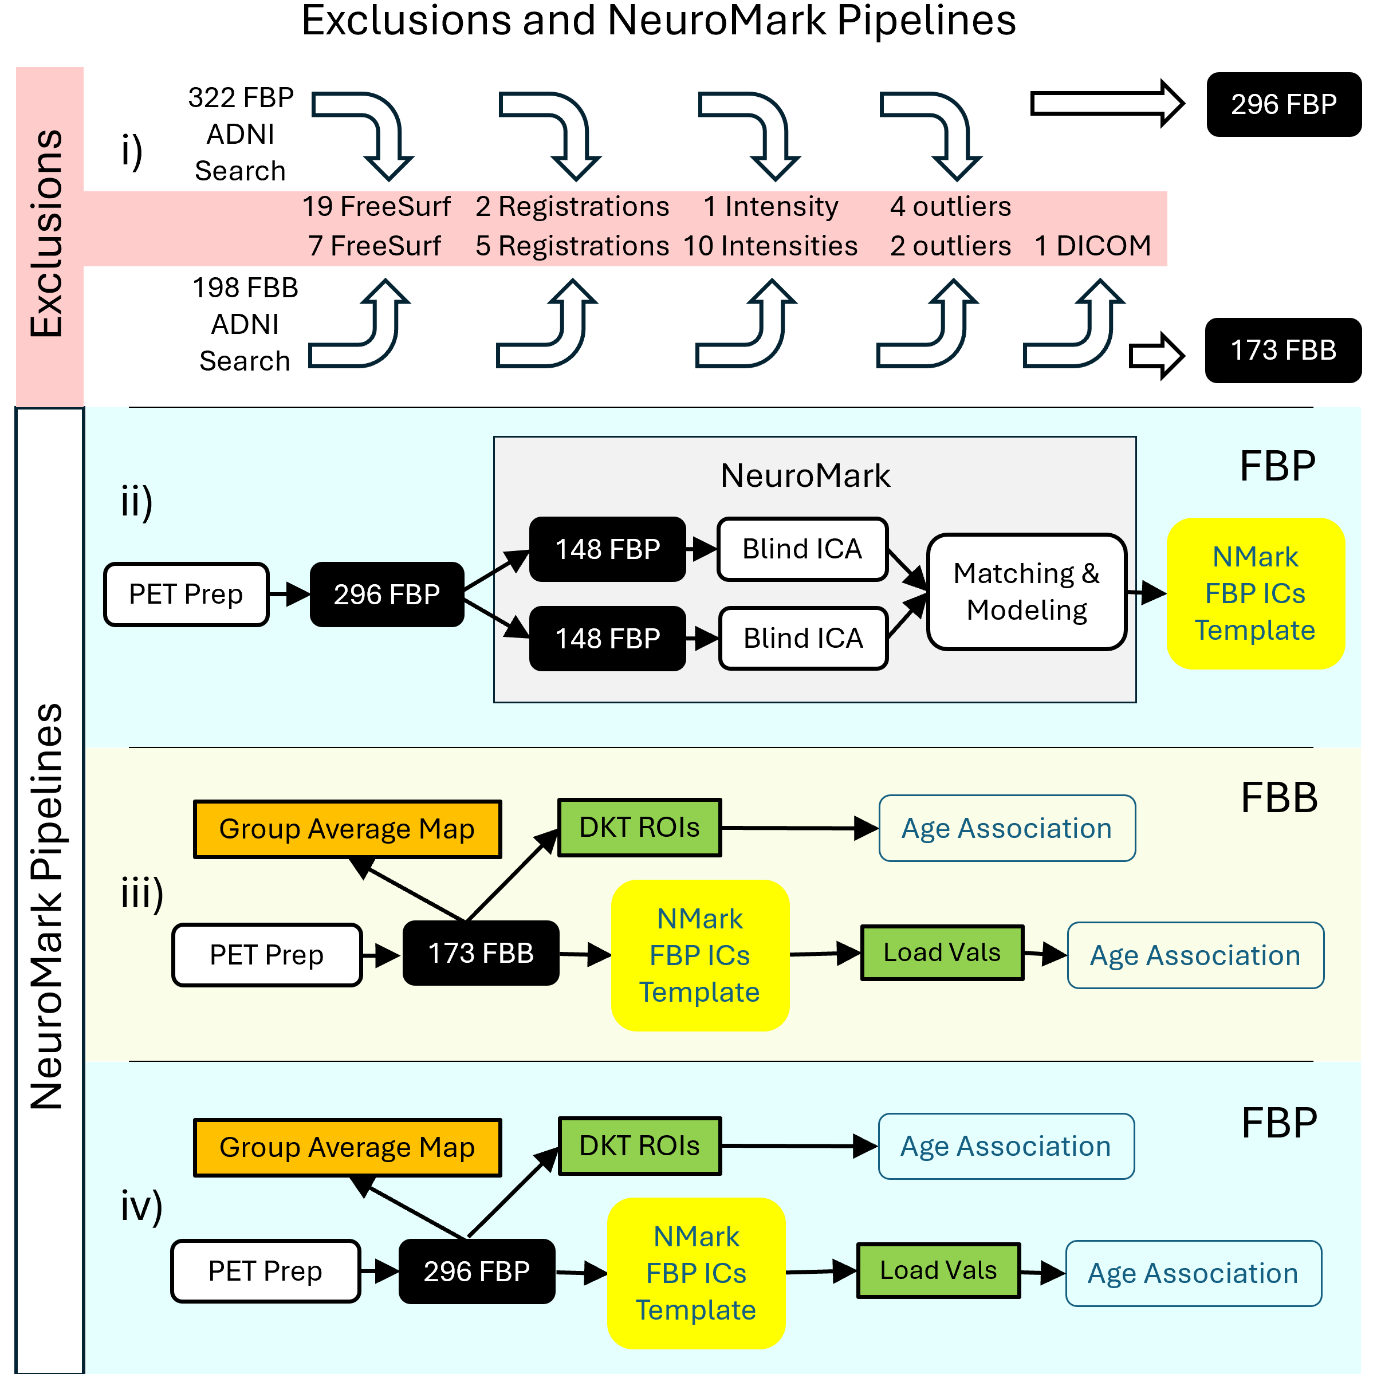
Data used in the preparation of this article were obtained from the Alzheimer’s Disease Neuroimaging Initiative (ADNI) database (http://adni.loni.usc.edu/). The ADNI was launched in 2003 as a public-private partnership, led by Principal Investigator Michael W. Weiner, MD. The primary goal of ADNI has been to test whether MRI, PET, other biological markers, and clinical and neuropsychological assessment can be combined to measure the progression of mild cognitive impairment (MCI) and early AD. Details about the ADNI search criteria for this study, resulting in 322 FBP and 198 FBB with 520 matching T1 MRI is found at the top in the supplementary methods. In this study, all subjects were specifically selected as control subjects (AD and MCI were excluded).
We first resampled all PET images to 2×2×2 mm3. Then all T1-weighted MRIs (for both FBP and FBB) were processed using FreeSurfer’s recon-all function,23 resulting in a skull-stripped brain in both native and fsaverage space and cortical labeling using the Desikan-Killiany-Tourville (DKT) atlas.1 PET frames were realigned using brain imaging data structure (BIDS) software PETPrep_HMC (https://github.com/mnoergaard/petprep_hmc) and then registered to the T1 and MNI305 spaces using PETpipelineMATLAB (https://github.com/mnoergaard/petpipelineMATLAB). The four 5-min frames were averaged into a single PET image per participant in MNI305 space,24 and PET voxel intensities normalized to SUVR using the cerebellar cortex as the reference region as defined by FreeSurfer’s left and right cerebellum cortex. At this stage, all the DKT-ROI measures were computed by averaging voxel values in native PET space. After this, processing quality control was applied to the FBP participants and the following participants were excluded: 19 that failed FreeSurfer’s recon-all quality control, 2 that failed PET registration, 1 that had abnormal intensity. This leaves 300 FBP participants.
Subsequently, outliers were identified and excluded based on a spatial correlation analysis. Specifically, for each participant, their spatial data was compared to the group mean. If a participant’s data differed from the group mean by more than 3 standard deviations, that participant was considered an outlier and excluded from the analysis, leaving 296 FBP participants for the remainder of the study.
For the remaining 198 FBB participants, processing quality control was applied, finding that following participants needed to be excluded: 10 that had abnormal intensities, 7 that failed FreeSurfer recon-all quality control, 5 that failed PET registration, 2 that did not fulfill spatial correlation of 3 standard deviations to mean, 1 that had a DICOM error, leaving 173 FBB participants.
Further on, the 296 FBP and 173 FBB images in MNI305 space are denoted as foundational images for subsequent processing. Initially, an average SUVR map for the FBP group was created by combining all FBP foundational images. Similarly, an average SUVR map for the FBB group was generated using all FBB foundational images.
Furthermore, the foundational images derived from FBP will be categorized into groups A and B to construct the NeuroMark FBP template. Given that both FBP and FBB share numerous characteristics, including the common targeting of Aβ, the NeuroMark template, though originally developed using FBP, will be applied to FBB.
Independent component analysis (ICA)
ICA, written as X = AS, is a blind source separation algorithm. In PET it decomposes the multivariate data matrix X, formed by stacking each subject’s PET image voxels, into a set of statistically independent spatial ICs (sources, S) and their corresponding subject-specific weights (loadings, A). If a model order of C is chosen, ICA returns C ICs. The spatial ICs (each the same dimensions as a single PET volume) are collected into the S-matrix, and all loading values into the A-matrix, yielding the familiar linear model seen in equation 1. ICA finds S and A so that the spatial ICs in S are maximally independent from each other, while each spatial IC may still capture overlapping patterns shared across subjects.
\[\mathbf{X}_{N \times V} = \mathbf{A}_{N \times C}\mathbf{S}_{C \times V} + \varepsilon \tag{1}\]
, where X is the original PET data matrix for N subjects and V voxels. A is the mixing matrix, where each element in A is a loading coefficient, C is the model order (number of components). S is the source signal, containing C spatial components, and ε denotes the residual error.
For PET imaging, it is also important to understand the linear relationship between SUVR and the ICA loading values, as well as the impact of SUVR on the independent spatial components (or networks) of ICA. Equations 1 through 4 demonstrate that the spatial ICA components remain invariant to SUVR scaling. Equation 1 represents the linear mixing model before SUVR, which can be conceptualized as a scaled version of the original PET signal (X) for each subject. Denoting the SUVR scaled signal as we can write = BX, where B is a diagonal scaling matrix with subject-specific weights on the diagonal, represented as:
\[B_{N \times N} = \begin{bmatrix} b_{1} & 0 & \cdots & 0 \\ 0 & b_{2} & \cdots & 0 \\ \vdots & \vdots & \ddots & \vdots \\ 0 & 0 & \cdots & b_{N} \end{bmatrix}\]
Substituting X with in equation 1 yields equation 2:
\[\begin{aligned} \widehat{\mathbf{X}} &= \mathbf{B}_{N \times N}\mathbf{X}_{N \times V}\\ & = \mathbf{B}_{N \times N}\mathbf{A}_{\mathbf{N \times C}}\mathbf{S}_{C \times V}\\ & = \left( \mathbf{B}_{N \times N}\mathbf{A}_{\mathbf{N \times C}} \right)\mathbf{S}_{\mathbf{C \times V}}\\ & = \widehat{\mathbf{A}}\mathbf{S}_{C \times V} \end{aligned}\tag{2}\]
Factoring out the mixing matrix and the scaling parameter in equation 2, results in equation 3:
\[\small{\begin{aligned} \left( \mathbf{B}_{N \times N}\mathbf{A}_{N \times C} \right) &= \begin{bmatrix} b_{1} & 0 & \cdots & 0 \\ 0 & b_{2} & \cdots & 0 \\ \vdots & \vdots & \ddots & \vdots \\ 0 & 0 & \cdots & b_{N} \end{bmatrix}\begin{bmatrix} A_{11} & \cdots & A_{1C} \\ A_{21} & \cdots & A_{2C} \\ \vdots & \vdots & \vdots \\ A_{N1} & \cdots & A_{NC} \end{bmatrix}\\ & = \begin{bmatrix} {b_{1}A}_{11} & \cdots & b_{1}A_{1C} \\ {b_{2}A}_{21} & \cdots & {b_{2}A}_{2C} \\ \vdots & \vdots & \vdots \\ {b_{N}A}_{N1} & \cdots & {b_{N}A}_{NC} \end{bmatrix}\\ & = \begin{bmatrix} {b_{1}A}_{1} \\ {b_{2}A}_{2} \\ \vdots \\ {b_{N}A}_{N} \end{bmatrix} \end{aligned}}\tag{3}\]
Finally, equation 2 can be simplified further into equation 4:
\[\begin{aligned} \widehat{\mathbf{X}} &= \mathbf{B}_{N \times N}\mathbf{X}_{N \times V}\\ & = \mathbf{B}_{N \times N}\mathbf{A}_{N \times C}\mathbf{S}_{C \times V}\\ & = \left( \mathbf{B}_{N \times N}\mathbf{A}_{N \times C} \right)\mathbf{S}_{C \times V}\\ & = \begin{bmatrix} {b_{1}A}_{1} \\ {b_{2}A}_{2} \\ \vdots \\ {b_{N}A}_{N} \end{bmatrix}\mathbf{S}_{C \times V} \end{aligned}\tag{4}\]
From Equations (1) through (4), we see that the source maps (S) are invariant to scaling, meaning SUVR scaling only affects the mixing matrix (A). Consequently, SUVR scaling can be applied to the loading parameters post-ICA without recomputing the components. This allows for evaluating the impact of calibration (scaling) on the results without needing to re-estimate the source components. In this study, we normalize the mixing matrix (A) according to each subject’s SUVR values to ensure consistency in the analysis.
NeuroMark extends this basic ICA approach by introducing a standardized, two-step pipeline: 1) Generate a reproducible spatial template (consisting of ICs) by performing group-level ICA on a large, pooled sample, selecting a model order (C in equations above). An expert will inspect the components, making sure the template excludes artifacts and other unwanted components. The template is only created once and may be used by other research groups, including in computer clusters processing very large datasets. 2) Users may then apply that template consistently across new PET datasets in order to extract subject-specific loading values for each component in the template. In essence, NeuroMark replaces a purely data-driven, one-time ICA on each cohort with a reference-based ICA that ensures spatial correspondence of components across studies.
After NeuroMark has processed each dataset, each participant has a standardized loading value for each component in the template. These loading values can then be applied for statistical methods such as a two-sample t-test, regression, and many others.
NeuroMark Pipeline: Creating the FBP template via ICA
An overview of our approach is shown in Figure 1. For the ICA processing, both FBP and FBB foundational images were smoothed using a 10 mm Gaussian kernel. Then, FBP data were split into two independent groups A and B, according to the first two rows in Table 1.
_depicts_the_exclusions_(highlighted_in_red)_before__during_and_after_pet_prep_processin.png)
Spatial group ICA, using the Infomax ICA algorithm,25 was run independently on groups A and B, using GIFT12,19 (http://trendscenter.org/software/gift). Important ICA parameters were a model order of 40 and no scaling of components. The 40 ICs from group A were spatially correlated with ICs from group B, and IC-pairs with a correlation below 0.4 were excluded in accordance with previous literature,16 thereby establishing replication-based component validation. Pairing spatial networks across datasets using a spatial correlation threshold above 0.4 is already more stringent than common practice in the field, where thresholds as low as 0.25 have been used to identify corresponding components as seen in previous literature.26 In addition to this quantitative criterion, we also performed visual inspections of each component pair to ensure that the matched spatial ICs truly represented the same underlying network.
The remaining ICs represent different types of networks that were manually inspected. ICs matching WM may be networks showing the unwanted unspecific binding to myelin basic protein, which we exclude. ICA derived networks may also represent artificial components (typically showing high values at the edges of the brain), which were further removed. Networks representing the ventricles may not be useful and were removed as well. Finally, the correlated IC pairs that remained were averaged, each creating an Aβ network (AβN) that is one part of the NeuroMark FBP template, enabling amyloid-informed constrained ICA.
In addition, we computed the participant specific loading values (explained in equation 1), similarly scaled for all nA+B participants using the NeuroMark FBP template and constrained ICA on the FBP participants (nA+B). These loading values correspond to the degree to which a given component is expressed in a given participant.
Evaluating the relationship between amyloid and age: Anatomical ROIs versus multivariate amyloid beta networks
After preprocessing, FBB and FBP SUVR values were calculated for anatomical ROIs in native space, using the FreeSurfer DKT atlas. In comparison, for ICA, we used MOO-ICAR together with the FBP template to calculate the loading values for each NeuroMark AβN. Next, regression analyses between age and DKT ROI SUVR, on the one hand, and between age and AβN loading values, on the other, were computed using the simple linear regression. The regression results were then compared between DKT ROIs and NeuroMark AβNs. Significant associations are reported after false discovery rate correction (FDR; q<0.05).
Amyloid deposition in florbetaben
A study from 2021 by Landau et al. measured continuous amyloid burden values, which could be used to classify participants as amyloid positive (Aβ+) or amyloid negative (Aβ-). These classifications were applied for the same FBB participants that were used in this ADNI study, and the methods are available online (https://preview.tinyurl.com/53r4jdmc). In brief:
-
The native-space MRI scan closest to each PET is segmented and parcellated with Freesurfer v7.1.1 to define a cortical summary region that is made up of frontal, anterior/posterior cingulate, lateral parietal, and lateral temporal regions.
-
Five reference regions were defined (cerebellar grey matter, whole cerebellum, brainstem/pons, eroded subcortical white matter, and a composite reference region made up of whole cerebellum, brainstem/pons, and eroded subcortical WM).
-
Each FBB scan was co-registered to the MRI closest in time and then the mean florbetaben uptake was calculated within the cortical and reference regions, yielding the continuous amyloid burden values.
-
The positivity threshold for FBB was a continuous amyloid burden of ≥ 1.08, which classified participants as Aβ+. Remaining participants were classified as Aβ-.
Results
Multivariate independent components and maps
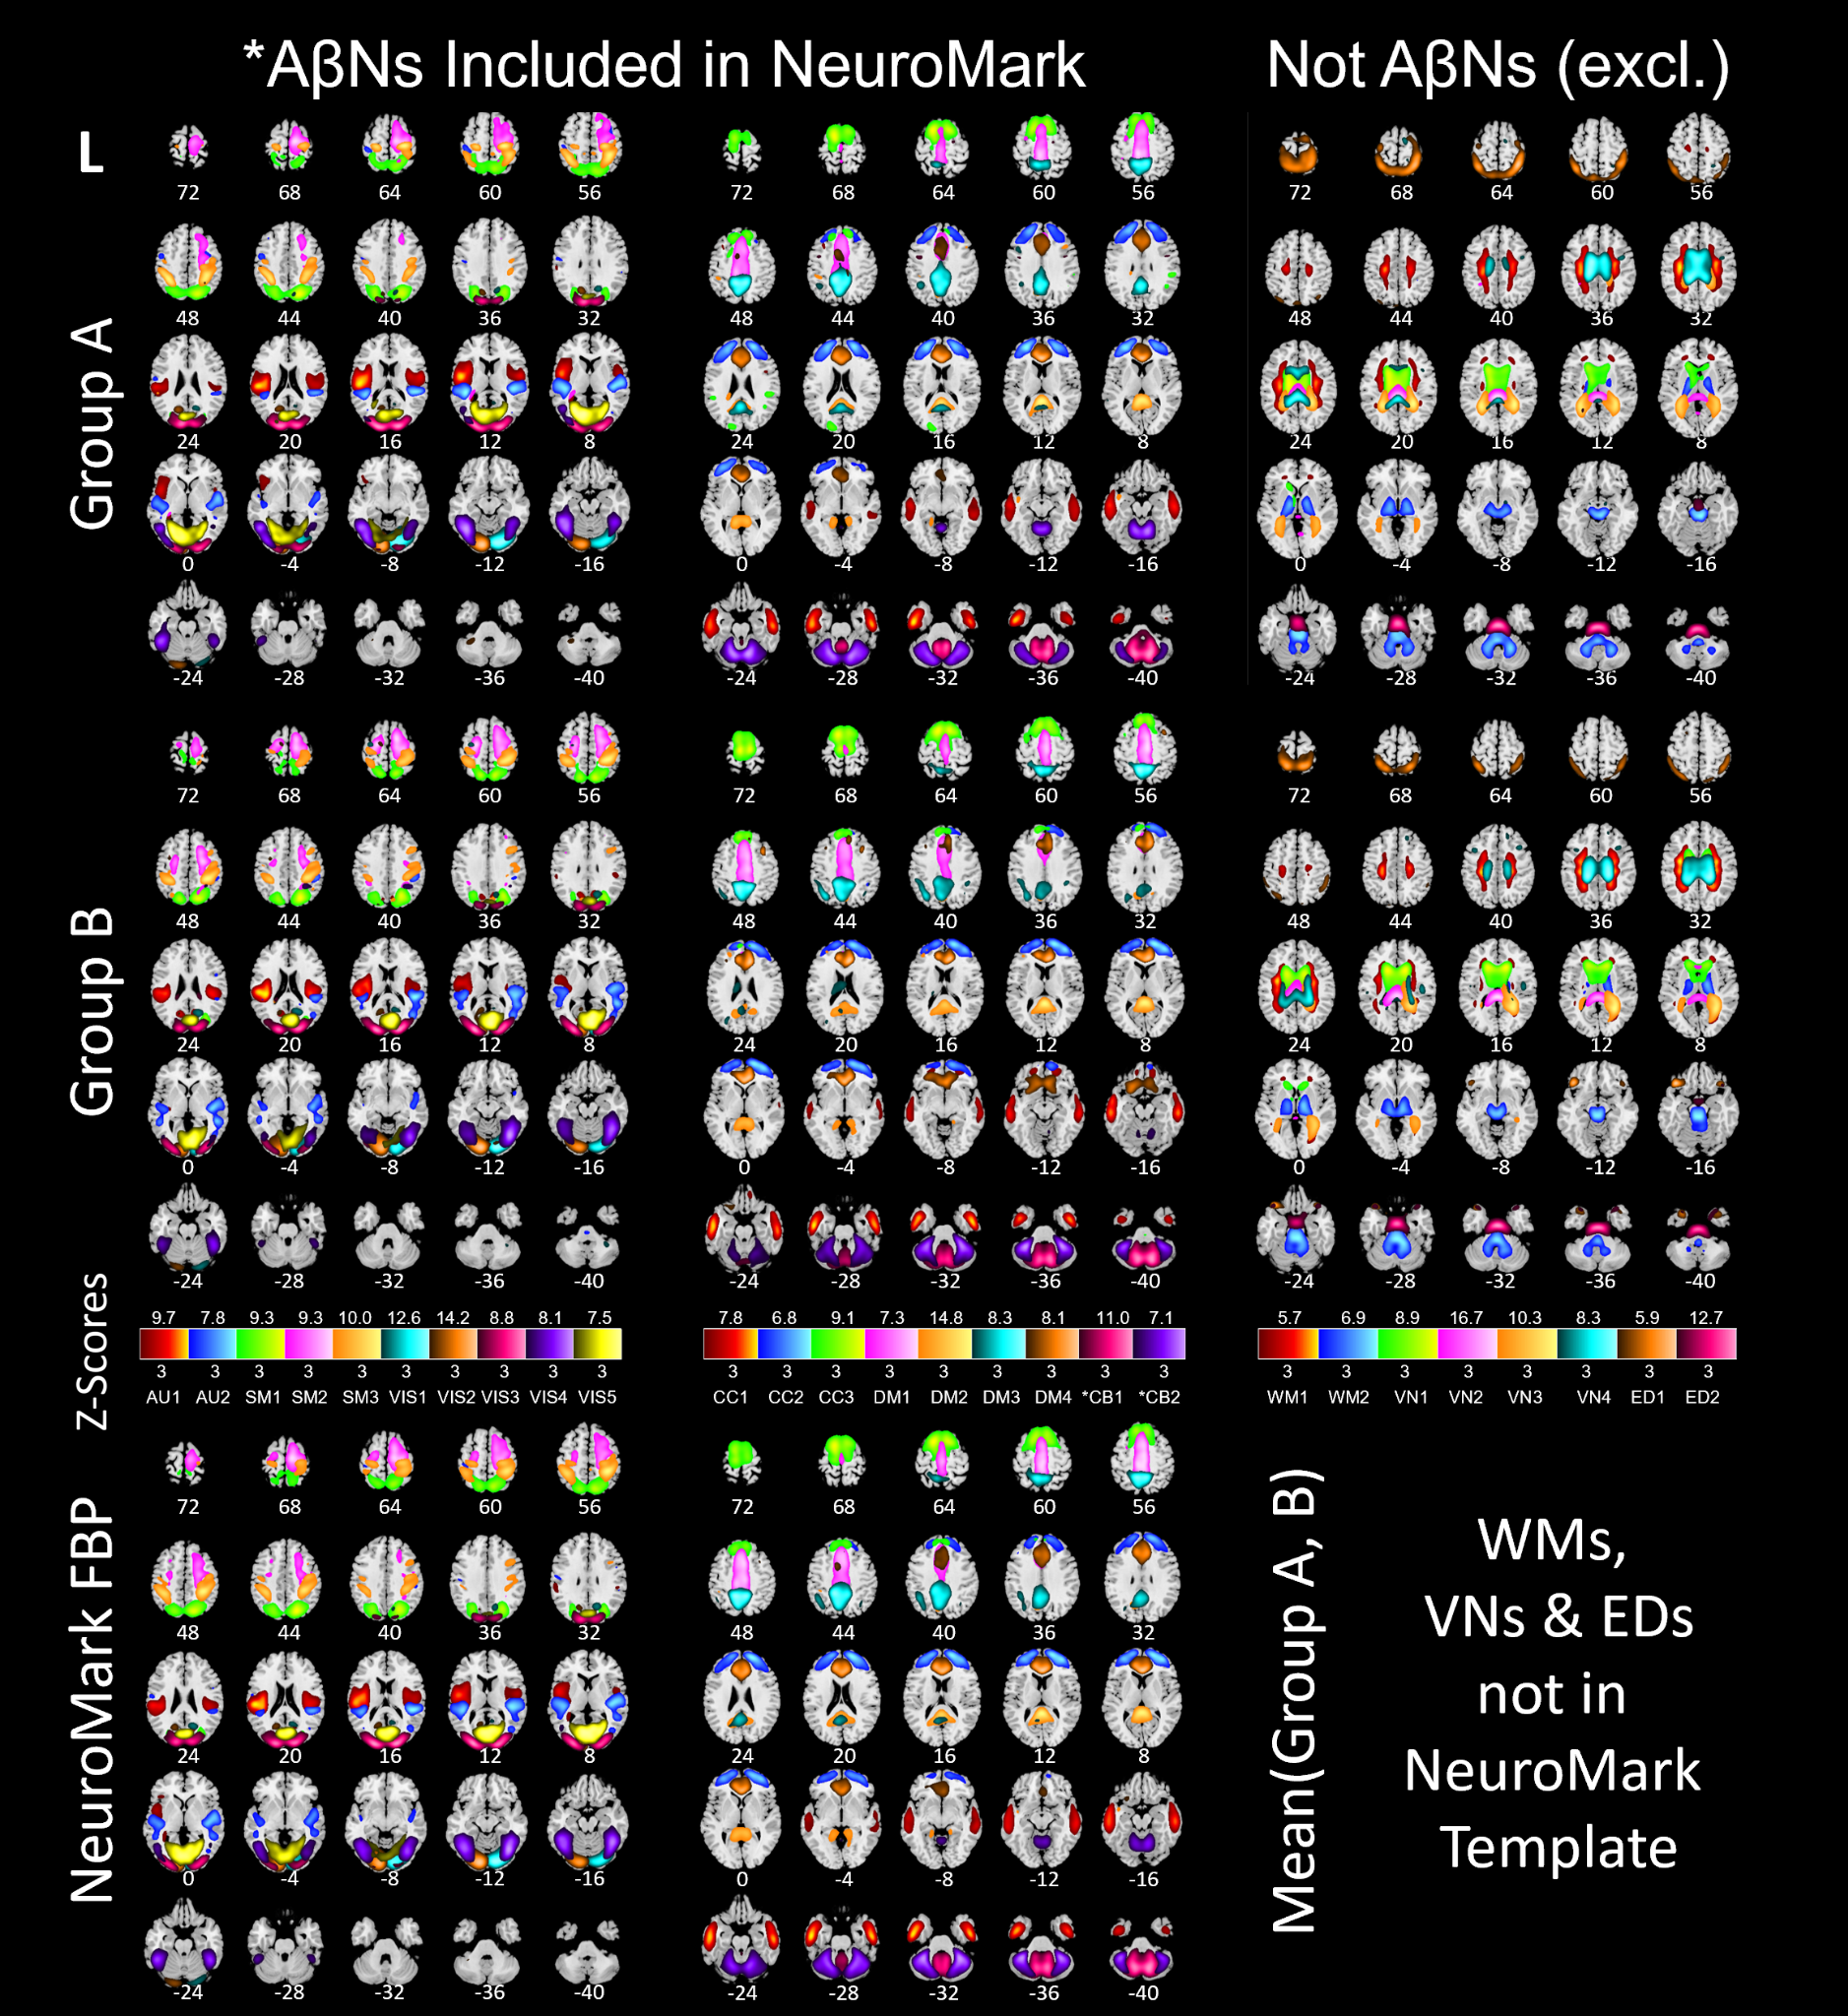
The ICA processing, starting with 40 paired ICs across groups A and B, resulted in a NeuroMark template with 17 AβNs (https://trendscenter.org/data or https://doi.org/10.5281/zenodo.16617800). Excluded components were: 13 paired components that had lower correlation than 0.4, 4 networks that were ventricular, 2 networks that were WM-related, 2 networks that represented edge artifacts, and 2 cerebellar networks that were related with the reference region, resulting in 23 exclusions. In Figure 2, the first row depicts networks from group A and the second row depicts networks from group B. The 17 NeuroMark AβNs are depicted in Figure 2 at the bottom row. Excluded networks with spatial correlation above 0.4 are displayed in the third column of Figure 2.
_an.png)
To identify the anatomical DKT region corresponding to each NeuroMark FBP IC, we matched each component to the DKT region containing the highest intensity voxel values for that IC (Table 2).
Univariate molecular imaging brain atlases of florbetaben and florbetapir
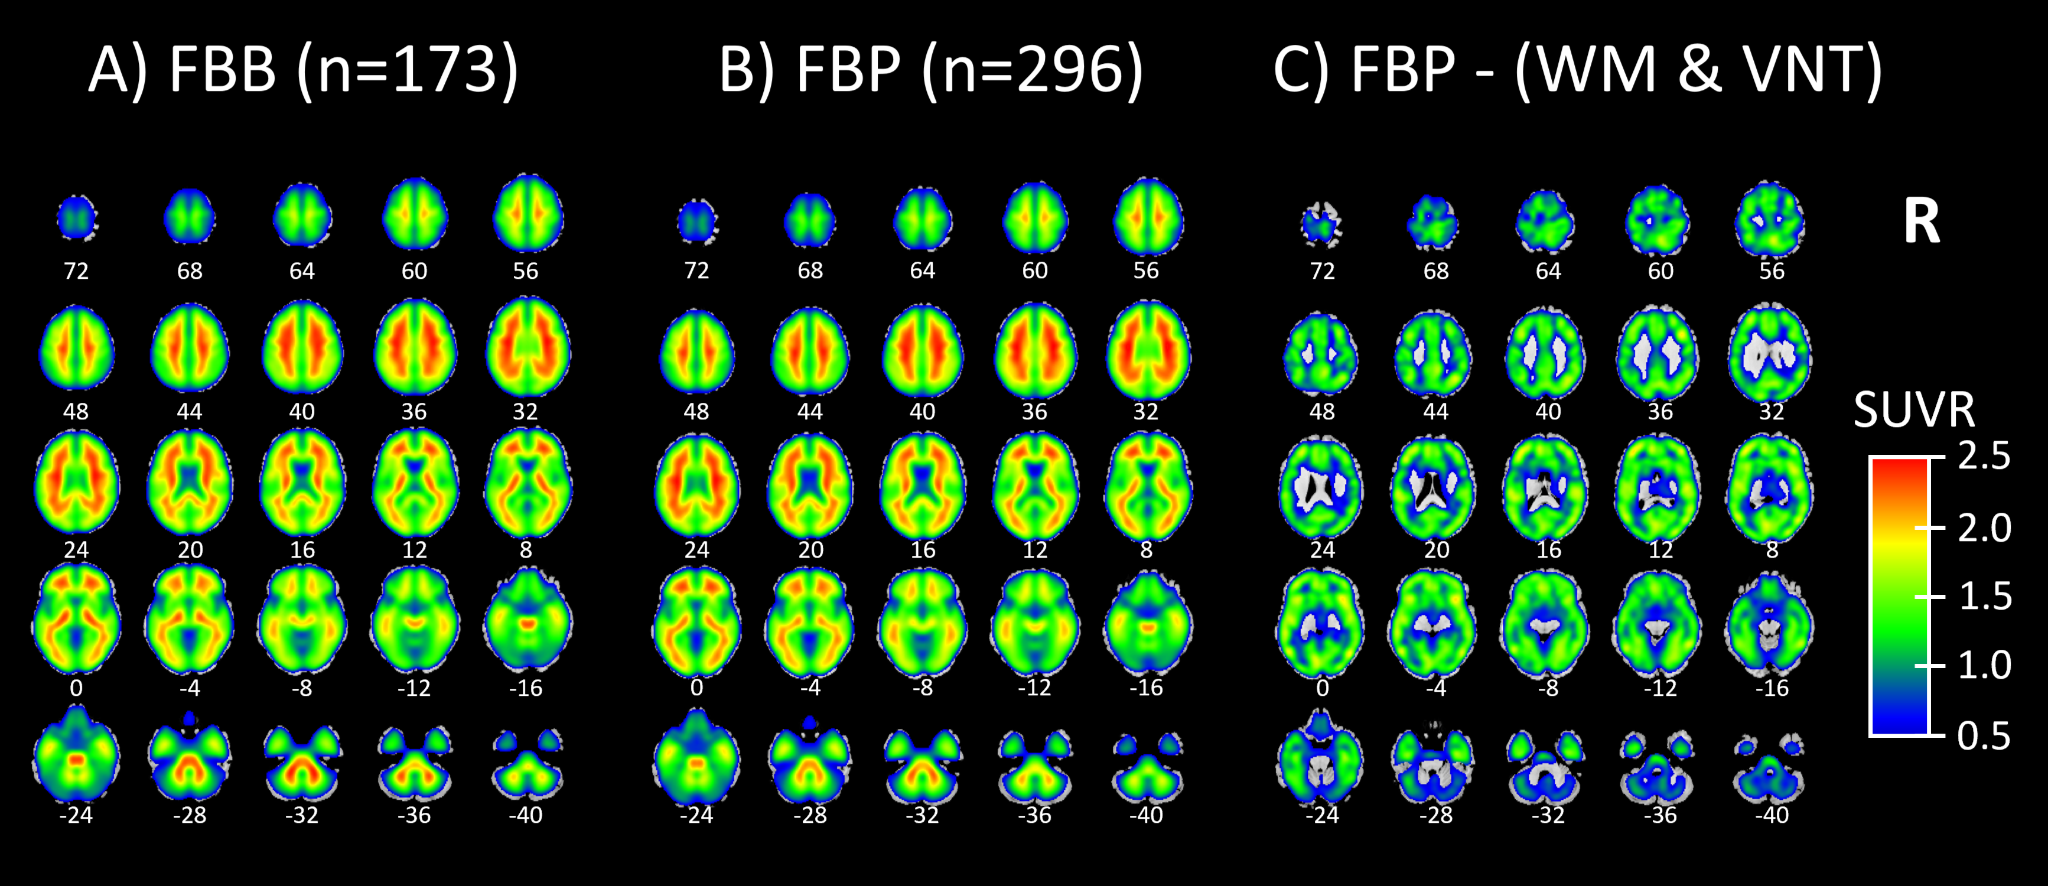
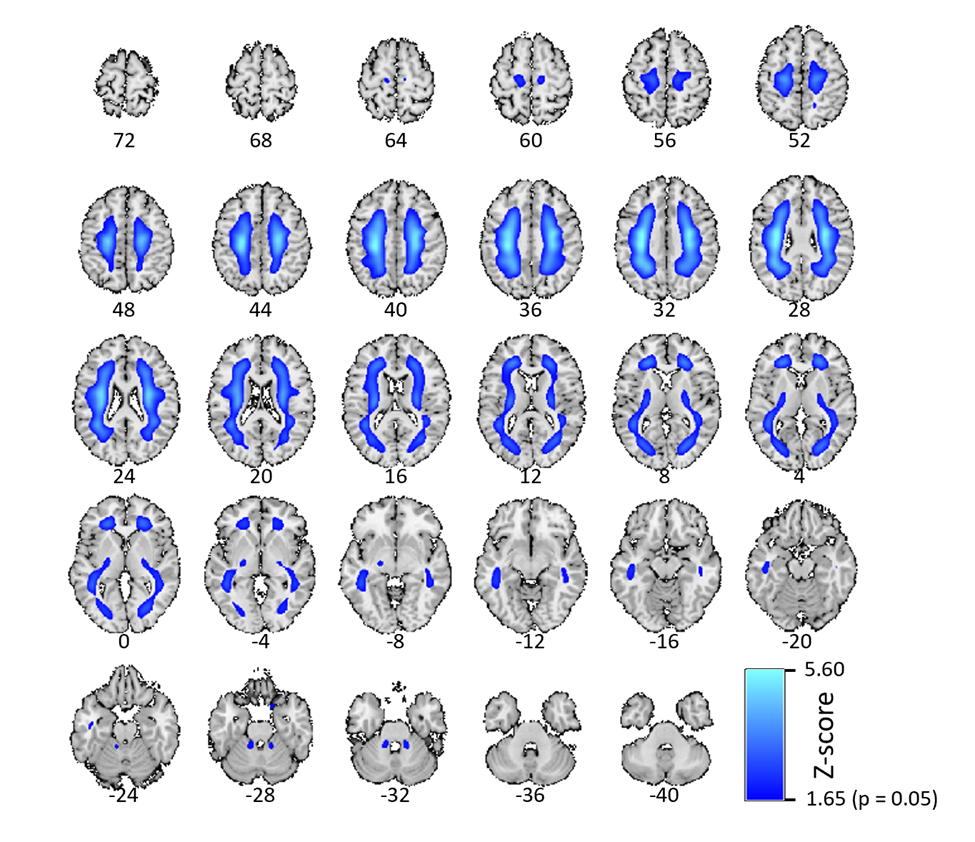
Next, we show an example of a Molecular Image Brain Atlas (MIBA) average from the 296 FBP subjects (Figure 3B). As expected from the literature, WM has higher binding intensities than GM, at least for FBP.27 This non-specific binding corresponded to two very reliable components for cortical and cerebellar WM (r=0.81 for WM1 and 0.71 for WM2). Using multiple linear regression, we estimated the weights of all 40 ICs to model the group average SUVR FBP PET. By applying these weights, we selectively subtracted the two WM and the four ventricular ICs from the group average SUVR FBP PET, revealing that the remaining SUVR is in the GM (Figure 3C). Figure 3A depicts that the average FBB MIBA is very similar to the average FBP MIBA (Figure 3B), supporting the use of FBB as test data even when the AβNs were created using FBP data.
_molecular_image_brain_atlas_(miba)_average_from_173_florbetaben_participants._b)_miba_a.png)
Regression of age with tracer uptake
In this study, all subjects’ SUVR and AβNs loading values from DKT ROIs were regressed with the subjects’ ages, yielding standardized β and p-values. The standardized β value and the FDR corrected p-value for each AβN regression are found in Table 2 and for the DKT ROI regressions in Table S1. The results shown in Table S1 show that binding in ventricles/CSF was negatively associated with age for both FBB and FBP. In addition, in FBP, but not in FBB, the WM had a negative association between age and SUVR. Even if WM does not have a negative age-association for FBB, there may still be a strong uptake, seen in Figure 3A, which may be unspecific to Aβ. Therefore, regions in which SUVR decreases with age may be related to WM degradation or enlarged ventricles, suggesting potential off-target interactions or non-specific binding. Due to these off-target interactions and their confounding nature, both DKR-ROIs and AβNs that show negative associations between age and SUVR or loading values were excluded from further quantitative analyses. The negative age association exclusions are seen as x-neg in the q-columns in Table 2 and in the “q FBP” column in Table S1. This includes the AβNs exclusions of CC3 and SM3 for FBB and AU1, SM1, SM3, VIS3, DM2 and DM4 for FBP. In summary, for both the FBB and FBP DKT ROIs, 11 non-GM regions were excluded (skull, air cavities, CSF, and WM, labeled as “x-non-gm” in Table S1) and two reference regions were excluded (labeled as “reference” in Table S1). In addition, for the FBP tracer, 11 regions were excluded due to their negative association with age (labeled as “x-neg” in Table S1), which possibly indicates that WM or CSF is encroaching into the GM ROI (i.e. partial volume effects) or perhaps another non-specific binding effect.
In this study, we associated the average SUVR or loading values with participant ages. To evaluate the anatomical association with age using the DKT atlas, we performed a simple linear regression between the average SUVR within each DKT ROI and the participant’s age. Analogously, for the NeuroMark AβNs, we regressed the AβNs’ loading values against age. Since we use the simple linear regression for all regressions with age, all standardized betas are identical with the Pearson correlation. Since the ages are the same for the DKT ROIs and the AβNs, the corresponding standardized beta values are the same as correlations, which are unbiased between the DKT ROIs (Table S1) and the AβNs (Table 2). In addition, the p-values from the simple linear regression are identical with Pearsons’s correlation p-values in this case.
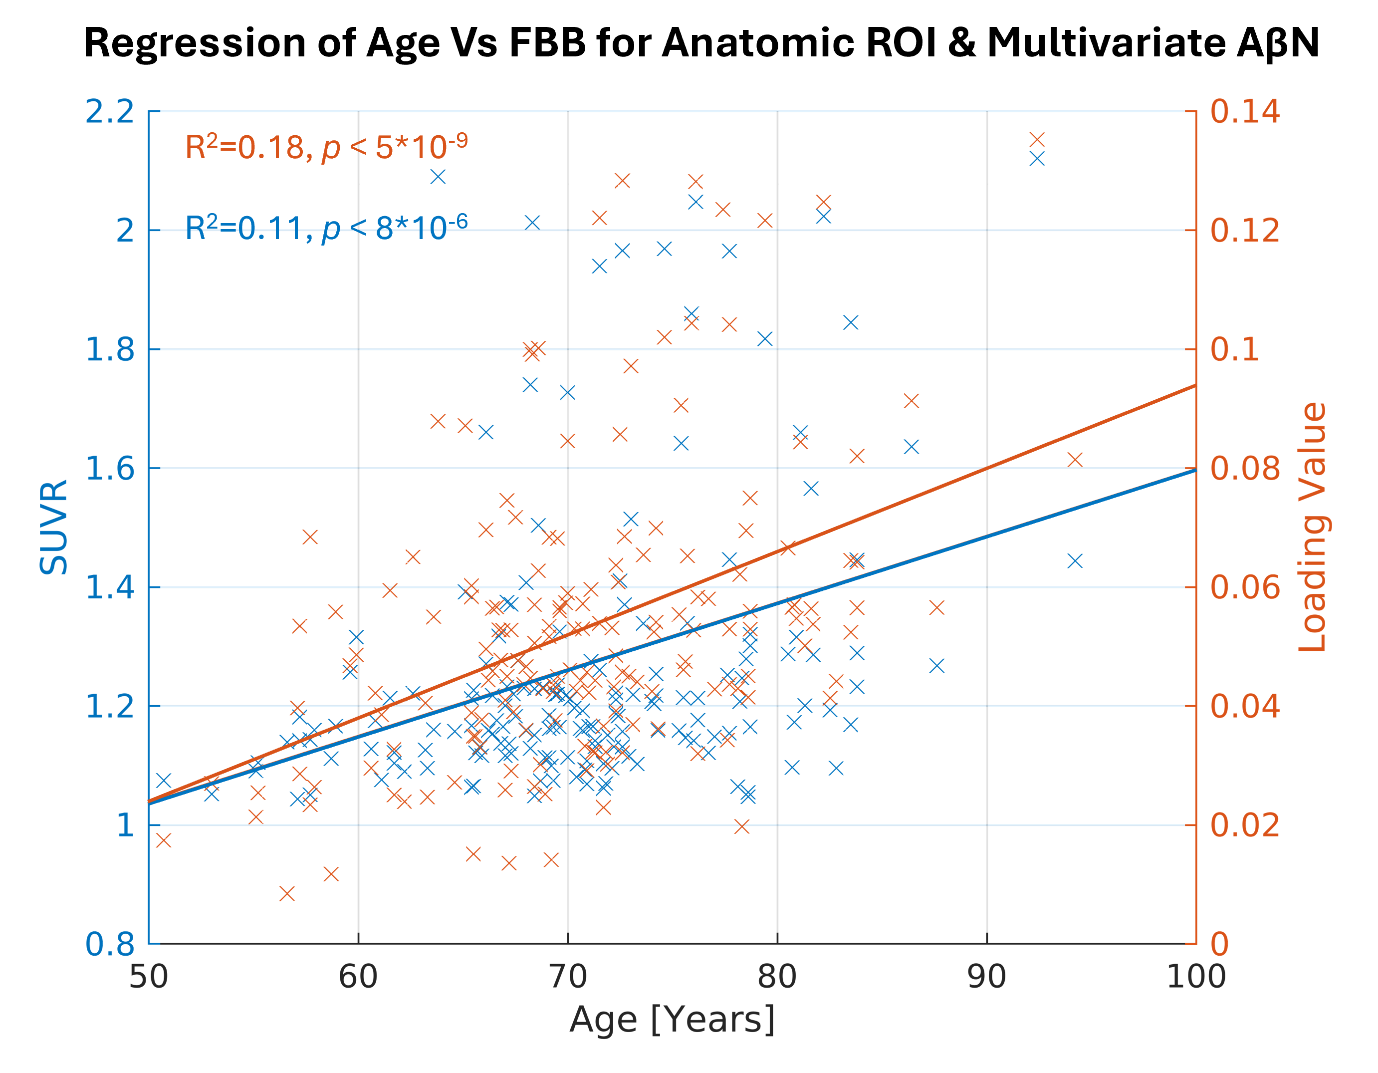
Here, we highlight the most significant age association for the DKT ROI using the FBB tracer, which is in the right inferior temporal cortex (Figure 4, depicted in blue, R2=0.11, p < 0.001, uncorrected). Similarly, for the NeuroMark AβNs, we regressed the AβNs’ loading values against age. The strongest component association was observed in the CC1 AβN, which has its peak in the medial temporal cortex (Figure 4, depicted in orange, R2=0.18, p < 0.001, uncorrected).

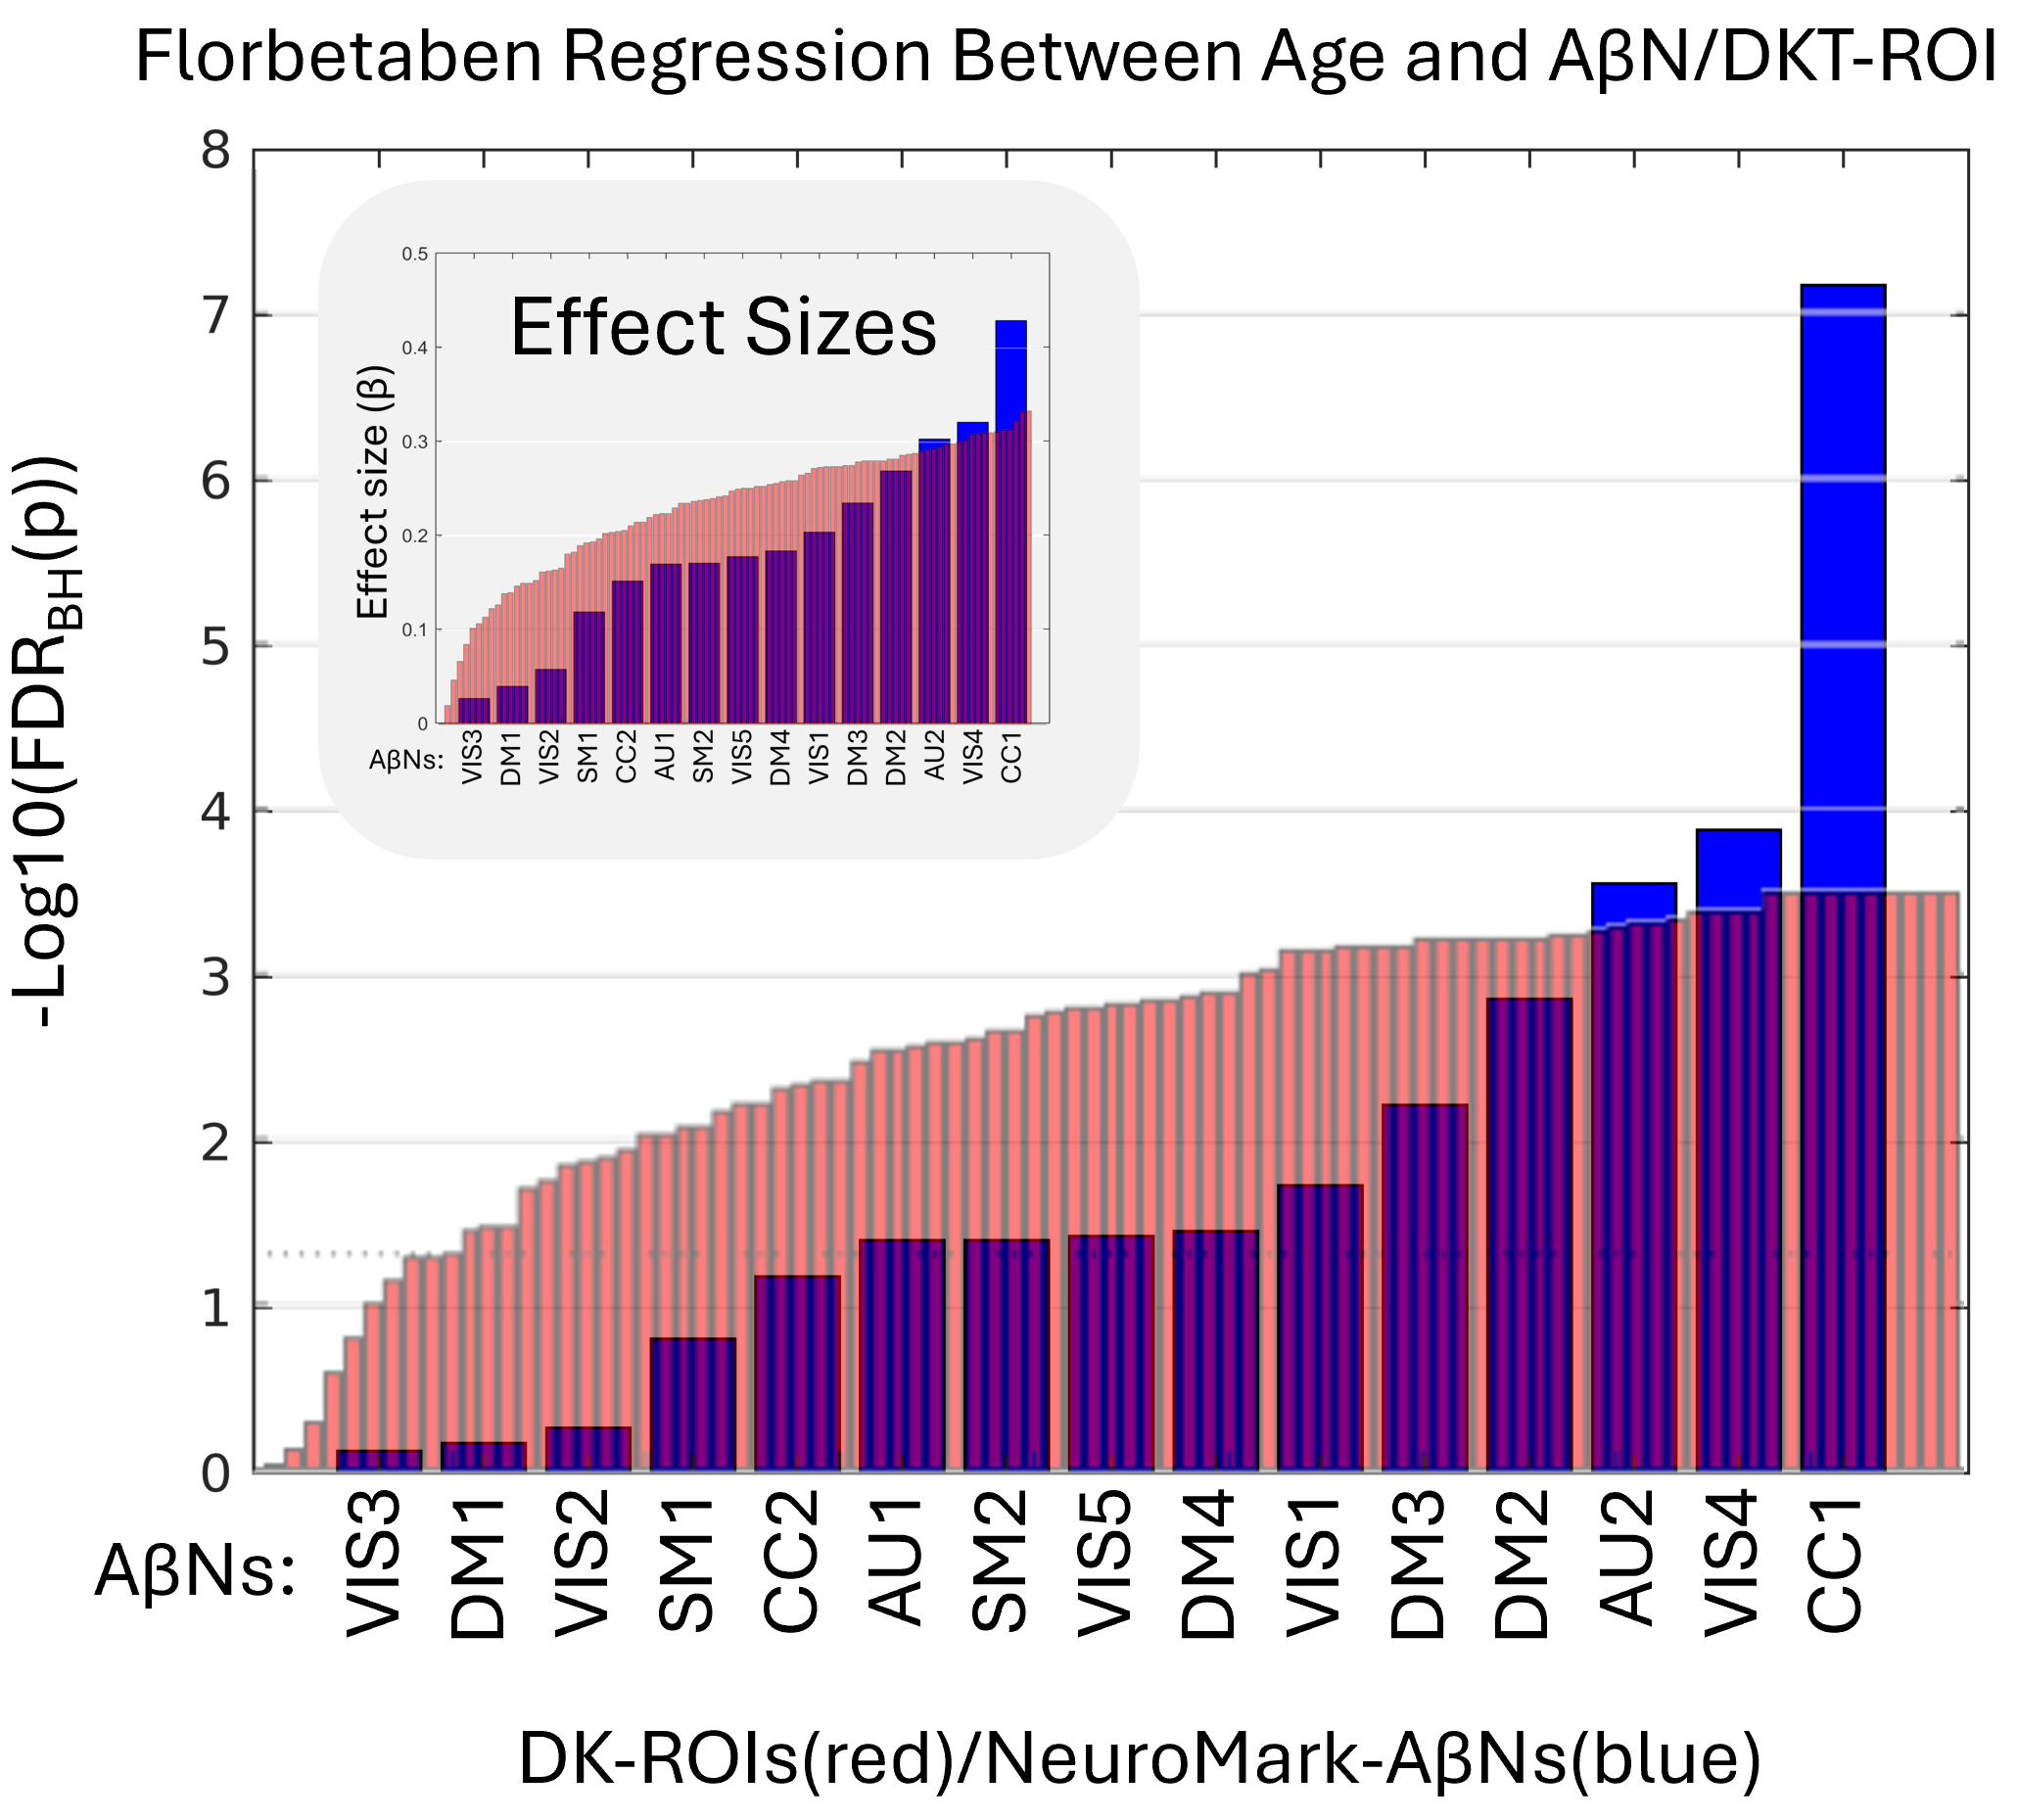
In the remaining part of the results, we explore the age association significance for both AβNs and DKT ROIs. In addition, we used the FDR corrected p-values (q-values) and sort the AβNs and DKT ROIs by age association significance (Figure 5). Because the number of tests is considerably lower for NeuroMark AβNs compared to DKT ROIs, the FDR adjustment might be less strict for AβNs, thereby aiding the detection of significant outcomes. As a result, this facilitates the comparison of binding associations with age for either ROIs or AβNs. As shown in Figure 5, the age association trajectories are different between the AβNs and the DKT ROIs. The AβNs are decomposed into fewer parts than the DKT ROIs (15 AβNs < 87 ROIs). Interestingly, the age association significance is distributed so that more than 88% of ROIs (77 of 87) have significant age associations (q < 0.05). Conversely, less than 67% (10 of 15) of the AβNs had significant associations with age. However, the top age-associated AβN contenders appear to show much greater increases and may even have larger effect sizes (e.g., βCC1 = 0.428) than the top DKT ROI contenders (e.g., βInferior_Temporal_Gyrus = 0.333).
_after_regressing_173_participan.png)
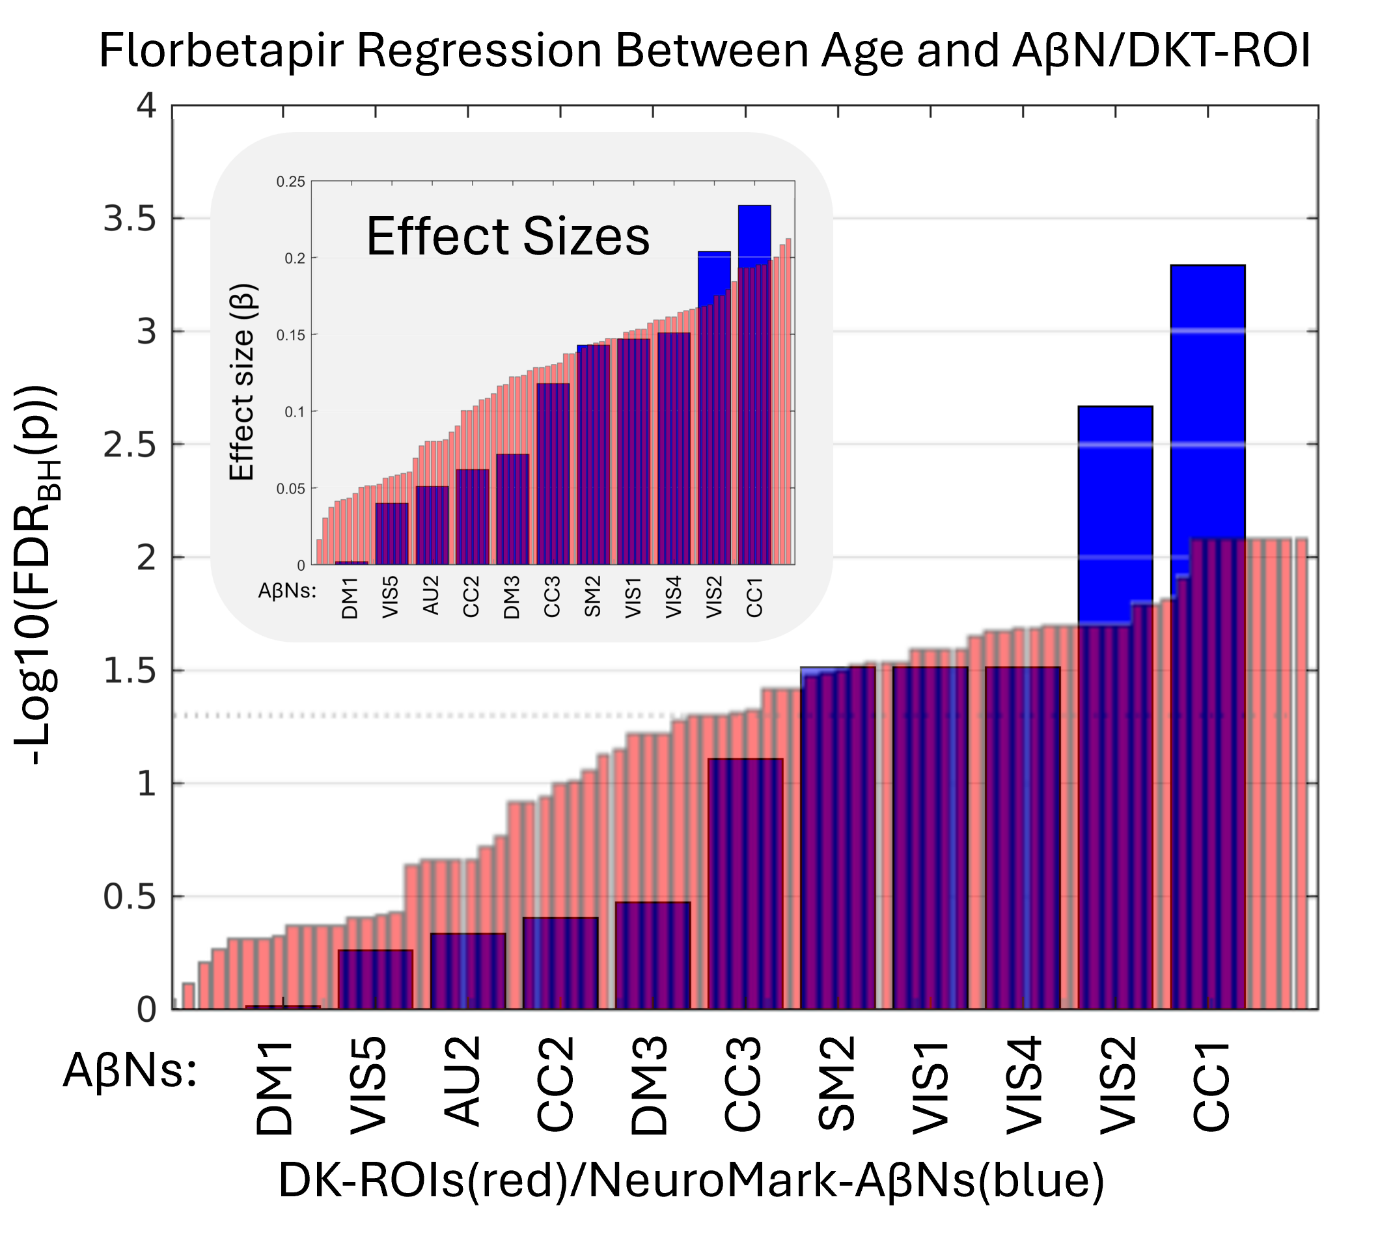
Since we used the 296 FBP participants to create the AβNs in our NeuroMark template, even though the method is unsupervised and blind, we were careful to use its resulting loading values. Here, we aim to confirm that the components capture similar age association patterns to those observed in the FBB results. In addition, we explored if the relationship between age and AβN loading was consistent across these different age groups and tracer types (76.0 years for FBP and 70.8 years for FBB). All the q-values are ranked from lowest to highest, as seen in Figure 6. The CC1 component had the largest effect sizes for both FBP (β = 0.234) and FBB (β = 0.428). Interestingly, the largest effect size was for FBB, even though the NeuroMark AβNs were created from the FBP dataset. In addition, an AβN pattern may have been identified, suggesting consistency across different PET tracers, since out of the 5 significant AβNs in FBP, at least 4 were also significant in FBB (CC1, VIS4, VIS1, and SM2).
_after_regressing_296_participa.png)
For further clarity about our dataset, we desired to quantify the participants’ amyloid deposition. Interestingly, a previous ADNI study by Landau et al. (see methods section), used the same FBB participants as this study and shared their results within the ADNI framework, categorizing participants as either Aβ+ or Aβ-, using the FBB radioligand. Out of our 173 FBB participants, 45 were Aβ+, 124 were Aβ-, and 4 were unknown. This indicates our FBB population was 26-28% Aβ+, depending on the amyloid deposition in the four unknown participants.
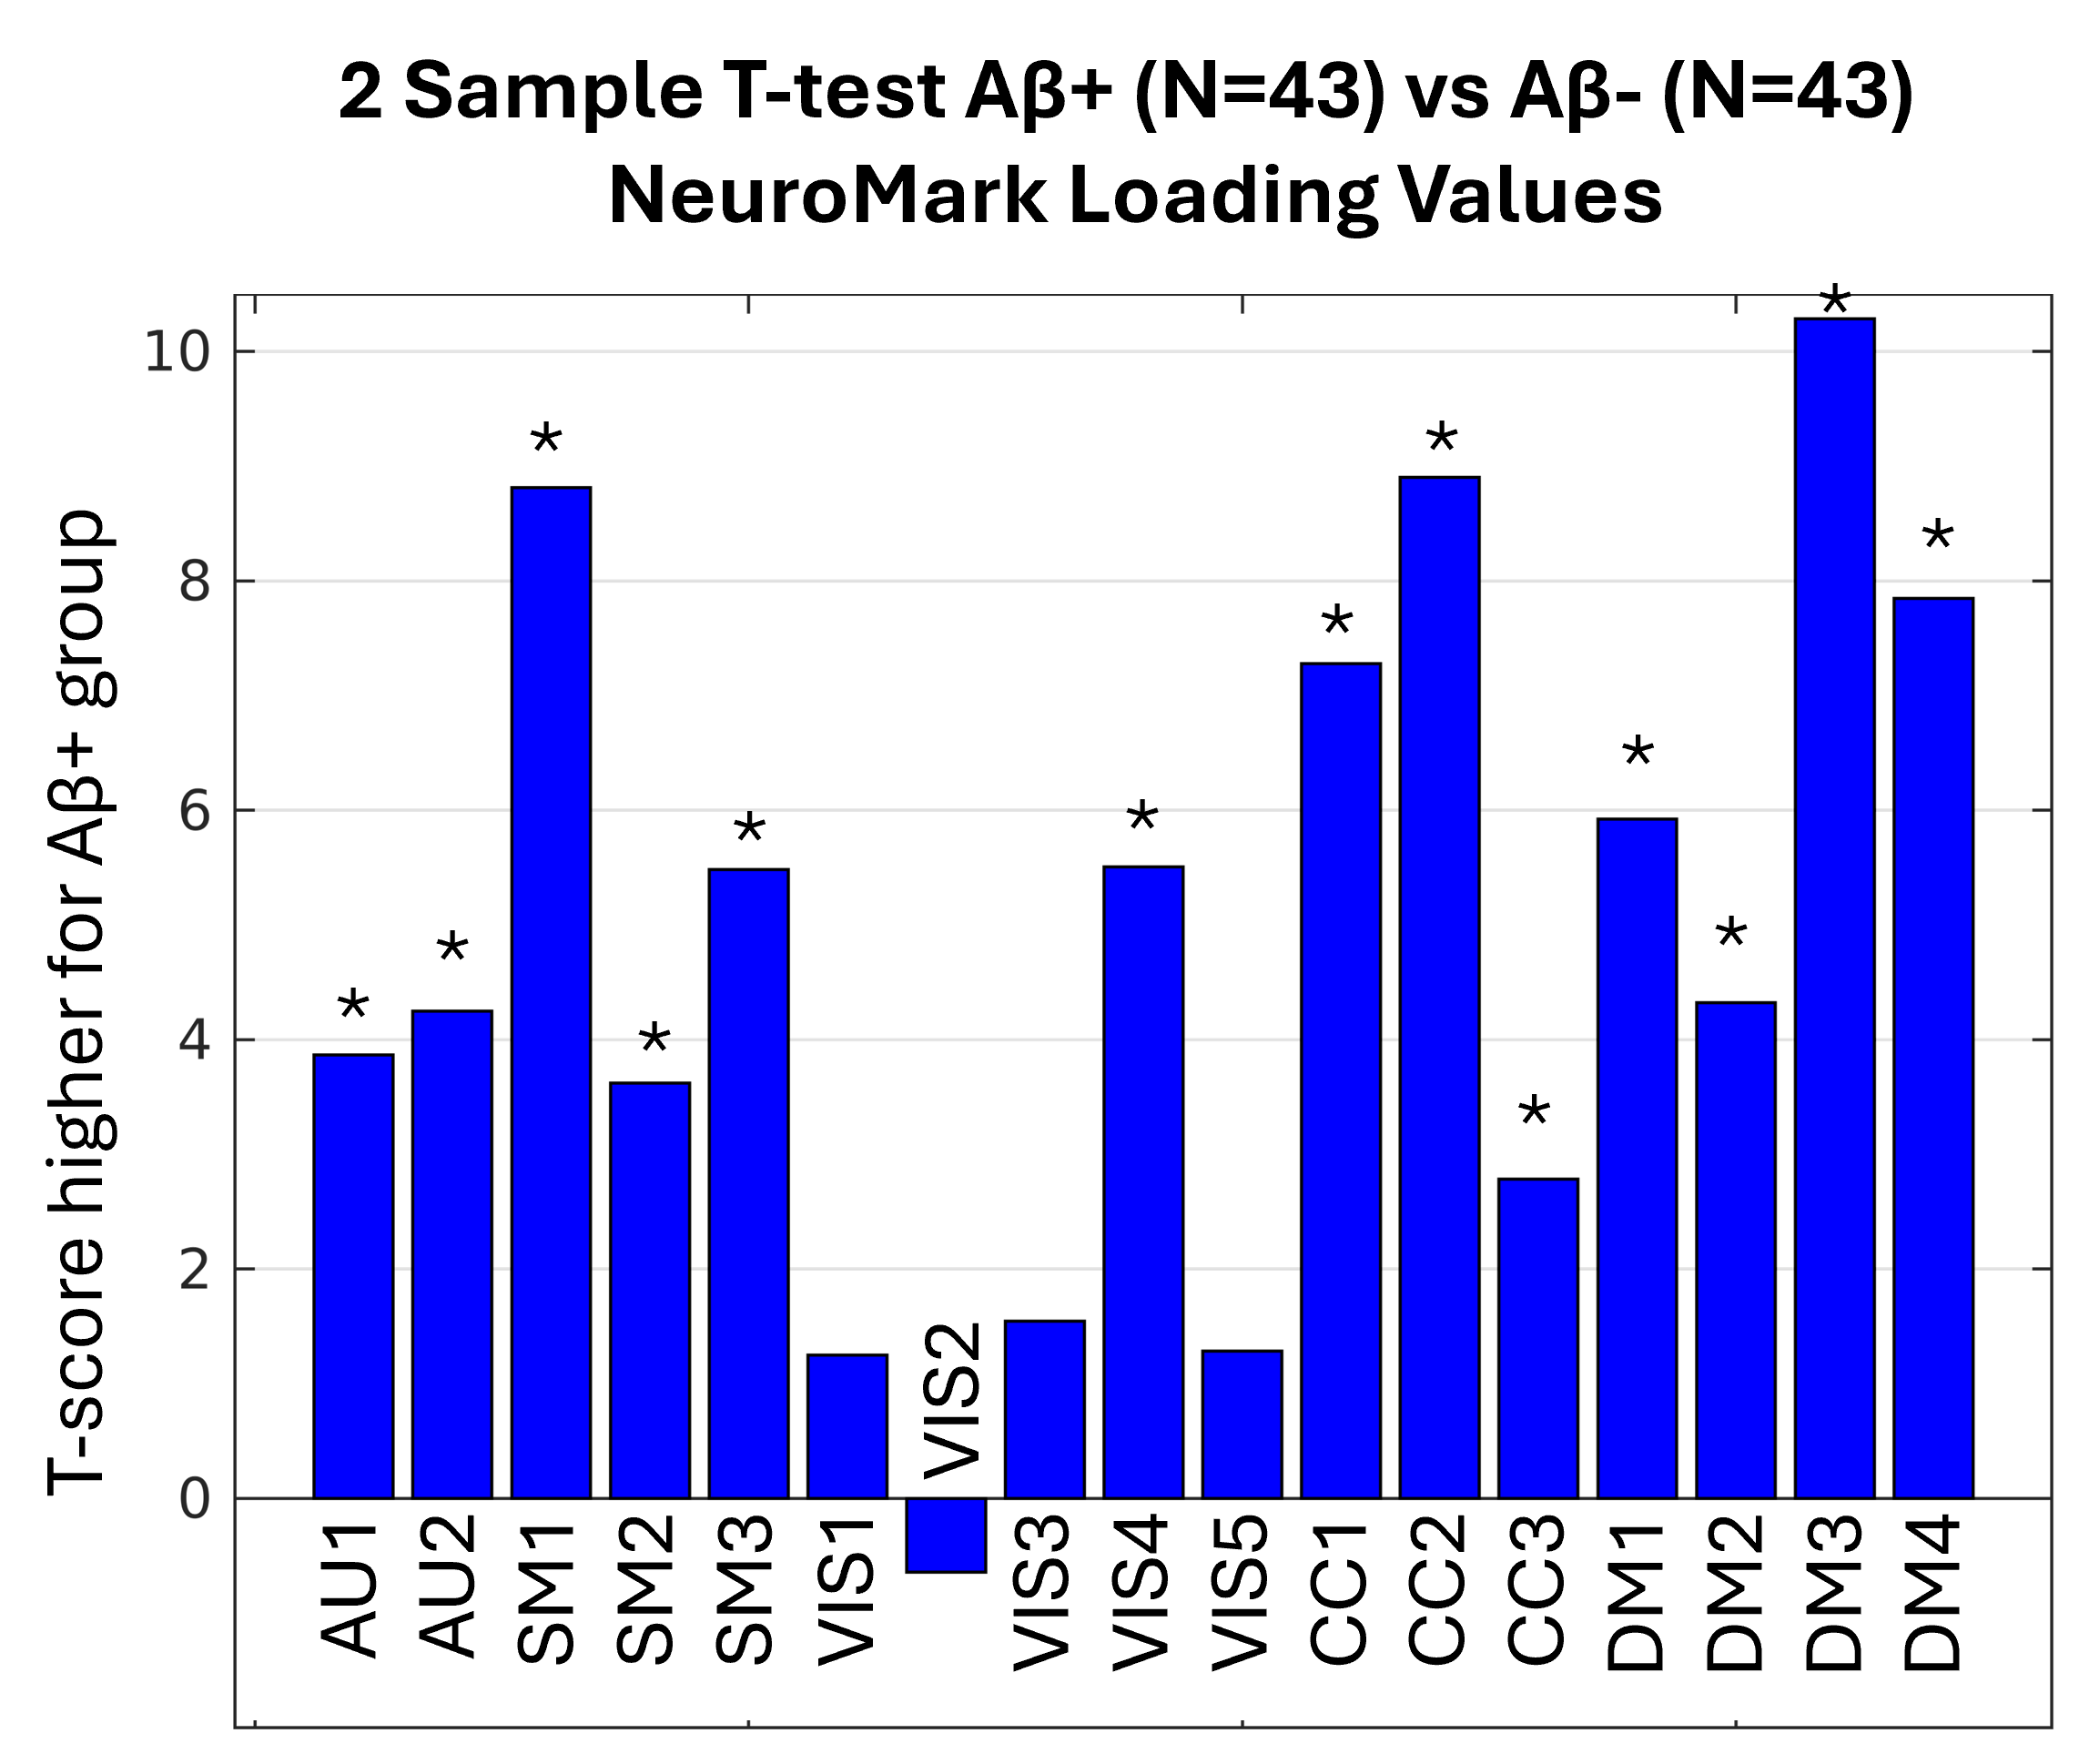
In an effort to explore how well NeuroMark detects Aβ deposition in populations, we decided to reuse the same FBB loading values that were used in Figure 5. Instead of the previous statistic, we performed a two-sample t-test, only reusing the loading values for two groups of subjects (Aβ+ or Aβ-). Since two Aβ+ subjects were significantly older (the youngest was 92.4 years) than the oldest Aβ- subject (87.6 years), we removed the two oldest subjects. Then, for each Aβ+ participant, we used a nearest-neighbor algorithm to match an Aβ- participant closest in age, resulting in the Aβ+ group (N=43, age=72.5 years, SD=6.6 years) and the Aβ- (N=43, age=72.5 years, SD=6.6 years) group. Performing a two-sample t-test of all the loading values for all AβNs across the Aβ+ and Aβ- groups yielded Figure 7, which shows that NeuroMark consistently detects differences in Aβ loads.

The Landau study provided both dichotomous classifications of subjects as Aβ+ or Aβ− and continuous pre-thresholded amyloid burden values. Although the group classifications are derived from the underlying continuous burden values, we conducted a two-sample t-test comparing these continuous values between the Aβ+ and Aβ− groups, which yielded a t-score of 10.1. This serves as a benchmark for evaluating the discriminatory power of the AβNs. Notably, the most significant AβN, corresponding to the DM3 network, achieved a comparable t-score of 10.2, suggesting that the AβNs may serve as a competitive alternative to continuous amyloid burden measures. Interestingly, the DM3 component overlaps substantially with the default mode network, a region previously implicated in amyloid accumulation in older adults. This observation may have some relation with prior literature demonstrating that amyloid deposition in older adults with AD may mirror the default mode network identified in younger individuals.28
Discussion
In this study, we introduce NeuroMark PET, a novel method for computing replicable PET IC templates specifically designed for the FBP tracer. Utilizing the NeuroMark framework, we successfully extended our approach to the FBB tracer, which also targets Aβ pathology, thereby demonstrating the framework’s versatility across different tracers. Our findings indicate that NeuroMark PET can serve as a robust template for subsequent Aβ imaging studies. Additionally, we compared AβNs derived from our method to traditional anatomical atlases. Notably, the AβNs were decomposed into fewer components than anatomical ROIs, suggesting a more streamlined representation of amyloid distribution. Furthermore, the results indicate that AβNs may offer distinct advantages in capturing nuanced amyloid distribution patterns, potentially enhancing the sensitivity and specificity of Aβ detection.
Previous literature on NeuroMark florbetapir Amyloid β Networks and Desikan Killiany Tourville ROIs
To get an impression of where the AβNs are mostly weighted, each AβN’s peak voxel was mapped to the DKT atlas, finding the most relevant DKT ROI for that AβN. Further, up to two more DKT ROIs that were strongly weighted for each AβN were added and estimated qualitatively to characterize each AβN anatomically. These anatomical DKT characteristics of the AβN are listed in Table S2. The identified DKT ROIs have been identified in the literature as being related with mental impairments and various functions. For instance, the CC1 AβN, which is strongly weighted in the inferior temporal cortex (IT, Table S2), potentially has the highest local amyloid-beta/tau interactions and a connectivity profile conducive to accelerating tau propagation.29 Additionally, the IT shows significant increases in AD patients when scanned with AV1451 targeting tau30 and with florbetaben targeting amyloids.31 Interestingly, the DKT ROI with the highest age effect was the right inferior temporal cortex. It is worth noting that the NeuroMark AβNs were all bilateral except from VIS1, which was dominant in the right hemisphere, and VIS2, which was dominant in the left hemisphere. In addition, using the PET tau radioligand, Periera et al.11 found three unilateral out of ten ICs, with two being very similar to the VIS1 and VIS2. Other components were similar between our studies as well. A more comprehensive overview of the primary anatomical locations and their functional roles within the DKT framework, offering an improved understanding of how AβNs interact with specific DKT ROIs, is found in Supplementary Table S2 and under section “Supplementary Literature of NeuroMark Amyloid β Networks & DKT Anatomy.”
Automation and advantages of the NeuroMark PET Pipeline
The NeuroMark PET Pipeline can effectively eliminate the need for model order selection and component identification procedures, while allowing for data-driven approaches to retain more individualized variability. One important difference between the ICs included in the NeuroMark framework and components from many other ICA studies is that NeuroMark only includes components that have already been replicated twice (from group A and B), using the high spatial correlation of 0.4 (or higher16) between the two groups (being a type of replication-based component validation). By utilizing a NeuroMark template as a spatial prior, we ensure the correspondence of extracted functional network features across diverse analyses, studies, and datasets, thereby facilitating the generation of reproducible findings and enhancing the reliability and robustness of neuroimaging research.
Given that NeuroMark is a robust and fully automated framework that continuously offers reliable templates for multiple modalities, unexplored multimodal areas could present valuable opportunities for future research. The NeuroMark FBP template is a novel development as it establishes a reliable foundation extended to PET modalities, facilitating multimodal analyses in an automated fashion. The ICA approach employed in NeuroMark enables the identification of independent networks with co-varied voxels across participants and also helps to separate out artifacts and partial volume effects. Notably, traditional ROI-based approaches rely on predefined, fixed brain regions across subjects and scans, which may therefore overlook variations in the alignment of ROIs with underlying chemo-architectural boundaries. In contrast, the data-driven NeuroMark approach offers a flexible alternative that accurately reflects the intrinsic brain architecture according to individual scans, making extracted PET outputs more reliable and accessible to non-experts, such as researchers from other fields, including clinicians. Although the NeuroMark FBP template (i.e., the collection of all AβNs) was developed using control subjects, it is designed to enable standardized analyses in future studies, enabling discrimination between groups with different disorders.
ICA empirical spatial findings
The NeuroMark framework measures AβNs’ (or ICs’) reproducibility. In this study, this was done by measuring the spatial correlation between paired ICs across groups A and B. The most reproducible component pair was the first WM IC (Figure 8); however, this component was excluded because it is not considered relevant to the research question, mainly targeting beta-sheet structures as opposed to Aβ in GM. In agreement with previous literature about myelin integrity,8 we found a negative association with age for this WM IC. The clear detection and delineation of WM suggests that ICs may separate different target sources from each other, implying that ICA may be used to separate target from off-target sources. This capability may stem from ICA’s ability to exploit statistical independence, which can facilitate separation of different binding sources such as Aβ plaques and affinity for the beta-sheet structure into different components. Therefore, ICA may account for the complex and overlapping patterns of radioligand binding, which anatomical atlases are unable to address. Apart from delineating WM, our ICA methods may have also detected other biologically off-target regions as ICs, such as ventricle components and the brainstem.
The effectiveness of ICA in distinguishing off-target from target binding effects is beyond the scope of this study, but may be of interest for future research, which may broaden ICAs applications.

Figure 3C illustrates the possibility of combining all AβNs to cover the entire GM, excluding ventricles and WM. Therefore, Neuromark PET may have the potential to define a global region within the GM and generate a corresponding region that enables the comparison of Aβ+ from Aβ- individuals at the global level. While Amyloid PET is typically used as a global measure for clinical studies, there is growing interest in studying the patterns of deformation to provide additional insights into the mechanism and disease course, something that may also be helpful for identifying treatment targets. Previous literature29 found that the inferior temporal gyri showed significant local Aβ effects between control and AD groups. Different methods exist for Aβ detection in AD,32 including a longitudinal approach showing that early AD may have a pattern of Aβ that is different from later stages of the disease. Even though NeuroMark may not be used clinically today, it may still be valuable for the research community and for advancing our understanding of AD and other disorders.
The NeuroMark PET template, derived from control participants, can identify patterns in how control participants differ from each other. This template can then be extrapolated to other populations, including AD. Previous NeuroMark templates have extrapolated control subjects to many other brain disorders for MRI.16 NeuroMark has also proven to be remarkably robust relative to ROI studies33 and has an objective function that optimizes feature extraction based on single-subject data properties.15 In this way, the approach can be adapted to different ages and conditions, while still enabling correspondence among subjects and datasets.
Limitations
Using different tracers, we found many similarities, including the fact that CC1 was the most significant AβN is both FBB and FBP. However, a difference between the tracers was that they had slightly different negative age associations. For FBB, CC3 and SM3 had negative age effects, while for FBP, DM2, DM4, AU1, SM1, and VIS3 had negative age effects. The different patterns of negative age effects may be related to a slightly different molecular binding. For instance, FBP had a negative association between age and SUVR in WM, but not FBB (also seen in Table S1). A more detailed investigation into the subtle differences in binding effects between FBB and FBP is beyond the scope of the present study and may be explored in future research. For this study, however, the cases with negative correlation between AβN SUVR values and age were excluded.
Another limitation may be how to use partial volume correction between the anatomical ROIs and the NeuroMark template. To calculate partial volume correction (PVC) for DKT ROIs, one has to use a compartment-based method, while for NeuroMark AβNs, one has to calculate PVC using a voxel-based method. To make sure we treated the processing the same for the anatomical atlas and for the NeuroMark template, we decided not to use any PVC in this study. However, PVC is an important factor, which may be further explored in future studies.
Another difference is how the DKT ROIs and the AβNs represent features. It may be posited that the larger AβNs offer enhanced stability relative to the smaller DKT ROIs, potentially rendering the latter noisier, aligning with ICA’s role as an effective dimensionality reduction tool. ICA excels in simplifying complex datasets by decomposing them into a limited number of meaningful components, thereby enhancing interpretability and reducing noise. This dimensionality reduction not only benefits researchers by streamlining data analysis but may also preserve the integrity of significant neural patterns. Comparing the 15 NeuroMark AβNs, which are considerably larger in size to the 87 statistically significant DKT ROIs, the CC1 AβN exhibited greater significance than the right inferior temporal cortex ROI, as illustrated in Figure 4. The overlapping and weighted nature of ICA-derived components provides a complementary perspective to traditional ROI-based approaches. Such an approach adheres to established scientific standards and offers researchers an additional angle to uncover intricate neural relationships.
Given the limitations of both ROI-based and network-based methods, it is pertinent to consider how these approaches might complement one another. When aligning current findings with existing literature, an atlas such as DKT may be preferable because multivariate network-based techniques remain relatively novel. Anatomical ROIs, which do not overlap, facilitate straightforward visualization, and allow selection of a specific anatomic ROI which may be of interest. However, ROI-based atlases with rigid boundaries often fail to correspond to underlying chemo-architectural divisions, potentially partitioning contiguous tracer signals into multiple regions and thereby reducing statistical power. In contrast, a network-based approach generates a multivariate, data-driven map that inherently respects chemo-architectural boundaries. Additionally, network-derived regions may overlap spatially, such as around hub areas, thereby capturing complex radioligand-binding patterns.
Conclusion
This study introduces and validates the NeuroMark PET approach, leveraging spatially constrained ICA to generate biologically meaningful and reproducible brain networks (since we used replication-based component validation). By applying this method, we demonstrate that NeuroMark PET may complement traditional atlas-based analyses (DKT). We show age-related binding changes in the brain, specifically in cortical regions relevant to neurodegenerative processes. NeuroMark PET has at least three advantages to an anatomical atlas. 1) A few NeuroMark AβNs may have greater significance than the most significant DKT ROIs. This could be crucial in applications where detecting strong signal is more valuable than capturing broad but less intense patterns. 2) The complexity of measured Aβ uptake across subject populations can be decomposed by NeuroMark ICA into a limited number of contrasting AβNs. Importantly, each AβN aligns with a specific Aβ uptake subpattern. This automated ICA approach allows for overlapping regions, thereby reducing complexity and minimizing potential bias associated with manual region selection. 3) The NeuroMark AβNs are spatial patterns customized specifically for Aβ uptake. In addition, NeuroMark can customize maps for other radioligands. Conversely, the anatomical atlases are rigid, having the same fixed borders for every radioligand.
The strengths above are likely related to the fact that ICA is data-driven, capturing voxels that show covariation among participants in maximally spatially independent maps. The ICA results also benefit from data reduction, as the multiple comparison burden is lower for ICA compared to the ROI analysis.
The NeuroMark AβN template, which excludes non-GM regions (e.g., WM and ventricles), may therefore provide a more efficient and biologically relevant representation of molecular tracer distributions. This advancement highlights the potential of NeuroMark AβNs to enhance our understanding of the molecular underpinnings of brain function and pathology, paving the way for more sensitive and individualized analyses of large-scale multimodal datasets. This approach offers a straightforward and objective way to generate radioligand specific maps as an alternative to conventional ROI-based methodologies, emphasizing the importance of data-driven techniques in neuroimaging research.
Data availability
The data that supports the findings of this study are available on request from the public Alzheimer’s Disease Neuroimaging Initiative (ADNI). Application to access the ADNI dataset is found at https://adni.loni.usc.edu/data-samples/adni-data/#AccessData.
Links to the NeuroMark PET FBP template are available at https://trendscenter.org/data or at https://doi.org/10.5281/zenodo.16617800.
Funding Sources
Cyrus Eierud and Martin Norgaard were supported by the BRAIN Initiative grant (OpenNeuroPET, grant ID 1R24MH120004-01A1), Cyril Pernet and Melanie Ganz were supported by the Novo Nordisk Foundation (OpenNeuroPET, grant ID NN20OC0063277), Murat Bilgel was supported by the Intramural Research Program of the National Institute on Aging, National Institutes of Health and Granville J. Matheson was supported by the Swedish Research Council (Vetenskapsrådet, grant ID 2020-06356), Vince D. Calhoun was supported on NIH grant RF1AG063153 and NSF grant 2112455.
Conflict of interest disclosure
The authors declare that they have no financial or personal conflicts of interest that could have influenced the study.
Ethics approval statement
This study utilized data from the ADNI database. ADNI has obtained all necessary IRB approvals and met all ethical standards in the collection of their data. As per ADNI protocols, all procedures performed in studies involving human participants were in accordance with the ethical standards of the institutional and/or national research committee and with the 1964 Helsinki declaration and its later amendments or comparable ethical standards. The use of ADNI data in this study was approved through an online application process, and all investigators agreed to the ADNI Data Use Agreement, which includes provisions for data confidentiality and ethical use.
Patient consent and permission to reproduce material from ADNI
Data used in the preparation of this study were obtained from the ADNI database. The investigators within ADNI obtained written informed consent from all participants, and approval was granted by the relevant institutional review boards. The authors acknowledge permission to use and reproduce ADNI data in accordance with ADNI’s data use policies. In addition, our study was approved by the ADNI Data and Publications Committee (DPC).
Acknowledgements
Data collection and sharing for this project were funded by the ADNI (National Institutes of Health Grant U01 AG024904) and DOD ADNI (Department of Defense award number W81XWH-12-2-0012). ADNI is funded by the National Institute on Aging, the National Institute of Biomedical Imaging and Bioengineering, and through generous contributions from the following: AbbVie, Alzheimer’s Association; Alzheimer’s Drug Discovery Foundation; Araclon Biotech; BioClinica, Inc.; Biogen; Bristol-Myers Squibb Company; CereSpir, Inc.; Cogstate; Eisai Inc.; Elan Pharmaceuticals, Inc.; Eli Lilly and Company; EuroImmun; F. Hoffmann-La Roche Ltd and its affiliated company Genentech, Inc.; Fujirebio; GE Healthcare; IXICO Ltd.; Janssen Alzheimer Immunotherapy Research & Development, LLC.; Johnson & Johnson Pharmaceutical Research & Development LLC.; Lumosity; Lundbeck; Merck & Co., Inc.; Meso Scale Diagnostics, LLC.; NeuroRx Research; Neurotrack Technologies; Novartis Pharmaceuticals Corporation; Pfizer Inc.; Piramal Imaging; Servier; Takeda Pharmaceutical Company; and Transition Therapeutics. The Canadian Institutes of Health Research is providing funds to support ADNI clinical sites in Canada. Private sector contributions are facilitated by the Foundation for the National Institutes of Health (www.fnih.org). The grantee organization is the Northern California Institute for Research and Education, and the study is coordinated by the Alzheimer’s Therapeutic Research Institute at the University of Southern California. ADNI data are disseminated by the Laboratory for Neuro Imaging at the University of Southern California.