


Introduction
We have a longstanding desire to decipher the mystery of our own mind.1 While philosophy and psychology have provided important insights regarding our cognitive and emotional makeup, neuroscience is unique in its ambition to provide mechanistic explanations of the mind.2 Modern neuroscience, rooted in early work of Camillo Golgi and Santiago Ramón y Cajal,3,4 has rapidly advanced through seminal work such as Sherrington’s description of reflexes,5 Hebb’s theories on synaptic plasticity,6 Hubel and Wiesel’s work on the visual cortex,7–9 and the discovery of grid cells by Edvard and May-Britt Moser and their students.10–12 Hand in hand with an ever-increasing pace of scientific discoveries also came diversification of the field into increasingly specialized research domains,13 such as work specifically devoted to the neural mechanisms underlying rare neurological phenomena like synesthesia (e.g.14–17). While this is a natural tendency of scientific disciplines,18,19 it can obfuscate the interconnectedness of phenomena and research questions and may thus hinder further progress.20,21
Consequently, there is an urgent need to provide a high-level perspective on the evolving landscape of neuroscience. New methods of information curation are required both to integrate the field and to understand the dynamics driving a major area of human intellectual endeavor. Addressing this necessity, I have compiled an extensive dataset of neuroscientific abstracts and their metadata spanning from 1999 to 2023 from Q1 and Q2 journals in the respective years according to the SCImago Country & Journal Rank (SJR) database.22 Utilizing state-of-the-art text embedding and clustering techniques as a model for future large-scale bibliographic synthesis, I categorized the literature into 175 distinct research clusters, enabling a content-driven examination of the field’s dynamic trajectory over the past 25 years.
Through these clusters, I systematically map the structural organization of contemporary neuroscience, identifying dominant themes as well as trends and open questions. By analyzing inter-cluster citation patterns, I reveal the extent to which different research domains interact, distinguishing between insular clusters that primarily cite their own work and integrative clusters that serve as intellectual bridges between domains. Furthermore, by characterizing clusters along key descriptive dimensions, I provide a detailed account of how neuroscientific research is organized. Detailed insights into individual research clusters, including their recent trajectories and major open questions, are presented in the Supplementary Materials. Together, this work offers a data-driven framework for understanding the evolution of neuroscience as well as a new dataset that can inform future research directions and promote new collaborative initiatives to bridge specialized domains and advance our collective understanding of the brain.
Methods
All analyses were performed in a Python 3.12 environment managed by conda on a HP Z440 Workstation (Intel® Xeon® E5-1650 v4 CPU @ 3.60 GHz, 12 cores, 31 GB RAM), running Ubuntu 22.04.5 LTS. I used PyTorch (version 2.2.0) for building and training all neural networks on a GeForce GTX 1080 Ti graphics card using CUDA version 12.2.
Data Source and Extraction
The PubMed database (www.ncbi.nlm.nih.gov/Pubmed) was used as data source for obtaining abstracts and metadata of neuroscientific articles published between 1999 and 2023. I used the biopython (version 1.81) package to programmatically query the database with the following search query: (“{journal}”[Journal]) AND ((“{year}/01/01”[Date - Publication] : “{year}/12/31”[Date - Publication])). Here journal and year were variables that were assigned based on yearly journal ranks provided by the SJR database.22 Specifically, for each year from 1999 to 2023, I queried all journals ranked within the first two quartiles of the neuroscience rankings provided by SJR. Additionally, for each year, I queried all journals within the first quartile of multidisciplinary rankings provided by SJR. These were included because multidisciplinary journals such as Nature and Science are valuable outlets for neuroscientific research. Finally, I queried journals that ranked in the first quartile for all other disciplines defined by SJR for the years 2000, 2010, and 2020. These were included to train a discipline classifier (see below). For each query, a maximum of 5,000 PubMed entries was obtained. Queries were performed between April 15th 2024 and April 18th 2024. For each article resulting from PubMed queries, I extracted its PubMed ID, its digital object identifier (DOI), the journal it was published in as well as the month and year of publication, its title, abstract, its type. I rejected all articles that were not of research or review type and removed all articles whose abstracts had less than 50 or more than 500 words. Between December 27th 2024 and January 3rd 2025, I obtained citation counts for articles in the dataset, ensuring that each article had at least one full year for accumulating citations. Based on the publication date, I computed article age in years with respect to January 3rd 2025 and used this age to compute citation ratios as the citation count divided by age.
Data Filtering
The journals used in my queries do not exclusively publish neuroscientific work. To reduce the dataset to neuroscientific articles, I used a neural network trained on a multi-label discipline classification task. The discipline classifier network is a fully connected neural network. The architecture consisted of an input layer receiving 1024-dimensional text embeddings, two hidden layers with 256 and 64 exponential linear units (ELUs), and an output layer with 26 sigmoid-activated units, each corresponding to a discipline. To prevent overfitting, a dropout layer with a probability of 0.5 was applied before the final classification layer. The input embeddings were generated using the voyage-lite-02-instruct model from Voyage AI, a general-purpose text embedding model.
To train the discipline classifier, a labeled training dataset was constructed. First all articles from non-neuroscientific journals were included. Then 5% of all articles in journals publishing neuroscience were included. Labels for each article were obtained from the discipline assessment provided by SJR for each journal. Importantly, these labels are accurate at the journal level but not at the article level. A particular article published in a journal that publishes neuroscience but also other subdisciplines of life science, might nevertheless be a pure neuroscientific article. For this reason, training was performed in three stages. In a pre-training phase, the classifier was trained for 25 epochs on a subset of the training data limited to articles from journals that exclusively publish in a single discipline.
Following pretraining, the classifier was applied to a broader set of articles, including those from multidisciplinary journals. All discipline labels falling below 99% of the maximum class probability were removed. Note that this does not remove any articles; rather, only discipline labels were discarded while simultaneously ensuring that each article retained at least one label. The classifier was then trained for 50 additional epochs, incorporating these high-confidence self-labeled samples. In the final stage, the model was fine-tuned for 10 additional epochs using again only articles from journals that exclusively publish in a single discipline. In all stages, data was subdivided into training (80%), validation (10%), and test (10%) subsets. No explicit class balancing techniques, such as resampling or weighting in the loss function, were applied. Training in all stages was conducted using binary cross-entropy loss, an Adam optimizer with a learning rate of 0.0002, and a batch size of 64.
After training, the labeled articles used for training were assessed for inclusion in the final neuroscience dataset. The articles originally selected from exclusively neuroscience journals were automatically retained since they were already part of the intended dataset. For each article published in journals that do not exclusively publish neuroscientific work, I used the discipline classifier network to identify whether neuroscience was within 80% of the most probable discipline. This threshold was chosen to ensure that only articles with a strong neuroscientific focus were included while minimizing the risk of discarding relevant research. Articles that did not meet this criterion were removed.
Semantic Clustering
To identify domain clusters in neuroscience, I initially embedded abstracts of all articles in the final dataset in a neuroscience-specific latent space to be able to assess semantic similarity between articles. This proceeded in two stages. First, I embedded all abstracts using the general-purpose voyage-large-02-instruct text embedding model from Voyage AI. Then I further embedded the resulting vector representations using a custom neural network to obtain a neuroscience-specific representation of article abstracts. The network comprised three fully connected hidden layers with progressively smaller dimensions (512, 256, 128), reducing the input 1024-dimensional embeddings to a 64-dimensional domain-specific embedding space. Batch normalization was applied after the first and second fully connected layers. An ELU activation function followed each of these layers, and dropout was applied immediately after the ELU activation in both the first and second hidden layers, with a dropout rate of 0.1. The output of the final layer was L2-normalized, ensuring that all embeddings had unit length.
The network was trained using a contrastive learning approach with a self-supervised multi-positive, multi-negative InfoNCE variant. Specifically, the loss for each sample is given by
Li=−log(∑j≠ieSijM+ijT)+log(∑jeSijM−ijT)
where denotes the cosine similarity between 64-dimensional, domain-specific embeddings of items and and are binary masks indicating positive and negative pairs respectively, and is a temperature parameter - set to 0.1. The final infoNCE loss is the average over all samples in a batch. The objective was to learn a representation where semantically similar articles were mapped closer together while dissimilar articles were pushed apart. The masks define training pairs dynamically based on cosine similarity between the 1024-dimensional general-purpose embeddings that served as input to the network. Pairs of articles with an initial embedding cosine similarity of at least 0.85 were designated as positive pairs, while pairs with a similarity below 0.75 were assigned as negative pairs. Intermediate cases, where similarity fell between these thresholds, contribute an additive term of 1. This ensures the arguments to the logarithm remain bounded, contributing to numerical stability, particularly when the number of explicitly defined positive or negative samples for an anchor is small relative to the batch size. Similarity cutoffs for defining positive and negative pairs were defined based on domain knowledge and manual inspection. Specifically, I computed the cosine similarity between the embedded representations of a set of abstracts that I had judged to be part of the same research domain and compared this to the similarity between abstracts that I classified as belonging to different subdomains. To further constrain the learned representations and promote meaningful structure in the latent space I added the correlation between dimensions in the output layer as an additional loss with a weight of 0.1. A substantial portion of the dataset, approximately 95%, served as training dataset. The remaining 5% of the dataset was reserved for validation. The training dataset was used to optimize the embedding network with an Adam optimizer, a batch size of 256, and an initial learning rate of 0.0001. The learning rate was scheduled to decrease exponentially over the course of 2000 epochs, with a decay factor of 0.995 per epoch. Additionally, L2 regularization with a weight of 0.01 was applied. To accelerate training convergence, I incorporated Grokfast,23 a method that amplifies slow gradients during optimization, with a smoothing coefficient of 0.98 and an amplification factor 2.
Following training, the learned embeddings were used to construct a semantic similarity graph using python-igraph (version 0.11.8), where each node represents an article and edges between nodes are weighted by their cosine similarity. A K-NN search was performed using FAISS (faiss_cpu version 1.8.0.post1) to retrieve the top 50 most similar neighbors for each article and add these as edges to the graph. This results in a directed graph because an article might be among the top 50 nearest neighbors of another article, but not vice versa. I symmetrized the graph by adding bidirectional edges.
The resulting undirected, weighted graph served as the foundation for clustering neuroscience into distinct research domains using Leiden community detection24 implemented in the leidenalg package (version 0.10.2). Leiden clustering was performed using the Constant Potts Model (CPM).25 To systematically determine the optimal resolution parameter, clustering was conducted across 1000 resolution values, evenly spaced between 0.001 and 1.0. To identify the optimal resolution, modularity scores were monitored, and clustering was halted early if modularity exhibited a consistent downward trend across five consecutive resolution steps. The best resolution parameter was selected as the value that maximized modularity across the examined range. Articles were then assigned to clusters based on the optimal Leiden partition, and these cluster assignments were mapped back to the original dataset.
Citation Density Graph
To construct a citation density graph at the cluster level, I first extracted citation and reference relationships for each article in the dataset. For each article, I retrieved the PubMed IDs of all articles citing it (incoming citations) and all articles it cited (outgoing references). Only linked PubMed IDs present in the dataset were retained. I next computed citation density between all pairs of clusters by identifying all articles that cite across clusters and normalizing this by the number of possible citations, taking the relative article ages into account. Additionally, for each cluster I identified the clusters whose articles most frequently cite articles in the clusters and whose articles most frequently get cited by articles in the cluster. Finally, I constructed a weighted and directed citation density graph by connecting each cluster to their most citing and most cited clusters and weighing these connections by the citation density.
Metrics
Compound Annual Growth Rate
The compound annual growth rate over the period from to is given by where is the initial value and is the final value.
Size-Adjusted Annual Growth Rate
The size-adjusted annual growth rate is given by where is the slope obtained from a linear regression of the number of articles in cluster as a function of years and is the total number of articles in cluster over the entire period.
Krackhardt Coefficient
The Krackhardt coefficient (E/I-ratio) is given by where is the number of external citations and the number of internal citations.
LLM-Based Analyses
I conducted several semantic analyses of the domain clusters with the aid of OpenAI’s gpt-4o-2024-08-06 large language model (LLM). First, I obtained a title, short description, relevant keywords, and a classification of the primary focus (thematic or methodological) for each cluster by submitting up to 200 abstracts of each cluster to the LLM. For clusters with less than 200 articles, I submitted all abstracts. For clusters with more than 200 articles, I selected those whose abstracts were most similar to the cluster centroid in the previously computed semantic embedding space. The selected abstracts were formatted and submitted to the LLM using the LangChain API (version 0.3.19 of langchain and 0.3.6 of langchain_openai), with the following prompt:
You are provided with a list of scientific abstracts that belong to a specific research cluster. Your task is to:

1. **Identify the most frequent and relevant keywords and phrases** used in the abstracts within this cluster. The keywords should accurately characterize the research within the cluster and avoid wrong assertions.

2. **Provide a descriptive title** for the cluster that encapsulates the main themes and methodologies.

3. **Write a brief summary** (1-2 sentences) that describes the main themes and methodologies of the cluster.

4. **Determine the main focus** of the cluster, whether it is on the themes or methodologies. A methodological focus is when a cluster focuses on method development or consistently applies a specific methodology. A thematic focus is when a cluster consistently studies a specific phenomenon.

**Output Format:**

Please present your findings in **JSON format** with the following structure:

"Keywords": ["keyword1", "keyword2", "keyword3", ...],

"Title": "Descriptive Cluster Title",

"Description": "Brief summary of the cluster's main themes and methodologies."

"Focus": "The main focus of the cluster is either on the themes or methodologies."

```

**Instructions:**

- **Accuracy is crucial**: Ensure all information is directly supported by the provided abstracts. Do not include information not present in the abstracts or make external assumptions.

- **Clarity and Precision**: The keywords, title, and description should be clear and accurately reflect the content of the abstracts.

- **Conciseness**: Do not include any additional text or explanations beyond the specified JSON output. Do not generate more output than necessary.

**Here are the abstracts:**
{abstracts}
The generated JSON data was automatically extracted and integrated into the dataset. The prompt was designed to minimize the risk of hallucination or speculative assertions by the model, as it was explicitly instructed to rely solely on the provided abstracts.
To better understand what distinguishes similar clusters, I identified the most similar cluster for each of the 175 clusters. For each cluster, I then submitted the 100 articles that were most similar to the other cluster’s centroid as well as the 100 articles of the other cluster that were most similar to its centroid to the LLM with the following prompt:
You are provided with two sets of neuroscientific abstracts from Cluster A and Cluster B, which are similar in nature. Analyze the abstracts from both clusters and identify the most distinguishing features that separate Cluster A from Cluster B with high accuracy and conciseness.

**Instructions:**

- Return your findings **only** in JSON format.

- The JSON should contain a single field named `"Distinguishing Features"`.

- Do **not** include any other text, explanations, or comments.

- Do **not** include more than three features.

- Always contrast the features of Cluster A with Cluster B.

- Keep the feature descriptions short (1 or 2 sentences) and simple. Non-experts must be able to understand.

**Example Output:**

```json

{{

"Distinguishing Features": "Feature 1 description; Feature 2 description; Feature 3 description"

}}

**Cluster A Abstracts:**

{cluster_a_abstracts}

**Cluster B Abstracts:**

{cluster_b_abstracts}
The generated JSON data was automatically extracted and integrated into the dataset.
Subsequently, I utilized the LLM to assess research within each cluster along 9 research dimensions: appliedness, modality, spatiotemporal scale, cognitive complexity, species, theory engagement, theory scope, methodological approach, and interdisciplinarity. To that end, I submitted up to 250 abstracts of each cluster together with the cluster title to the LLM using the following prompt:
You are an expert in neuroscience and scientific text analysis.

You are provided with a list of neuroscientific abstracts that belong to the cluster '{title}'.

Your task is to identify **key neuroscience dimensions** that best describe the cluster, guided by the following 9 dimensions:

1. Appliedness: The extent to which the research is basic science (fundamental mechanisms) or applied (translational, clinical, method development, advancing technology).

2. Modality: The sensory and/or motor modality under investigation (e.g., visual, auditory, gustatory, somatosensory, motor, sensorimotor, multimodal).

3. Spatiotemporal Scale: The spatial (e.g., molecular, cellular, circuit, region, systems, whole-brain) and temporal (e.g., microsecond, millisecond, second, minute, hour, day, week, month, year, lifetime) scale of the research.

4. Cognitive Complexity: The level of cognitive complexity under investigation from low level (e.g., sensory processing, motor control) to high level (e.g., language, decision making, social cognition).

5. Species: The species under investigation (e.g., human, non-human primate, rodent, drosophila, zebrafish, C. elegans).

6. Theory Engagement: The extent to which the research is theory-driven (hypothesis testing) or data-driven (exploratory, descriptive).

7. Theory Scope: The scope of the theory under investigation, ranging from specific mechanisms to broad overarching theories of the brain. Intermediate between these are theories focusing on pathophysiology of a specific disorder and highly influential theories with narrow domain coverage. Indicate the specific unifying theoretical frameworks (e.g., Predictive Coding, Critical Brain Hypothesis, Communication through Coherence, Free Energy Principle, Active Inference, Global Neuronal Workspace, Integrated Information Theory, etc.) if applicable (else, no general theory). There might be more than one framework.

8. Methodological Approach: The methodological approach used in the research (e.g., experimental, computational, theoretical, modeling, simulation, data analysis, review, meta-analysis, etc.). Identify specific methods if applicable (e.g., optogenetics, fMRI, EEG, MEG, TMS, lesion studies, single-unit recordings, etc.). There might be more than one method.

9. Interdisciplinarity: The extent to which the research is interdisciplinary, combining methods and concepts from multiple fields (e.g., medicine, biology, chemistry, psychology, computer science, physics, engineering, mathematics, philosophy).

Examples are not exhaustive and abstracts may contain multiple dimensions.

**Output Format:**

Please present your findings in **JSON format** with the following structure:

{{

"Dimension 1 - Appliedness": "Brief assessment of the research's appliedness.",

"Dimension 2 - Modality": "Brief overview of the sensory and/or motor modality under investigation.",

"Dimension 3 - Spatiotemporal Scale": "Brief description of the spatial and temporal scale of the research.",

"Dimension 4 - Cognitive Complexity": "Brief assessment of the research's cognitive complexity.",

"Dimension 5 - Species": "Brief overview of the species under investigation.",

"Dimension 6 - Theory Engagement": "Brief assessment of the research's theory engagement.",

"Dimension 7 - Theory Scope": "Brief assessment of the research's theory scope. Identify specific theoretical frameworks if applicable. There might be more than one framework. Not all articles need to fall under any specific framework, but a significant portion should (one or two are not enough).",

"Dimension 8 - Methodological Approach": "Brief overview of the methodological approach used in the research. Identify specific methods if applicable. There might be more than one method.",

"Dimension 9 - Interdisciplinarity": "Brief assessment of the research's interdisciplinarity."

}}

```

**Instructions:**

- **Accuracy is crucial**: Ensure all information is directly supported by the provided abstracts. Do not include information not present in the abstracts or make external assumptions.

- **Clarity and Precision**: Assessments and descriptions should be clear and accurately reflect the content of the abstracts.

- **Conciseness**: Do not include any additional text or explanations beyond the specified JSON output. Do not generate more output than necessary.

**Here are the abstracts:**

{abstracts}
The generated JSON data was automatically extracted and integrated into the dataset. It was also used for a second-level assessment of research dimensions along specific categories within each dimension. For this analysis, I split spatiotemporal scale into two dimensions, spatial scale and temporal scale. To obtain a binary judgment whether a cluster qualifies for a particular category, I submitted the verbal assessment of a cluster’s dimensions to the LLM together with specific instructions to evaluate a particular category belonging to a particular dimension. I used the following prompt for this purpose:
You are an expert in neuroscience.
You are provided with an analysis of research within a neuroscientific cluster along the following 9 dimensions:
1. Appliedness: The extent to which the research is basic science (fundamental) or applied in one of several ways.
2. Modality: The sensory and/or motor modality under investigation.
3. Spatiotemporal Scale: The spatial and temporal scale of the research. Can vary from microscale to macroscale for both space and time.
4. Cognitive Complexity: The level of cognitive complexity under investigation from low level (e.g., sensory processing, motor control) to high level (e.g., language, decision making, social cognition).
5. Species: The species under investigation.
6. Theory Engagement: The extent to which the research is theory-driven (hypothesis testing) or data-driven (exploratory, descriptive).
7. Theory Scope: The scope of the theory under investigation. Overarching Framework: In neuroscience, an overarching framework is a broad theoretical approach that aims to explain fundamental principles of brain function across multiple cognitive and neural domains.
Domain Framework: In neuroscience, a domain framework is an integrative theory focusing on a specific subfield, offering cohesive principles for that area.
Disease-specific Framework: In neuroscience, a disease-specific framework is a theory that details the neural causes, mechanisms, and manifestations of a particular neurological or psychiatric condition.
Micro Theory: In neuroscience, a micro theory is a narrowly scoped, mechanistic account or model that explains one specific process or phenomenon in the brain.
8. Methodological Approach: The methodological approach used in the research. Experimental: Studies in which researchers deliberately manipulate one or more variables under controlled conditions to test for causal effects.
Observational (Correlational / Descriptive): Studies that measure variables in naturally occurring settings without introducing any active intervention, focusing on describing or correlating observed phenomena.
Computational / coding: Studies that construct or test mathematical, algorithmic, or simulation-based models to predict, explain, or interpret empirical data or biological processes.
Theoretical / Conceptual: Work that develops, refines, or critiques conceptual frameworks and theories without generating new empirical data or running computational simulations.
Meta-Analytic / Systematic Review: Research that synthesizes and reanalyzes existing primary studies, systematically aggregating findings using quantitative (meta-analysis) or rigorous protocol-based (systematic review) methods.
9. Interdisciplinarity: The extent to which the research is interdisciplinary, combining methods and concepts from multiple fields. From low (confined to a single discipline) to very high (incorporating multiple disciplines in a transdisciplinary manner).
Multidisciplinary: Multiple disciplines study the same problem in parallel, each applying its own methods and perspectives but with little cross-integration.
Interdisciplinary: Researchers from different disciplines integrate theories, methods, or data to create shared frameworks or solutions that transcend any single field.
Transdisciplinary: Collaboration goes beyond standard academic boundaries, involving non-academic stakeholders or merging disciplines so completely that new fields or holistic approaches emerge.
Your task is to focus solely on the dimension of {dimension} and provide a binary indication ("yes" or "no") of whether the research within the cluster falls within the specified categories.
Here are the categories for this dimension:
{categories}
**Output Format:**
Please present your findings in **JSON format** with the following structure:
{{
"Category 1": "yes" / "no",
"Category 2": "yes" / "no",
"Category 3": "yes" / "no",
...
category n: "yes" / "no"
}}
```
**Instructions:**
- **Accuracy is crucial**: Ensure all information is directly supported by the provided analysis. Do not include information not present in the analysis or make external assumptions.
- **Consistency**: Ensure that the evaluation of the dimension does not contradict the provided analysis (including other dimensions).
- **Focus and Precision**: Only evaluate the dimension of {dimension} and provide a binary response for each category. Do not include any additional information or explanations.
- **Proper Category Naming**: Ensure that the categories are named correctly and accurately reflect the content of the analysis. ONLY use the provided categories and replace Category 1, Category 2, etc. with the actual category names.
- **Binary Response**: Ensure that the response for each category is binary (yes or no) and does not include any other text or explanations.
**Here is the analysis of the research within the cluster along the dimension of {dimension}:**
{analysis}
The generated JSON data was automatically extracted and integrated into the dataset.
Next, I used the LLM to analyze emerging trends in the field. To that end, I submitted abstracts of up to 200 randomly selected articles published between 2010 and 2021 labeled as older abstracts as well as abstracts of up to 200 articles published since 2021 labeled as younger abstracts to the LLM. For younger articles, I selected articles based on their citation rate. For clusters with more than 200 articles published from 2021 this means I selected the 200 most impactful articles. The LLM was instructed to identify emerging themes and methodological approaches as well as declining themes and methodological approaches using the following prompt:
You are an expert in neuroscience and scientific text analysis.

You are provided with a set of older neuroscientific abstracts and recent neuroscientific abstracts that belong to the cluster '{title}'.

Your task is to compare older abstracts (pre-{year}) to recent abstracts (post-{year}), focusing on:

Emerging thematic trends: New or increasingly emphasized topics (as well as theories) that appear predominantly in the recent set.

Emerging methodological trends: New tools, techniques, or approaches introduced or significantly gaining traction in the recent set.

Declining themes: Topics or themes that were prominent in the older set but are less emphasized or absent in the recent set.

Declining methodological approaches: Tools, techniques, or approaches that were commonly used in the older set but are now less represented or obsolete.

Provide your analysis in a structured JSON format.

**Output Format:**

Please present your findings in **JSON format** with the following structure:

{{

"Emerging Themes": "Semicolon separated list of emerging thematic trends with brief descriptions",

"Emerging Methodological Approaches": "Semicolon separated list of emerging methods or techniques with brief descriptions",

"Declining Themes": "Semicolon separated list of themes with brief descriptions that are less emphasized or absent",

"Declining Methodological Approaches": "Semicolon separated list of older methods or techniques with brief descriptions that are now less used"

}}

**Instructions:**

- **No colons**: Do not use colons in the JSON output.

- **Accuracy is crucial**: Ensure all information is directly supported by the provided abstracts. Do not include information not present in the abstracts or make external assumptions.

- **Clarity and Precision**: Assessments and descriptions should be clear and accurately reflect the content of the abstracts.

- **Conciseness**: Do not include any additional text or explanations beyond the specified JSON output. Do not generate more output than necessary.

**Here are the older abstracts**:

{old_abstracts}

**Here are the recent abstracts**:

{recent_abstracts}
To further understand developments within each cluster, I used the LLM to extract open questions for each neuroscientific cluster. To that end I obtained five full review articles per cluster in portable document format (PDF). These review articles were published either in 2023 or 2024. Those published in 2023 were directly selected from the dataset based on their abstracts’ similarity to cluster centroid and whether I had access. Candidates for review articles published in 2024 for each cluster were identified by a PubMed query with the cluster’s keywords. Abstracts and digital object identifiers of the top 100 responses were obtained. Abstracts were then embedded and compared to the cluster centroid. Those articles with the highest similarity to which I had access were selected. I included three articles from the dataset (published in 2023) and two articles not in the dataset (published in 2024) unless access limitations required adjustments to this distribution. The list of review articles I used is shown in Supplementary Table 5. The set of five review articles of a cluster were then submitted to the LLM with the instructions to identify the major open questions that are explicitly or implicitly discussed in these articles defined in the following prompt:
You are a domain expert in neuroscience. You have the combined text of several recent neuroscience review articles that all pertain to the same cluster entitled “{cluster_title}”.
{cluster_definition}

Your task is to synthesize and prioritize the major open questions explicitly or implicitly mentioned in these articles.

Below are the texts (or substantial excerpts) of several review articles that cover this cluster. Each article might mention multiple open questions, challenges, or research gaps. Please read them carefully and produce a consolidated list of the major open questions in this subdomain.

**Instructions:**

- Return your findings **only** in JSON format (valid JSON, no extra text).

- The JSON should contain a single field named `"Open Questions"`.

- Do **not** include any other text, explanations, or comments.

- Do **not** include more than five Open Questions.

- No lists: Provide the Open Questions as a single string separated by semicolons, not as a list.

- Highlight overlap: Prioritize questions that appear in multiple reviews.

- Avoid fabrications: Only list questions that are actually stated or strongly implied by the articles.

- Condense duplication: If multiple reviews mention the same open question, merge them into a single entry.

- Preserve specificity: Include enough detail to capture the essence of each open question.

- Be concise: Keep each open question short (2 or 3 sentences) and simple. Non-experts must be able to understand.

**Example Output:**

```json

{{

"Open Questions": "Open question 1; Open question 2; Open question 3"

}}

**Reviews:**

{reviews}
To synthesize overarching trends and key open questions that transcend individual research clusters, I systematically aggregated the results obtained from cluster-specific analyses. Each cluster’s trends and open questions were concatenated into a single document and submitted to the LLM with the instruction to identify patterns that generalize across multiple clusters, distinguishing between emerging research directions, methodological developments, and critical gaps in the field. I used the following prompt:
You are an expert in neuroscience and scientific text analysis.

You are provided with a set of emerging trends and open questions in specific neuroscience clusters.

Your task is to analyze the trends and questions in the clusters and provide an overview of the 10 {type}s that transcend the clusters and reflect the current state of neuroscience as a whole.

Any {type} may focus on thematic developments, methodological developments, or both. For trends both negative and positive developments can be interesting, but necessary developments should focus on which shortcomings need to be addressed.

Provide your analysis in a structured JSON format.

**Output Format:**

Please present your findings in **JSON format** with the following structure:

{{

"{type} 1": Brief assessment and description of the first {type},

"{type} 2": Brief assessment and description of the second {type},

"{type} 3": Brief assessment and description of the third {type},

"{type} 4": Brief assessment and description of the fourth {type},

"{type} 5": Brief assessment and description of the fifth {type},

"{type} 6": Brief assessment and description of the sixth {type},

"{type} 7": Brief assessment and description of the seventh {type},

"{type} 8": Brief assessment and description of the eighth {type},

"{type} 9": Brief assessment and description of the ninth {type},

"{type} 10": Brief assessment and description of the tenth {type}

}}

**Instructions:**

- **Importance**: Focus on the most important {type}s that are relevant to the field of neuroscience as a whole.

- **Big Picture View**: {type}s that only apply to a single or very small number of cluster should not be included. Focus on {type}s that transcend the clusters and reflect the broader field of neuroscience. A {type} that is relevant to many clusters, though not necessarily all, should be included.

- **Accuracy is crucial**: Ensure all information is directly supported by the provided text. Do not include information not present in the text or make external assumptions.

- **Clarity and Precision**: Assessments and descriptions should be clear and accurately reflect the content of the text.

- **Conciseness**: Do not include any additional text or explanations beyond the specified JSON output. Do not generate more output than necessary.

**Here are the cluster specific trends and open questions**:

{text}
As can be appreciated from the prompt, the particular analysis the LLM should perform is variable. The prompt was constructed in this way to enable separate analyses focusing on (1) overarching trends, (2) necessary developments, and (3) transcendental research questions. In each case, the LLM was prompted to generate exactly ten items that encapsulate broad, field-wide patterns rather than localized trends specific to a single or small subset of clusters.
Results
Publication and Citation Patterns in Neuroscience
My first goal was to provide a snapshot of neuroscience publishing trends in the period from 1999 to 2023. To that end, I first identified all neuroscience journals ranked in the top two quartiles in the respective years according to SCIMago Journal Rank. I supplemented these neuroscientific journals with Q1 multidisciplinary journals that publish neuroscientific research such as Nature, Science and Plos ONE. The next step involved querying PubMed (using Biopython) for a maximum of 5,000 articles per journal per year. Through this procedure I obtained metadata and abstracts for research and review articles, excluding editorials and similar content. However, the procedure also yielded articles from disciplines other than neuroscience. To remove these, I embedded abstracts in a vector space using a general-purpose text embedding model from Voyage AI and created a custom discipline classifier neural network (implemented in PyTorch) to filter out all non-neuroscience articles (see Methods for details).
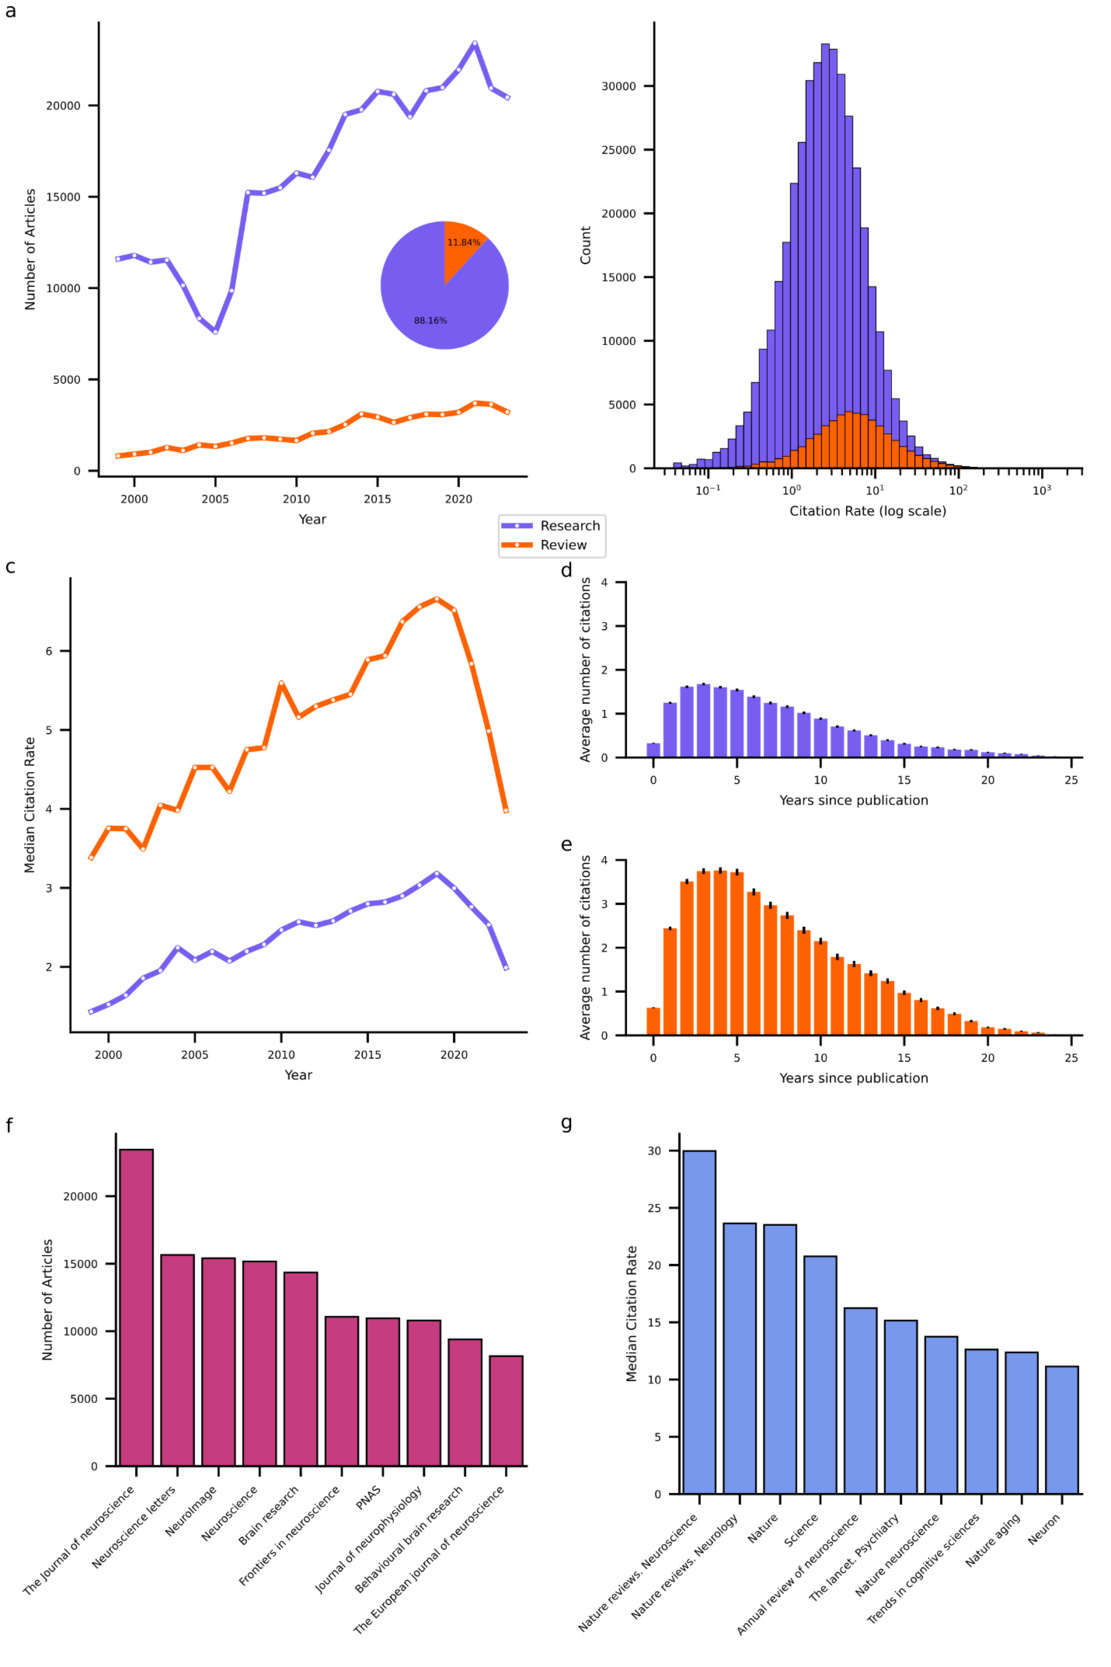
This procedure resulted in a dataset of 461,316 neuroscientific articles published in 375 journals between January 1999 and December 202326. The vast majority (88.16%) of these are research articles. The total number of both types of articles that could be obtained from PubMed increased over time (Figure 1b), with a compound annual growth rate of 2.39% and 5.91% for research and review articles, respectively. While research articles heavily outnumber reviews, reviews exhibit higher citation rates, defined as the total number of citations divided by the article’s age. On average, research articles receive 4.5 citations per year (median = 2.5), whereas review articles receive 10 citations per year (median = 5.3; see Figure 1c for distributions of log-transformed citation rates). Interestingly, the median citation rates (MCRs) of both types of articles increased from 1999 to a peak in 2019, followed by a sharp decline. This rise and fall pattern in MCR indicates that many articles experienced a period during which they were most frequently cited sandwiched between an early phase when they were not yet receiving many citations and a later phase when they were no longer receiving many citations. Indeed, most citations to articles occur within one to 10 years following their publication with the peak typically at around three years (see Figure 1d,e).
To further characterize the publishing landscape, I identified the top 10 primary outlets that published the highest volume of neuroscience articles over the past 25 years (see Figure 1f) and the top 10 high-impact journals (see Figure 1g), defined here by the highest MCRs for articles published therein. The primary outlets list encompasses largely neuroscience specific journals that cater to a broad range of subdisciplines such as The Journal of Neuroscience. The list of high-impact journals likewise comprises domain-specific journals with a wide scope. However, in contrast to the list of primary outlets, it contains a larger proportion of review-focused and high-profile multidisciplinary journals such as Nature and Science.
Neuroscientific Research Domain Clusters
My second goal was to identify the distinct research domains that divide neuroscientific work. To that end, I clustered abstracts based on their semantic similarity measured as cosine similarity between their domain-specific text embeddings. To achieve this, I first further embedded the abstract embeddings obtained with the general-purpose Voyage AI embedding model into a lower-dimensional, domain-specific space (using a custom network implemented in PyTorch). I then constructed a semantic graph (using python-igraph and faiss) wherein each abstract is connected to its 50 semantically nearest neighbors, with each link weighted by the cosine similarity between its vertices. I then applied the Leiden community detection algorithm (leidenalg)24 on this graph to obtain clusters. For each cluster, I submitted abstracts of the 200 nearest neighbors to the cluster’s centroid to a gpt-4o LLM from OpenAI (via LangChain) to describe the cluster. For clusters with less than 200 articles, I submitted all available abstracts. See Methods for details on these procedures.
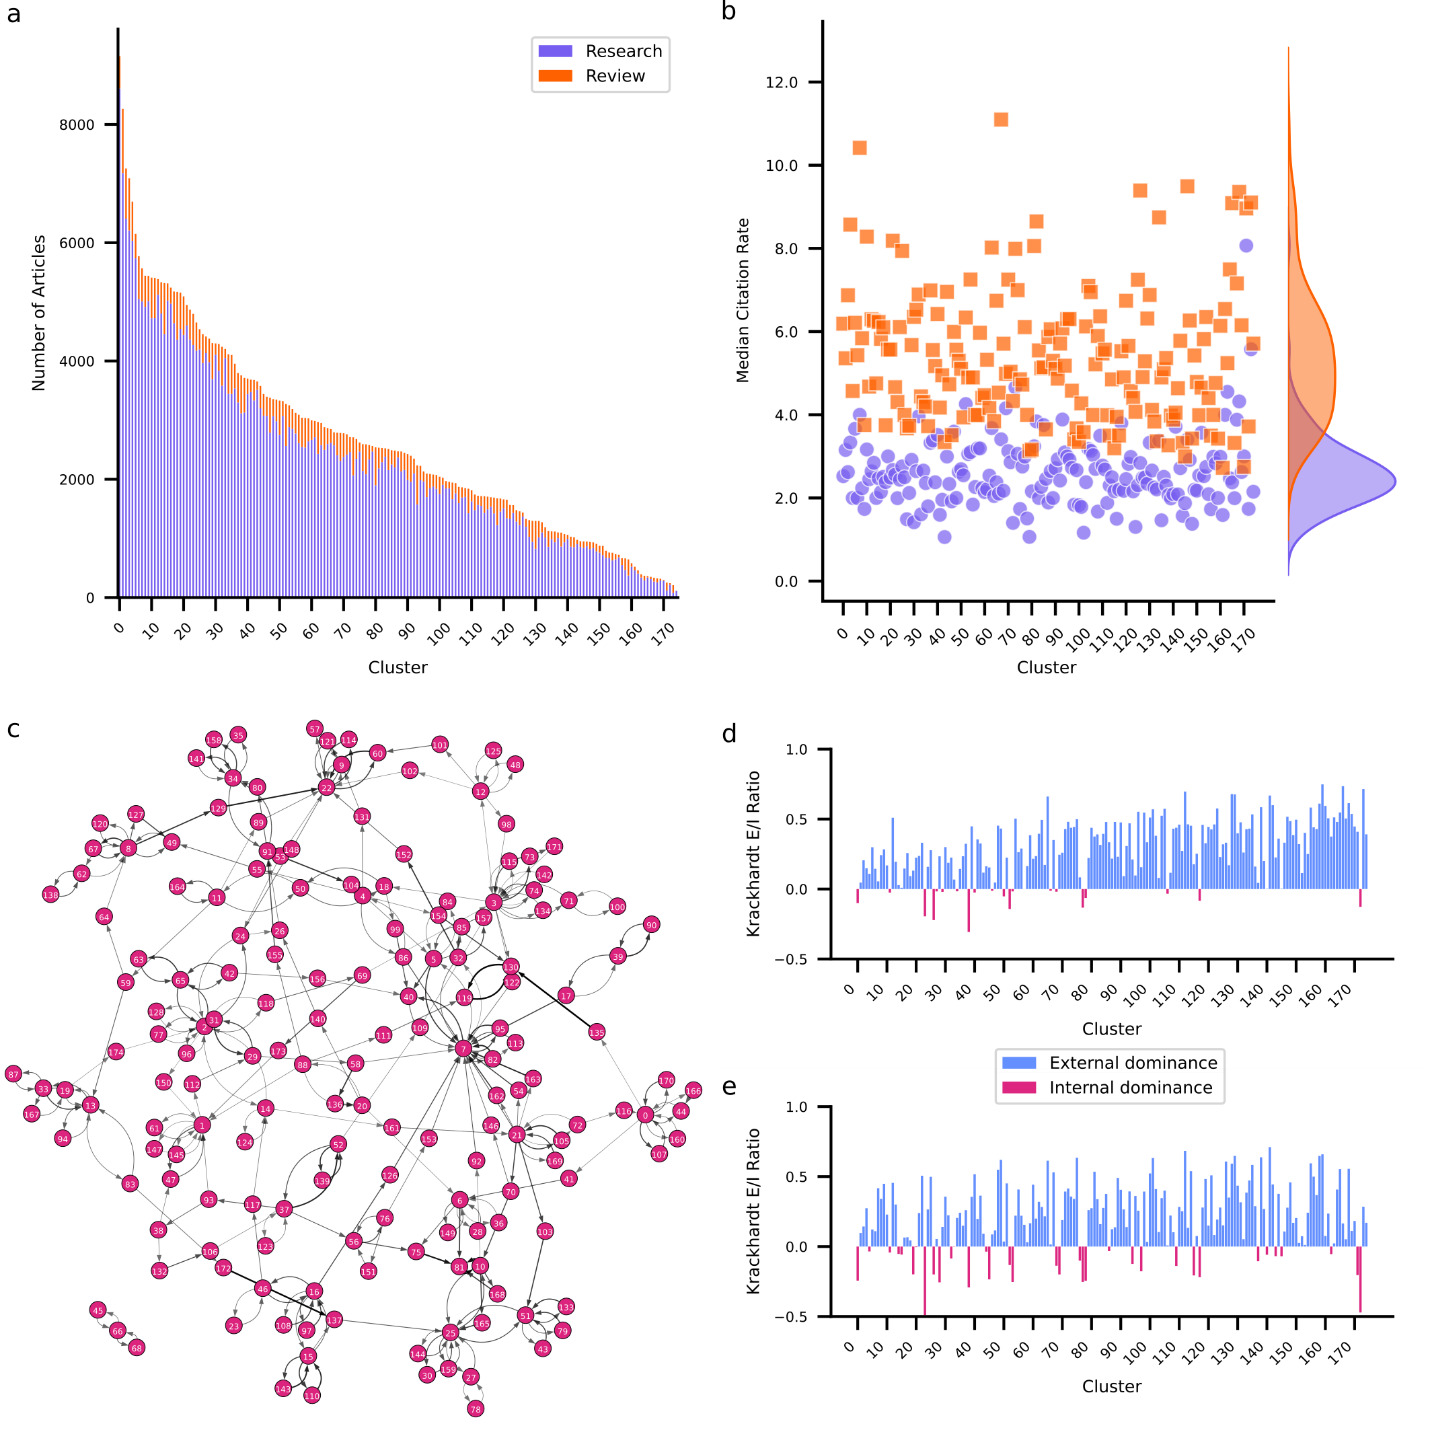
Clustering applied to embedded abstracts identified 175 unique clusters ranging in size from 9,155 to 117 articles (Figure 2a). For a detailed overview of all clusters see Supplementary Table 1. The largest cluster involves research on the mechanisms of neuropathic pain including spinal cord modulation, glial activation, and receptor-mediated processes. The smallest cluster is concerned with the effects of electromagnetic fields emitted by mobile devices on brain function. While most clusters are dominated by research articles, intriguingly two clusters contain more review articles. One investigates the pathophysiology and potential long-term effects of SARS-CoV-2 (COVID-19) on the nervous system. The other investigates the role of exosomes in neurodegenerative disease. The COVID-19 cluster also presents the highest MCR for both research (8.1) and review (11.1) articles, likely explained by the immense interest in SARS-CoV-2 during the global pandemic.26–28
In terms of content, several clusters exhibit some degree of thematic overlap. A total of 14 clusters are devoted to Alzheimer’s disease (AD), each investigating distinct aspects. For example, one AD cluster investigates the role of amyloid beta peptides in pathogenesis whereas another focuses on the pathophysiological mechanisms involving tau protein modifications. Yet other clusters focus on neuroinflammatory processes involved in AD or on the use of cerebrospinal fluid biomarkers and neuroimaging techniques to advance diagnostic accuracy. This pattern is not unique to AD. There are nine clusters devoted to Parkinson’s, indicating that neurodegenerative diseases form their own group of clusters. Apart from clusters devoted to specific conditions, I also observed modality (e.g., vision and audition), cognitive/behavioral (e.g., decision-making, language, and memory), and methodological (functional neuroimaging, brain stimulation) groups of clusters. Curiously, my examination did not reveal any theory-specific clusters, suggesting that theoretical frameworks may be embedded within, rather than defining, research domains.
coefficient for each cluster. Positive values (blue) indicate that articles within a cluster are primarily cited by articles from other clusters. Negative values (red) indicate that articles within a cluster are primarily cited by articles from the same cluster.
Inter-Cluster Citation Structure
To further examine how clusters relate to each other, I examined the interactions between clusters in terms of their citation structure. To that end, I identified for each cluster which other cluster most frequently cites its articles, and which other cluster most frequently gets cited by its articles. I used this information to construct a citation graph among clusters (Figure 2c). Each edge in the graph is weighted by the citation density – the fraction of articles that are cited to the number of articles that could be cited given relative article ages (see Methods for details). Additionally, I computed the Krackhardt coefficient29 for each cluster’s incoming links (citations) and outgoing links (references). The Krackhardt coefficient provides a measure of the external (positive) versus internal (negative) focus of a cluster. For an overview of graph metrics per cluster see Supplementary Table 2. Notably, 74.86% of clusters exhibit positive Krackhardt coefficients for both citations and references. These clusters predominantly cite and are cited externally, suggesting diffusion of knowledge across clusters. These clusters lean on research from other clusters (indicated by a positive Krackhardt coefficient for their references) but also provide insights for other clusters (indicated by a positive Krackhardt coefficient for their citations). A notable example of an externally oriented cluster focuses on the neural underpinnings of consciousness. Conversely, only 6.86% of clusters contain articles that frequently cite and are cited internally, indicated by negative Krackhardt coefficients for both their reference and citation patterns. For example, a cluster containing research on mechanisms and outcomes of auditory damage and repair exhibits this pattern. Clusters such as these exhibit high internal cohesion and specialization but are siloed off from the remainder of the field. Some clusters exhibit mixed patterns. One such group (13.14%) maintains positive Krackhardt coefficient for their references but negative Krackhardt coefficient for their citations. This suggests that while these clusters predominantly cite externally, their own articles are primarily cited internally. This pattern arises for clusters that rely on insights and methodologies from other clusters but are thematically niche. One example of this is research on the effects of adolescent binge drinking on brain development. The obverse are clusters that cite internally while being predominantly cited externally. I observed this pattern in 5.14% of clusters, but with negative Krackhardt coefficients for references close to zero implying that these clusters have only a slight tendency towards citing internally. Advanced neuroimaging techniques for characterizing brain anatomy exhibit this pattern. This pattern likely emerges because methods are widely cited by those using them to answer a diverse range of questions, leading to a wide perfusion of the research within such a method focused cluster. At the same time, this research likely frequently cites related methodological work, explaining a tendency to cite internally.
It is important to note that while the Krackhardt coefficient is useful for assessing whether a cluster is more inward- or outward-focused, it does not necessarily indicate the overall influence of a cluster. A cluster that is cited more frequently by articles outside its own domain may still not be a major hub if it lacks high overall citation counts. To gain a clearer picture of which clusters play a centralizing role, I examined key citation graph metrics, including in-degree (number of citing clusters), PageRank (influence within influential clusters), and betweenness centrality (how well a cluster bridges different research areas) using python-igraph. Several clusters emerge as hubs within the neuroscience research network. The cluster focusing on dynamic functional connectivity in resting-state fMRI stands out as the most influential, with the highest weighted in-degree (0.0125), highest PageRank (0.079), and high betweenness centrality (10,789). The cluster focusing on molecular mechanisms of synaptic plasticity in the hippocampus is another major hub, with a high in-degree (0.0057), PageRank (0.051), and betweenness centrality (14,899). Examining which clusters cite research in these clusters reveals that they are central because they provide complementary insights or relevant methodologies for other clusters. For example, the molecular mechanisms of plasticity cluster feeds research focusing on the mechanisms and dynamics of AMPA receptor trafficking and synaptic plasticity. The dynamic functional connectivity cluster feeds into a cluster focused specifically on functional connectivity and network dynamics in preclinical and clinical AD. By contrast, clusters 150 and 72 are highly isolated with low in-degree (0.00004 and 0.00009 respectively), PageRank scores (0.0010 and 0.0009) and betweenness centrality (2,158 and 2,212). These clusters exhibit highly specialized research focuses on thyroid hormones and vitamin D in neurodevelopment (cluster 150) and neuroendocrine and autonomic mechanisms in cardiovascular regulation (cluster 72) which likely restrict their integration into the broader neuroscientific landscape.
The Dimensions of Neuroscientific Research
I followed these cluster-level analyses with a systematic investigation of the underlying dimensions that characterize neuroscientific research. To that end, I defined 10 dimensions (Appliedness, Methodological Approach, Species, Spatial Scale, Temporal Scale, Modality, Cognitive Complexity, Theory Engagement, Theory Scope, and Interdisciplinarity) and submitted abstracts of the 250 nearest neighbors to a cluster’s centroid to the LLM to characterize each cluster along these dimensions. A detailed assessment of the dimensions in each cluster is provided in Supplementary Table 3. Note that the categories that characterize a dimension are not mutually exclusive. A quantitative overview of how many clusters qualify for categories is shown in Figure 3a and reveals a predominantly experimental focus (96% of clusters) that employs both hypothesis-driven (77%) and data-driven (67%) research. Neuroscientific research often contains a theoretical element in the sense that it employs computational modeling (46%). However, only 3% of clusters contain work that develops, refines, or critiques conceptual frameworks and theories. This aligns with the observation that neuroscience tends to employ micro-theories (64%), i.e., narrowly scoped mechanistic accounts of specific phenomena. Theories of intermediate scope in the form of domain-specific (35%) and disease-specific (39%) theories are also prevalent. However, only 17% of clusters contain research that employs overarching theoretical frameworks aiming to explain fundamental principles of brain function. I observed that translational (55%) and clinical (30%) work sit atop a broad base of fundamental science (81%). Many clusters contain work on rodents (74%) or humans (71%), though non-human primates (33%) and other mammals (30%) also feature prominently. Neuroscience generally shows a balanced division between spatiotemporal scales, though work at the microsecond scale is sparse (6%). Finally, neuroscience displays high levels of interdisciplinarity, with 82% of clusters scoring high or very high.
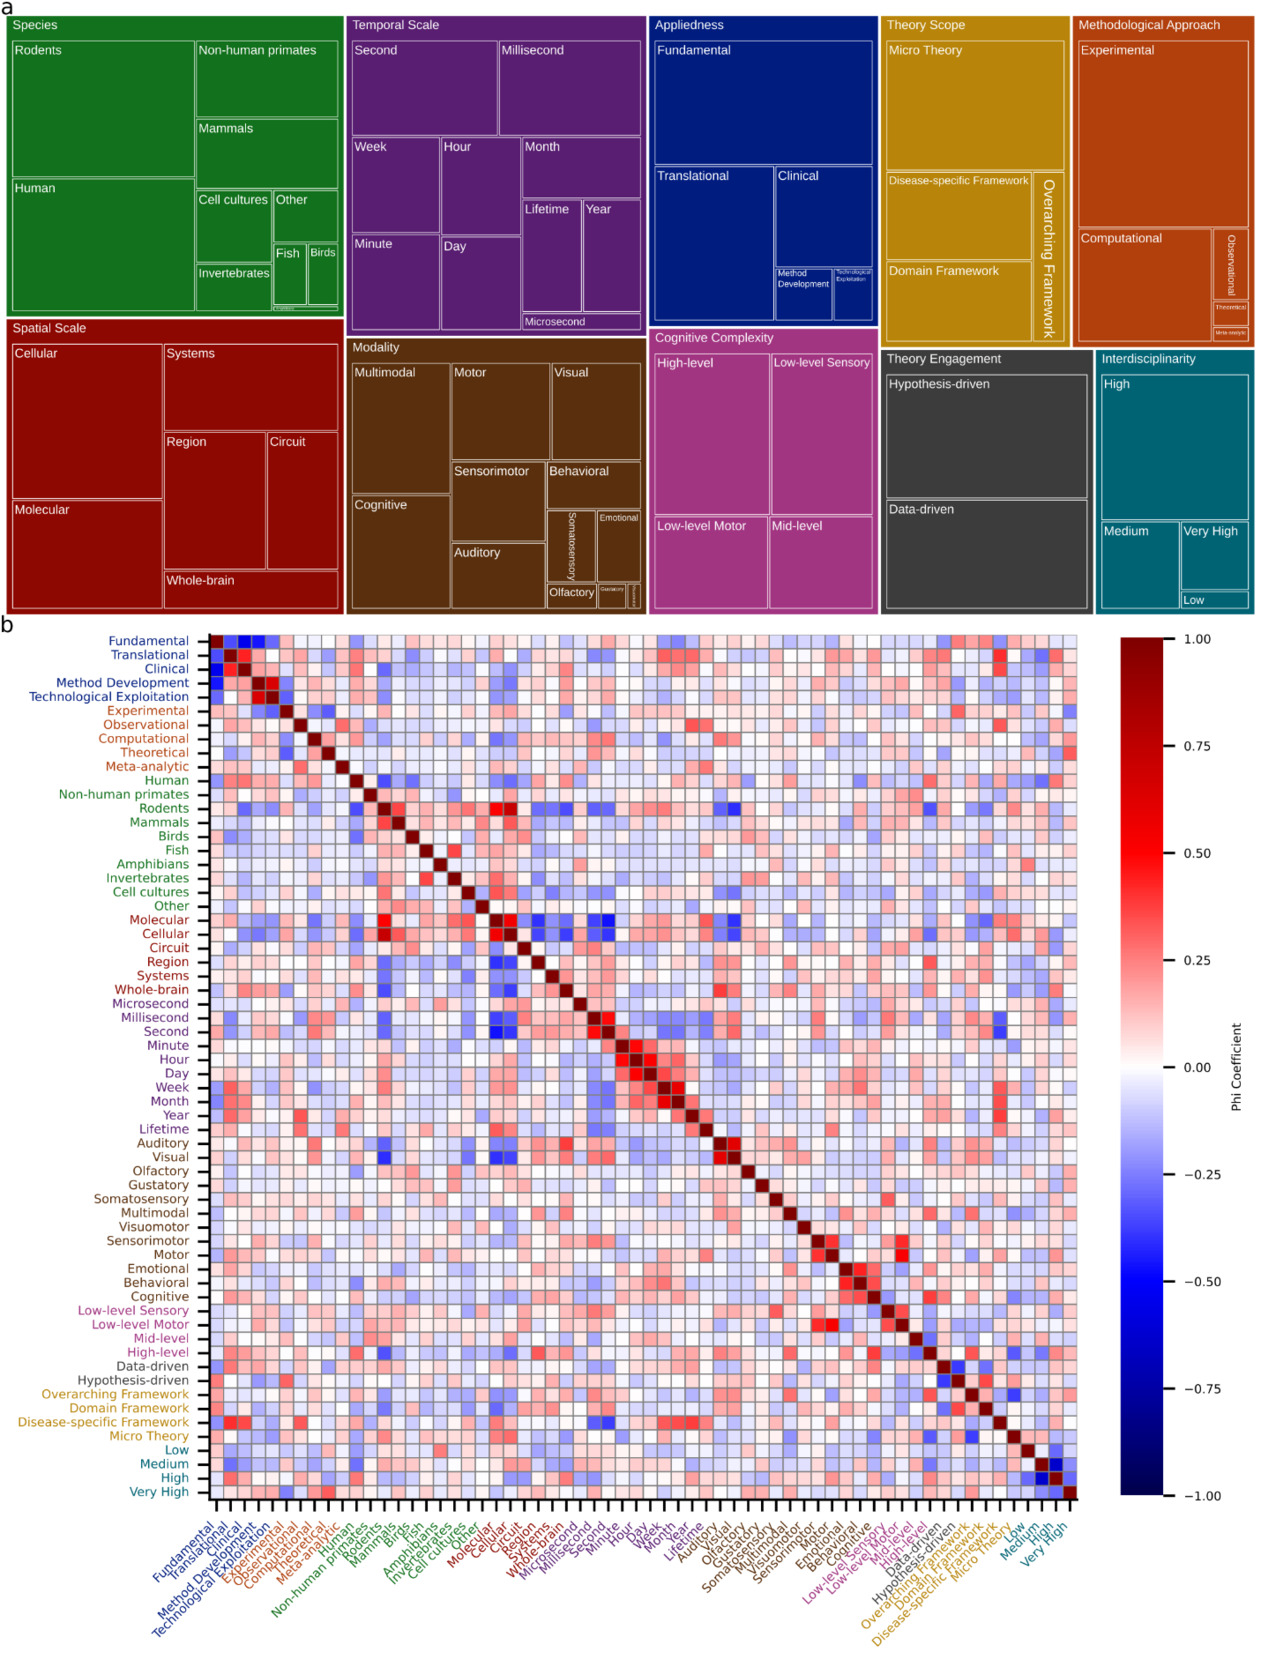
I next sought to understand the extent to which categories co-occur by examining the Matthews correlation (phi) coefficient between pairs of categories (Figure 3b). The Matthews phi coefficient is the Pearson correlation coefficient estimated for two binary variables.30 Please note that all reported p-values are Bonferroni corrected for multiple comparisons. Focusing first on spatial and temporal scales, it can be observed that molecular- and cellular-level investigations frequently go hand in hand (φ = 0.5502, t(173) = 8.667, p << 0.0001). By contrast, both molecular and cellular scales are negatively correlated with regional scale (φ = –0.4048, t(173) = –5.822, p << 0.0001 and φ = –0.3631, t(173) = –5.126, p = 0.00148, respectively). The cellular scale also exhibits a negative correlation with the whole-brain scale (φ = –0.3773, t(173) = –5.359, p = 0.000497). Given that other correlations among spatial scales are not significant, this suggests a separation of the micro from the meso and macro scales. For temporal scales the interesting pattern emerges that neighboring scales are significantly correlated. For example, minute and hour exhibit a correlation of 0.4880 (t(173) = 7.353, p << 0.0001) and hour and day a correlation of 0.5142 (t(173) = 7.887, p << 0.0001). Only the consecutive pair of second and minute does not exhibit a significant correlation. This suggests that temporal scales are bridged through pairwise interactions rather than collectively. Interestingly, the molecular spatial scale is positively associated with the lifetime temporal scale (φ = 0.3144, t(173) = 4.356, p = 0.04262). Otherwise, fast temporal scales are negatively associated with small spatial scales (molecular – second: φ = –0.4640, t(173) = –6.890, p << 0.0001; cellular – millisecond: φ = –0.3131, t(173) = –4.337, p = 0.04622; cellular – second: φ = –0.3968, t(173) = –5.686, p = 0.000102; molecular – millisecond: φ = –0.3734, t(173) = –5.294, p = 0.0006745).
Lastly, I examined how appliedness and theoretical scope interrelate. Notably, there is a sharp division between fundamental and all forms of applied research. Specifically, fundamental research is significantly anticorrelated with clinical (φ = –0.5496, t(173) = –8.6535, p << 0.0001), translational (φ = –0.3441, t(173) = –4.8206, p = 0.00587), and method development (φ = –0.4553, t(173) = –6.7260, p << 0.0001) approaches. At the same time, translational and clinical research (φ = 0.4321, t(173) = 6.3024, p << 0.0001) and method development and technological exploitation (φ = 0.6530, t(173) = 11.3418, p << 0.0001) are positively associated. For theoretical scope, there is a negative correlation between micro theories and overarching theoretical frameworks (φ = –0.3752, t(173) = –5.3234, p = 0.000588). Perhaps unsurprisingly, both clinical and translational research is positively associated with work utilizing disease-specific theories (clinical: φ = 0.3539, t(173) = 4.9763, p = 0.00293; translational: φ = 0.4082, t(173) = 5.8821, p << 0.0001).
Emerging Trends and Developments
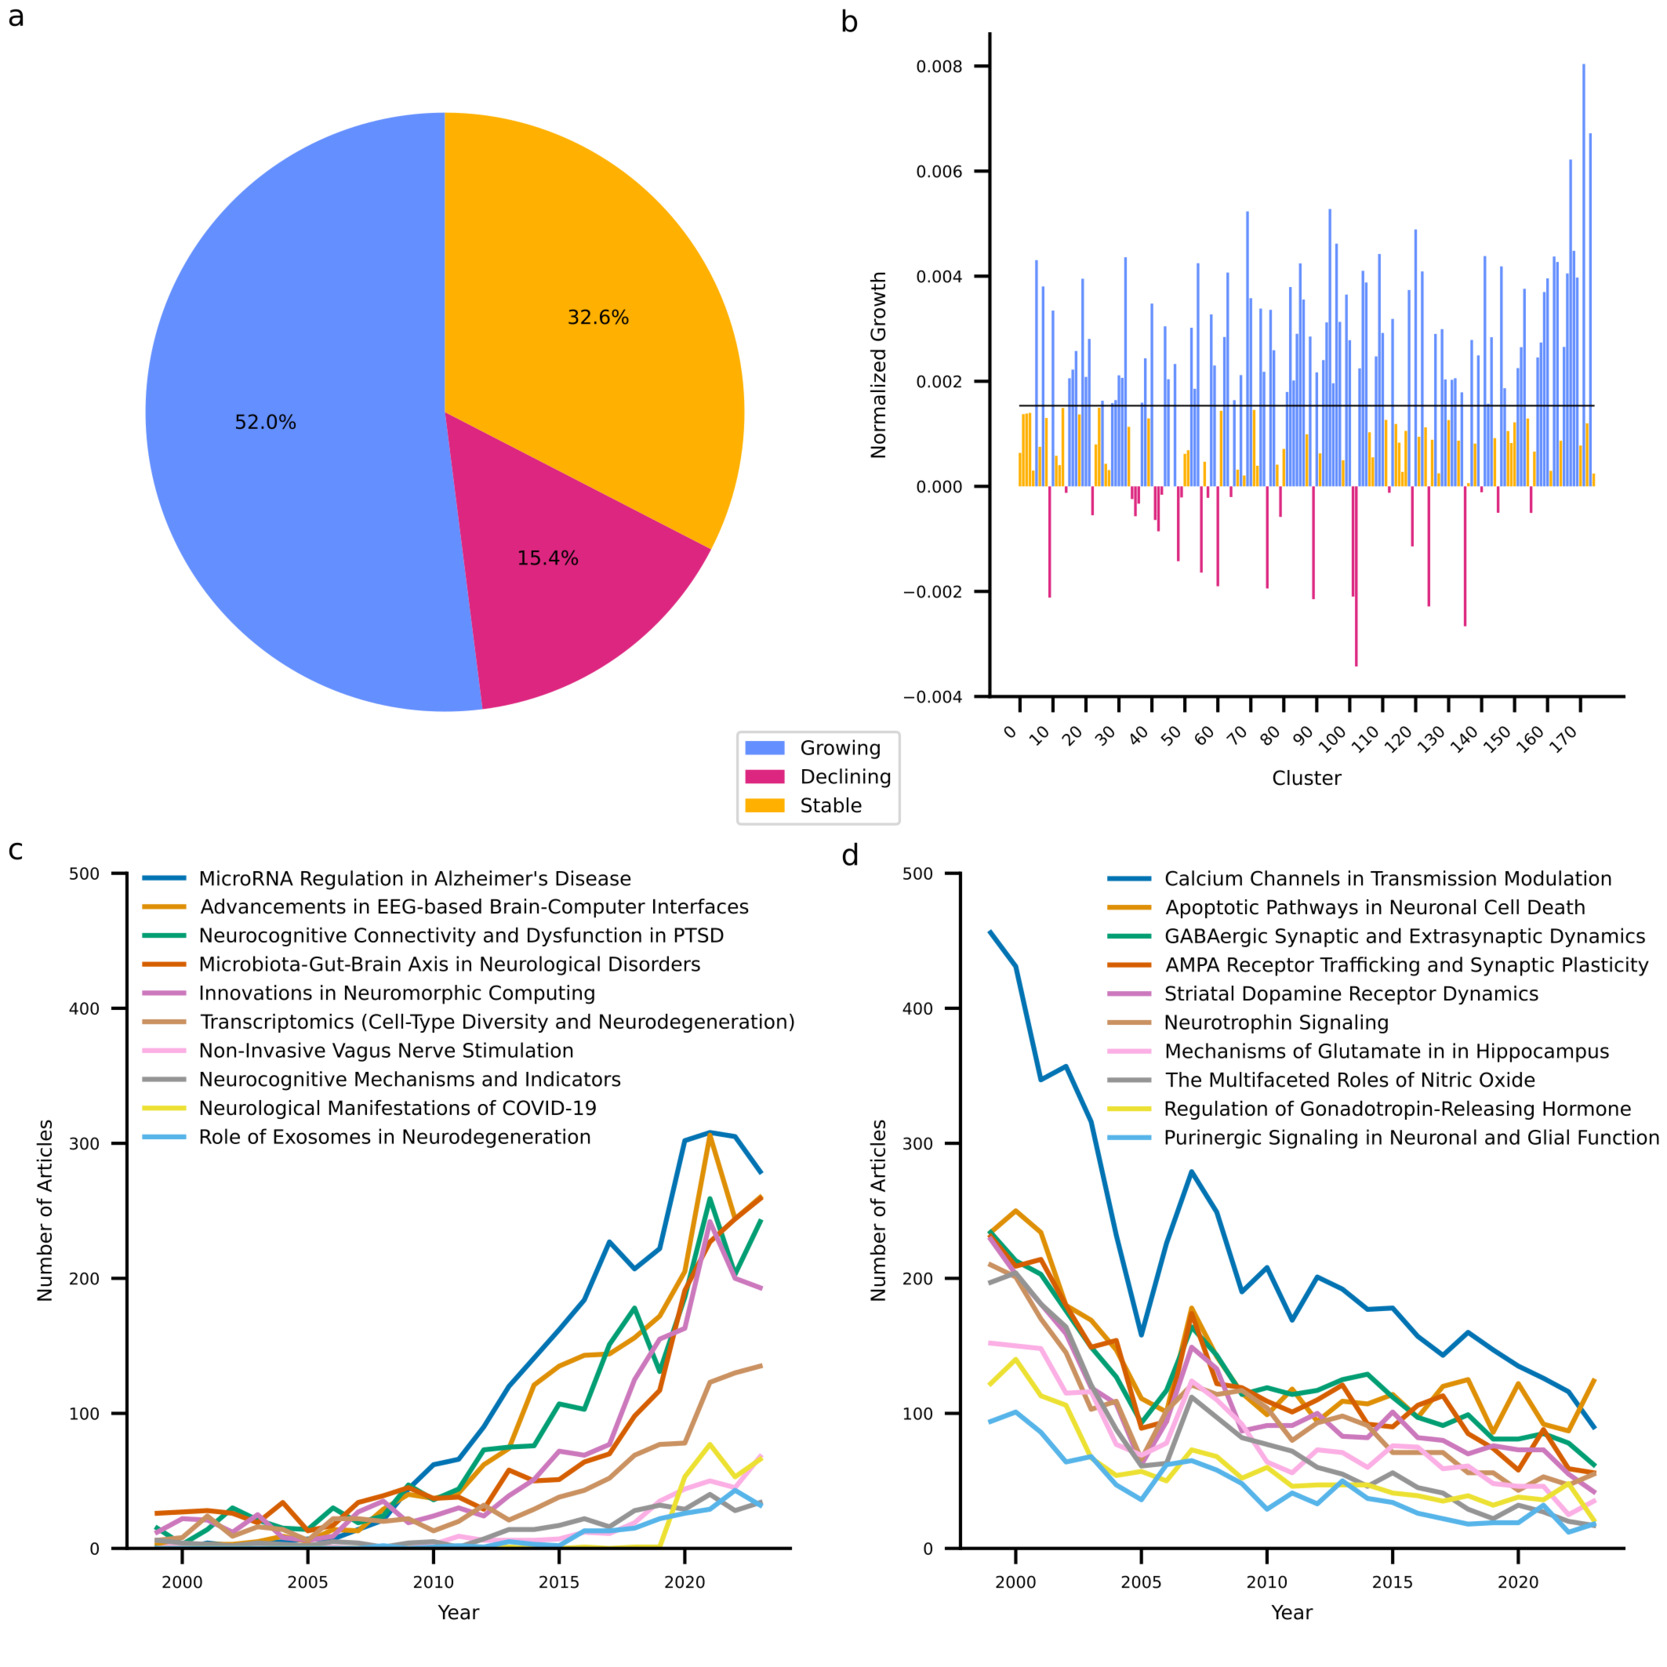
My last goal was to identify research trends in neuroscience. At the individual cluster level, I examined growth trends in terms of the size-adjusted annual growth rate, which quantifies the yearly increase in article count for each cluster relative to its total number of articles. Figure 4 summarizes the results and shows that a majority (52.0%) of clusters have increased their output above what is expected based on increases in output of the entire discipline. One third of clusters exhibit stable output as they neither decline nor exceed the growth of the discipline. It must be acknowledged that depending on their exact growth rate, these clusters may be considered to exhibit a relative decline as their growth is outpaced by that of the discipline. Finally, 15.4% of clusters exhibit an absolute decline in their output. Notably, the SARS-CoV-2 cluster is among the ten fastest growing clusters. Generally, it appears that growing clusters share a strong applied focus and target overarching themes such as neurodegeneration (clusters 69 and 141), neuromodulation (clusters 167 and 168), and technological advancements in neuroscience (clusters 94 and 120). By contrast, declining clusters reflect predominantly fundamental research with a focus on receptor dynamics (clusters 9, 55, 60, 75, 89, 101, 124, and 135) and signaling pathways (clusters 48 and 102). These extremes of the spectrum reflect larger trends across clusters. While clusters containing fundamental research together are growing at a compound annual growth rate of 1.89%, this is less than the growth exhibited by neuroscience globally (2.39%). By contrast, clusters involving translational research, clinical research, method development, and technological exploitation exhibit compound annual growth rates of 3.57%, 4.78%, 7.51%, and 7.80%, respectively.
I followed up on these quantitative analyses with a more in-depth, qualitative, analysis of recent trends in neuroscience. First, I investigated the evolving themes within each research cluster by randomly selecting up to 100 articles published between 2010 and 2021, along with the top 100 cited articles from the same clusters since 2021. These selections were analyzed using an LLM with the objective of identifying both emerging and declining thematic and methodological trends. Furthermore, for each cluster, I curated five review articles published in 2023 (part of the dataset) or 2024 and concurrently submitted all full articles to the LLM to synthesize the major open questions highlighted therein. Researchers in each domain can find specific current trends and key open questions in Supplementary Table 4. To develop a more holistic understanding of overarching trends, I aggregated all cluster-specific trends and questions and tasked the LLM with identifying overarching trends, transcendental questions, and necessary developments to move the field forward. These results are summarized in table 1. Trends, questions and developments are predominantly aligned with applied research. This is consistent with the growth patterns of the research clusters, where applied areas are experiencing increased output. Notably, there is an absence of calls to develop or test theoretical frameworks. This does not imply that such efforts are absent in neuroscience, but they are less prominent relative to other trends.
Discussion
The present study provides a comprehensive, data-driven mapping of the evolving landscape of neuroscience, serving as a large-scale analysis of knowledge production and community structure within a major scientific field. Neuroscience publishing has expanded steadily31 with broad neuroscientific journals as primary outlets. Research articles consistently outnumber reviews. The latter, however, exhibits higher citation rates. The journals with the highest impact thus unsurprisingly comprise review-focused neuroscientific journals, but also high-prestige multidisciplinary journals. A clustering analysis identified 175 distinct research domains with diverse themes such as neuropathic pain, neural underpinnings of consciousness, and EEG-based brain-computer interfaces. While several clusters are devoted to specific diseases, modalities, methods, and cognitive function, notably not a single cluster is dedicated to a theoretical framework.
An analysis of the cluster-level citation network revealed that most clusters integrate and spread insights from diverse research domains. The prevalence of high external citation rates points to a scientific culture that is highly interdisciplinary and collaborative. This suggests a self-organized ecosystem where researchers recognize that the complexity of the brain necessitates both depth, achieved through specialized clusters, and breadth, achieved by leveraging tools and insights from external domains. This interdependence likely bolsters the health of the discipline by preventing the formation of stagnant echo chambers. Indeed, highly specialized clusters that remain largely isolated from the broader research landscape, such as cluster 150 focusing on thyroid hormones and vitamin D in neurodevelopment, appear to be rare exceptions. Instead, several hub clusters exist that play a central role in shaping neuroscience by providing methodological and conceptual foundations. For example, a cluster focusing on dynamic functional connectivity in resting state fMRI appears to provide methodological groundwork for research investigating functional connectivity in disease. Similarly, a cluster focusing on the molecular mechanisms of plasticity provides fundamental insights for work on specific plasticity pathways. However, this centralization implies that the health of the field may heavily rely on these key hubs. Network science has shown that while hub-dominated networks are resilient to random failures, they are disproportionately vulnerable to targeted disruptions or the failure of hubs.32 Consequently, if the foundational methods or concepts underpinning these hubs were to face a crisis of replicability or validity, it could have cascading effects across the many clusters that rely on them. This dynamic was notably illustrated by historical debates regarding fMRI statistical validity and reproducibility.33–35 Crucially, rather than destabilizing the field, these challenges catalyzed a shift toward improved statistical rigor, data standardization, and reproducible workflows.36,37 This adaptive response further underscores the good health of the discipline in this regard, illustrating how the integrated nature of neuroscience facilitates the incorporation of expertise from statisticians, physicists, and neuroinformatics experts to resolve complex methodological challenges.
The dimensional analysis of neuroscientific research reveals that the field is predominantly experimental, with both hypothesis-driven and data-driven approaches. While computational work is prevalent, theoretical work remains limited. Furthermore, the field tends to employ micro theories more than overarching theoretical frameworks. This observation aligns with the lack of theory-focused clusters. Additionally, neuroscience exhibits clear structural divides, including a sharp distinction between fundamental and applied research and a separation of micro- and macro-level spatial scales. Interestingly, temporal scales are pairwise, but never fully integrated. Finally, a trends analysis revealed that neurosciences exhibit a shift towards more applied and translational research, with growing clusters focusing on neurodegeneration, neuromodulation, and technological advancements, while traditionally dominant fundamental research areas, such as receptor dynamics and intracellular signaling pathways, are in decline. The rapid growth of the SARS-CoV-2 cluster indicates that neuroscience is quick to respond to global events.
Overall, neuroscience appears to be thriving as it maintains high output across diverse topics ranging from neurodegenerative diseases, neuromodulation, cognitive functions, to technological advances. Despite this diversity, neuroscience achieves a high level of knowledge exchange across its domains. The field currently exhibits a good balance between hypothesis-driven and data-driven approaches and between fundamental and applied research. However, growth trends show that fundamental research is losing ground. The underlying reasons for this remain unclear. This could simply reflect a natural progression, where certain foundational questions have been sufficiently addressed, allowing researchers to pivot more towards applications.
Alternatively, it might reflect structural changes in funding architectures and incentive environments. Over the past two decades, the National Institutes of Health (NIH) has invested heavily in large-scale translational, clinical, and neurotechnology-oriented infrastructures intended to accelerate the movement of discoveries from bench to bedside and to develop advanced tools and platforms.38 In neuroscience, this includes sustained investment in technology- and platform-driven initiatives such as the BRAIN Initiative39 and programs that accelerate neurotechnology translation, such as Blueprint MedTech.40 A similar emphasis on translational impact and neurotechnology characterizes China’s Brain Science and Brain-Inspired Intelligence initiative41 and Japan’s Brain/MINDS program.42 These investments can reshape the research landscape by increasing the visibility and perceived career security of applied and technology-driven work, even when support for basic research persists. Indeed, the National Institute of Neurological Disorders and Stroke (NINDS) has documented that funding for strictly fundamental neuroscience fell from ~52% to ~27% of the budget between 1997 and 2012 because fewer applications were submitted rather than an explicit policy to defund fundamental research.43 In response, NINDS has explicitly sought to counterbalance these dynamics by reaffirming support for fundamental neuroscience, including through public “Back to Basics” messaging and dedicated funding announcements.43 In Europe, the European Research Council (ERC) pursues a complementary strategy by structurally insulating frontier research through bottom-up, excellence-only evaluation for its main grants, while confining application-bridging mechanisms to downstream add-ons.44 These observations suggest that shifts toward applied research arise from the interaction between large-scale programmatic investments, incentive signaling, and investigator submission behavior. Addressing potential erosion of fundamental research may therefore not primarily require additional dedicated funding, but rather clearer and more credible signaling of long-term institutional commitment to fundamental research. Simultaneously, universities and research institutions can play an important role by reducing the career-risk associated with fundamental work. For example, by explicitly valuing theory and framework contributions in hiring and promotion as well as by providing internal bridge funding during periods of grant transition.
Neuroscience spans all levels of organization, from molecular and cellular studies to whole-brain dynamics. However, integration across spatiotemporal scales remains limited. There is, for instance, a clear divide between small and large spatial scales. Additionally, temporal scales are only integrated in a pairwise manner, leaving connections between different timescales indirect. An important question is whether these divisions reflect a meaningful organizational principle of the brain. Processes unfolding at certain scales may simply not be relevant for understanding processes at other scales as each constitutes a self-contained system whose governing principles, despite emerging from smaller scales, nevertheless operate independently.45,46 For example, understanding network dynamics in large-scale brain activity may not require understanding how they arise from individual neuronal processes. If this is the case, neuroscience may need to develop better theoretical models to formalize and justify these separations. Alternatively, the divide between research at different scales may simply be a byproduct of disciplinary specialization. In that case neuroscientists should explore systematic ways to more comprehensively bridge spatial and temporal scales. The development of standardized methods to analyze multi-modal datasets at different levels of neural organization will be essential for this.47–49 Additionally, computational modeling may offer a means to connect findings across scales (or functional capacities) and to reveal unifying principles,50,51 or alternatively to help formalize and justify the separation of scales as an inherent principle of brain organization.
These considerations raise the question of what one might expect a theory to be in neuroscience. While the question of what constitutes a scientific theory remains not fully answered in philosophy of science,52–55 I will here adopt the notion that theories are frameworks that deploy reusable explanatory schemata within a defined scope. A theory thus has a scope, which is determined by the class of phenomena it is intended to explain,54,55 over which it provides unity in the form of common explanatory patterns that it applies across those phenomena.52,53 If scale separations turn out to be contingent rather than principled, it is conceivable that explanatory schemata with a very broad scope could be developed. Importantly, theoretical progress in neuroscience does not hinge on full cross-scale integration, but on articulating explanatory frameworks with clearly defined scope and explanatory principles. While there are prominent proposals for such explanatory frameworks (e.g., the Free Energy Principle or the Critical Brain Hypothesis), it appears that neuroscience largely remains in a phase of proliferating mechanistic explanations (micro-theories) without systematic abstraction of explanatory patterns. Historically, it is not uncommon for scientific fields to undergo such phases (e.g., homeostasis in physiology56; the operon model in gene regulation57). These phases can end when phenomena begin to get typed into families58 or when it gets realized that many mechanisms are isomorphic at a higher level of abstraction.59
While these developments cannot be achieved by deliberation alone, they can be facilitated by providing standard tasks, assays, atlases, preprocessing pipelines, benchmark datasets and model databases to make it easier to compare phenomena and mechanisms.60–63 The dataset compiled in this study together with the ability of LLMs to analyze vast amounts of text may provide additional assistance in this effort.64–66 For example, LLM-assisted analyses might be used to identify and subsequently group phenomena into candidate families or to identify and group recurring explanatory motifs from mechanistic accounts. The present dataset with its embedding space populated by a large corpus of scientific abstracts may not only enable identification of dense regions corresponding to established research domains, but also to probe sparsely populated regions representing unrealized combinations of concepts, methods and phenomena. Such regions could, for instance, be explored using optimization-based approaches that search for embeddings without corresponding publications and subsequently attempt to generate abstracts consistent with those embeddings. While this process may help surface unconventional hypotheses or suggest candidate explanatory schemata, it requires oversight by domain experts as it may also produce implausible or nonsensical research directions.
In conclusion, neuroscience is a thriving and interdisciplinary field, but recognizing and addressing its structural limitations is crucial for future progress. The findings of this study highlight that ensuring that fundamental research remains valued, greater integration across spatiotemporal scales, and increased theoretical synthesis could strengthen the field. If the observed separations across spatial and temporal scales are not merely practical limitations but reflect an inherent organizational principle of the brain, then neuroscience may need to reconsider its theoretical foundation. Rather than seeking a single all-encompassing framework, a more fruitful approach may be to explicitly acknowledge that different levels of neural organization operate under distinct governing principles. In this perspective theoretical frameworks should clearly define the scale at which they apply, and research efforts should prioritize understanding the mechanisms that allow for scale separation, as well as instances where cross-scale interactions are essential. Beyond neuroscience-specific insights, this work contributes to the broader field of meta-science or the science of science. The methods employed demonstrate the power of AI-driven computational techniques for curating and mapping scientific terrains. Understanding these general dynamics is critical for effective science policy and research management.
Author Contributions
M.S. conceived the study, designed the methodology, performed the data collection and analysis, interpreted the results, and wrote the manuscript.
Lead contact
Requests for further information and resources should be directed to and will be fulfilled by the lead contact, Mario Senden (mario.senden@maastrichtuniversity.nl).
Materials availability
This study did not generate new materials.
Data and code availability
All data and code supporting this study are publicly available. Data are available on Zenodo at https://doi.org/10.5281/zenodo.14865161, all code is available at https://github.com/ccnmaastricht/NeuroScape.git
Acknowledgments
I thank Arie H. van der Lugt, Gorka Zamora-Lopez, Gustavo Deco and Manuel Mello for their helpful comments on earlier versions of the manuscript. This research did not receive any specific grant from funding agencies in the public, commercial, or not-for-profit sectors.
Declaration of generative AI and AI-assisted technologies
I utilized OpenAI’s o1 (o1-2024-12-17) large language model to enhance the articles’ language and readability. I carefully reviewed, edited, and revised the response and take ultimate responsibility for the content of this work.
Conflicts of Interest
The author declares no competing interests.