
Introduction
Spinal muscular atrophy (SMA) is a rare, inherited neuromuscular disorder characterized by degeneration of anterior horn cells, resulting in progressive muscle weakness and atrophy. SMA is most commonly caused by a homozygous deletion of the survival motor neuron 1 (SMN1) gene on chromosome 5q, leading to depletion of the SMN protein which is critical for motor neuron survival and function.1 Disease severity is influenced by the number of copies of SMN2, a paralogous gene, with fewer copies associated with an earlier onset and more severe phenotype.1 SMA manifests across a clinical spectrum encompassing five main types (types 0-4), historically classified by the age at symptom onset and achievement of developmental milestones. Recent advancements in disease-modifying therapies, such as SMN-enhancing drugs and gene therapy, have markedly improved outcomes for individuals with SMA. However, currently available treatments are not curative and for many patients, challenges related to motor function remain prominent.2
While the involvement of the peripheral nervous system in SMA pathogenesis is well-established, emerging evidence increasingly points to brain involvement in the disease. Several studies have documented a higher prevalence of macrostructural brain abnormalities in individuals with SMA compared to their typically developing peers.3 Notably, SMA patients demonstrated significantly smaller volumes of cerebellar lobules 8, 9, and 10,4 as well as reduced cortical thickness of the precentral gyri relative to healthy controls.5 Structural changes have also been identified in non-motor cortical areas and subcortical structures, suggesting that SMA pathology extends beyond motor neurons.5 Nonetheless, these structural differences remain poorly understood, and the impact of early motor unit dysfunction on brain connectivity in SMA is unexplored. Increasing evidence of neurodevelopmental comorbidities in SMA patients further emphasizes the need to investigate potential alterations in functional connectivity (FC) associated with the condition.6
Functional magnetic resonance imaging (fMRI) is a non-invasive neuroimaging technique that measures temporal fluctuations in blood oxygen level-dependent (BOLD) signals, providing an indirect measure of neural activity. The high spatial resolution of fMRI, coupled with its ability to assess FC between brain regions, has established it as an invaluable tool for investigating disruptions in brain networks associated with neuromuscular disorders.7 Resting-state fMRI (rs-fMRI), which captures spontaneous brain activity in the absence of task engagement, is particularly advantageous for studying conditions associated with motor impairments, including in the pediatric population. Multiple resting-state networks, including the default mode (DMN), sensorimotor, and salience networks, have been identified using rs-fMRI.8–11 These networks consist of spatially distinct but functionally connected brain regions that display highly synchronized activity during rest, reflecting the brain’s intrinsic functional architecture and communication systems. In particular, the salience network is responsible for shifting attention between internal states, regulated by the DMN, and external stimuli or tasks, mediated by the frontoparietal network.8 Prior fMRI studies have revealed altered resting-state functional connectivity (rsFC) within the cerebellum, sensorimotor, and salience networks in children with spastic and dyskinetic cerebral palsy.12 Differences in rsFC have also been reported in motor and extra-motor networks in patients with motor neuron diseases such as amyotrophic lateral sclerosis (ALS) and primary lateral sclerosis (PLS), relative to healthy controls.13,14 Similarly, in Duchenne muscular dystrophy (DMD), rs-fMRI has highlighted changes in sensorimotor integration and hyperconnectivity within the DMN and executive control network, abnormalities that are closely linked to cognitive impairments.15,16
These findings underscore the utility of rs-fMRI in characterizing central nervous system involvement in disorders traditionally thought to primarily affect the peripheral nervous system. Leveraging similar approaches in SMA may deepen our understanding of motor network connectivity to identify therapeutic targets for adjunctive interventions, ultimately enhancing quality of life in affected individuals. Therefore, this study aimed to investigate differences in rsFC between individuals with SMA and peer controls. We hypothesized that motor and non-motor network connectivity would differ between individuals with SMA and typically developing peers, and that differences in FC would correlate with disease severity, as reflected by motor function scores, SMN2 copy number, and SMA type.
Methods
Participants
We conducted a cross-sectional case control study of children and adults with SMA, and normally developing peers matched by age at MRI (year of birth) and sex. Given the exploratory nature of the study, we aimed to recruit a convenience sample of 40 participants (20 SMA patients and 20 controls). Recruitment was conducted in the Greater Montreal Area through the McGill University Health Centre Research Institute, and in Calgary through the Alberta Children’s Hospital.
Participants in the SMA group were aged 5 to 45 years, had a confirmed genetic diagnosis of 5q SMA with 2-4 copies of the SMN2 gene, and could have received any form of disease-modifying therapy. Controls were considered typically developing if they had no history of developmental or neurological conditions and had not received rehabilitation or special education services during childhood or adolescence. Participants with (1) any other neurodevelopmental, neurogenetic, or acquired central nervous system condition; (2) contraindications to MRI or inability to comply with study procedures without sedation; or (3) dependence on permanent ventilatory support were excluded from the study. The Research Ethics Board at both participating centers approved this study, and informed consent was obtained from all participants or their parents/guardians, as appropriate.
Data collection
Demographic and clinical data were collected through a structured chart review. For patients who had received multiple disease-modifying therapies, the first treatment administered was recorded. A trained physiotherapist assessed motor function in SMA patients, but not controls, using the Hammersmith Functional Motor Scale Expanded (HFMSE)17 and the Revised Upper Limb Module (RULM)18 prior to the MRI. However, if a comprehensive physical assessment had been performed within three months of the imaging study, the motor scores from that evaluation were used instead of conducting a new assessment.
MRI acquisition
Resting-state fMRI data and T1-weighted imaging were acquired using one of two 3T MRI systems. Participants from Montreal, including both SMA patients and peer controls, were scanned using a Philips Achieva X system (Philips Healthcare, Best, Netherlands) with a 32-channel head coil. All scans were acquired between July 2021 and June 2023. Participants from Calgary, including both SMA patients and peer controls, were scanned using a GE MR750w system (GE Healthcare, Chicago, IL, USA), also with a 32-channel head coil. One control participant was scanned in 2017, while all other participants were scanned between April and August 2023. There were no scanner upgrades during the study period at either site.
For T1-weighted imaging, the parameters in Montreal were: TE/TR = 3.5/7.9 ms, flip angle = 8°, 170 sagittal slices with a field of view of 256 × 204 mm, an acquisition matrix of 256 × 203, and a voxel acquisition size of 1.0 mm isotropic. In Calgary, the parameters were: TE/TR = 3.2/8.5 ms, flip angle = 11°, 166 axial slices with a field of view of 256 x 256mm, an acquisition matrix of 256 × 256, and a voxel size of 1.0 mm isotropic.
Resting-state BOLD fMRI data was subsequently acquired using a T2*-weighted single-shot gradient echo planar imaging pulse sequence (150 volumes for a total duration of 5 minutes). In Montreal, the parameters were: TE/TR = 30/2000 ms, flip angle = 90°, 36 transverse-axial slices with field of view = 230 mm x 230 mm, acquisition matrix = 64 x 63, and voxel acquisition size 3.6 mm isotropic. In Calgary, the parameters were identical, except for the acquisition matrix, which was set to 64 x 64. During scanning, participants were instructed to focus on a centrally displayed cross without concentrating on anything specific.
fMRI data processing
Functional analyses were performed using the Functional Connectivity Toolbox CONN19 (release 22.a)20 in SPM12 (Statistical Parametric Mapping, Functional Imaging Laboratory, UCL London; https://www.fil.ion.ucl.ac.uk/spm) running on MATLAB (version R2023a, MathWorks, Natick, Massachusetts).
Preprocessing
Functional and anatomical data were preprocessed using a flexible preprocessing pipeline21 including realignment with correction of susceptibility distortion interactions, outlier detection, direct segmentation and Montreal Neurological Institute (MNI) space normalization, and smoothing. Functional data were realigned using Statistical Parametric Mapping (SPM) realign & unwarp procedure,22 where all scans were co-registered to a reference image (first scan of the first session) using a least squares approach and a 6 parameter (rigid body) transformation,23 and resampled using b-spline interpolation to correct for motion and magnetic susceptibility interactions. Potential outlier scans were identified using Artifact Detection Tools24 as acquisitions with framewise displacement above 0.9 mm or global BOLD signal changes above 5 standard deviations,25 and a reference BOLD image was computed for each participant by averaging all scans excluding outliers. Only one participant had more than 50 outlier volumes out of 150 total volumes (mean 5.3 outliers, standard deviation 12.9; range 0-68), thus retaining at least 100 volumes for all but one participant. Excluding this participant from the seed-to-voxel analyses yielded similar results, with all seed-cluster pairs showing significant group differences in the original analysis remaining significant. Functional and anatomical data were normalized into standard MNI space, segmented into grey matter, white matter, and cerebrospinal fluid (CSF) tissue classes, and resampled to 2 mm isotropic voxels following a direct normalization procedure25 using SPM unified segmentation and normalization algorithm26 with the default IXI-549 tissue probability map template. Last, functional data were smoothed using spatial convolution with a Gaussian kernel of 8 mm full width half maximum.
Denoising
In addition, functional data were denoised using a standard denoising pipeline21 including the regression of potential confounding effects characterized by white matter timeseries (5 CompCor noise components), CSF timeseries (5 CompCor noise components), motion parameters and their first order derivatives (12 factors),27 outlier scans (below 68 factors),28 session effects and their first order derivatives (2 factors), and linear trends (2 factors) within each functional run, followed by bandpass frequency filtering of the BOLD timeseries29 between 0.008 Hz and 0.09 Hz. CompCor30 noise components within white matter and CSF were estimated by computing the average BOLD signal as well as the largest principal components orthogonal to the BOLD average, motion parameters, and outlier scans within each participant’s eroded segmentation masks. From the number of noise terms included in this denoising strategy, the effective degrees of freedom of the BOLD signal after denoising were estimated to range from 18.4 to 49.9 (average 39.4) across all participants.25
First-level analysis
Seed-based connectivity maps were estimated characterizing the patterns of FC with 164 high-priority candidate-independent component analysis networks20 and Harvard-Oxford atlas regions of interest.31 FC strength was represented by Fisher-transformed bivariate Pearson correlation coefficients from a weighted general linear model21 (GLM), defined separately for each pair of seed and target areas, modeling the association between their BOLD signal timeseries. In order to compensate for possible transient magnetization effects at the beginning of each run, individual scans were weighted by a step function convolved with an SPM canonical hemodynamic response function and rectified.
Group-level analyses
Group-level analyses were performed using a GLM.21 For each individual voxel, a separate GLM was estimated, with first-level connectivity measures at this voxel as dependent variables (one independent sample per participant), and groups or other subject-level identifiers as independent variables. Voxel-level hypotheses were evaluated using multivariate parametric statistics with random-effects across participants and sample covariance estimation across multiple measurements. Inferences were performed at the level of individual clusters (groups of contiguous voxels). Cluster-level inferences were based on parametric statistics from Gaussian Random Field theory using the smoothness estimated from second-level model residuals.21 Minimum cluster size threshold was set to k=50 voxels. Results were thresholded using a combination of a cluster-forming p<0.001 voxel-level threshold, and a familywise corrected p-false discovery rate (p-FDR)<0.05 cluster-size threshold.32
Regions of interest selection
Seed-to-voxel analyses were performed using 25 seeds of interest selected a priori based on functional relevance and previous literature. These included motor control areas (left and right precentral gyrus, supplementary motor area, caudate, putamen, cerebellar lobules 6, 8, 9, and 10), DMN regions (left and right lateral parietal cortex; medial prefrontal cortex; posterior cingulate cortex [PCC]), and salience network regions (left and right anterior insula, rostral prefrontal cortex; anterior cingulate cortex [ACC]). Motor network-related seeds were selected based on their central roles in mediating residual motor function and their susceptibility to alterations associated with progressive muscle weakness and atrophy. Prior studies have reported smaller cerebellar volumes and thinner cortex in precentral gyri of individuals with SMA compared to controls, findings that may be further informed by our exploration of FC.4 The DMN and salience network regions have also been reported to differ from controls in individuals with various motor neuron diseases, suggesting that alterations in non-motor networks may contribute to additional dysfunction.13,14
Differences in seed-based FC maps between individuals with SMA and controls were examined across the 25 pre-defined seeds, with site as a covariate, yielding a set of significant seed-cluster pairs, while some seeds showed no significant clusters. To control for multiple comparisons across seeds, p-values from all significant seed-cluster pairs were jointly entered into a Benjamini-Hochberg FDR correction. All reported seed-cluster pairs remained significant after this across-seed FDR correction. Twelve seed-cluster pairs with significant group differences were subsequently selected for further analysis, based on cluster size, functional relevance, and a preference for symmetry between the left and right hemispheres.
Statistical analysis
Statistical analyses were performed using IBM SPSS Statistics, Version 29.0. Distribution normality was determined using the Shapiro-Wilk test. Patient characteristics were compared between groups using the Mann-Whitney U tests for continuous variables, and the χ2 and Fisher’s Exact tests, as appropriate, for categorical variables. The connectivity between the 12 seed-cluster pairs identified on primary analysis, expressed as Fisher-transformed Pearson’s correlation coefficients, were assessed for correlation with motor function scores (HFMSE and RULM), SMN2 copy number, and SMA type using Spearman’s rho. The association with SMN2 copy number and SMA type were also evaluated using analysis of covariance (ANCOVA). Levene’s test was used to verify that the assumption of equality of variance had not been violated. Age at fMRI scan and site were used as co-variates in correlation analyses. For each clinical variable (HFMSE, RULM, SMN2 copy number, and SMA type), p-values derived from the correlation analyses across the 12 seed-cluster pairs were jointly entered into a Benjamini-Hochberg FDR correction to account for multiple comparison. Statistical significance threshold was set to p<0.05 (or corrected p-FDR<0.05).
Results
Participant characteristics
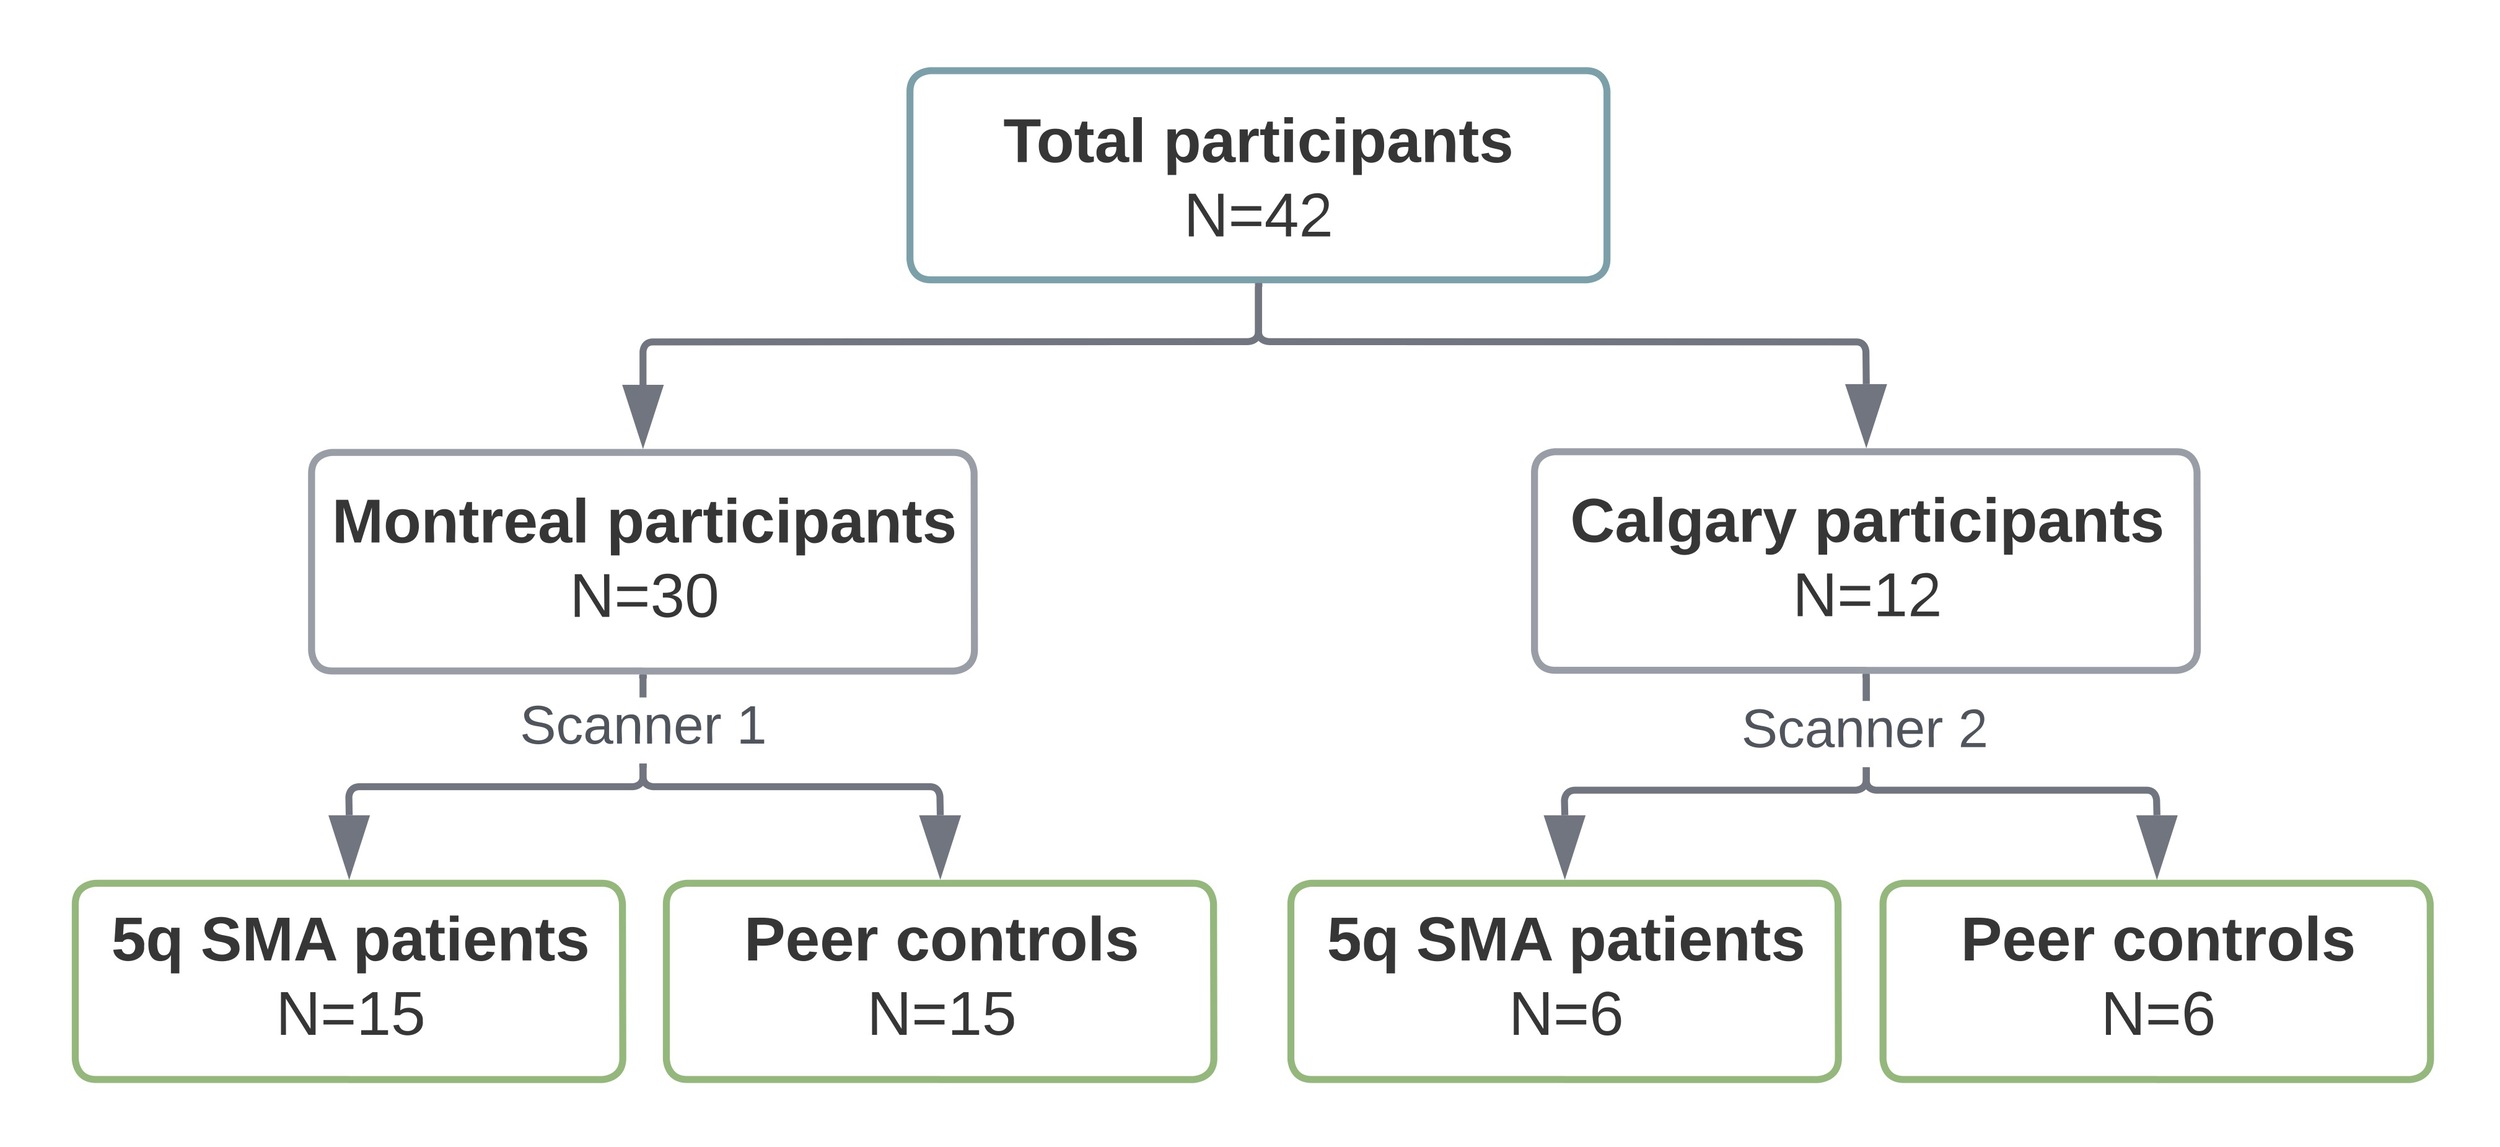
A total of 42 participants, 28 children and 14 adults, completed the study procedures (Figure 1). There were no differences in age, sex, or handedness between SMA patients and their peer controls (Table 1). The clinical characteristics and motor function assessments of the SMA group are detailed in Table 2. Type 2 SMA was the most common (9/21, 43%), followed by type 3 (8/21, 38%) and type 1 (4/21, 19%). All SMA patients received disease-modifying therapy. At the time of assessment, 5 of 21 (24%) individuals with SMA were independently ambulant.
Seed-based connectivity
Initially, 25 seeds of interest (motor, DMN, and salience network areas) were selected based on their relevance to SMA and findings from previous rs-fMRI studies in neuromuscular disorders.7,12,16 Seed-to-voxel analyses revealed no significant group differences in rsFC for the supplementary motor area, caudate, putamen, cerebellar lobules 8 and 9, and lateral parietal cortex seeds bilaterally, nor from the left cerebellar lobule 10, medial prefrontal cortex, and PCC seeds (Supplementary Table 1). In contrast, 10/25 seeds (40%) revealed significant differences in rsFC between SMA patients and typically developing peers, when controlling for site (corrected p-FDR<0.05). From these 10 seeds, 40 seed-cluster pairs were identified (Supplementary Table 2), and 12 were selected for further analysis, prioritizing those with the largest cluster sizes (>50 voxels), alignment with known literature for functional relevance, and symmetry, where findings mirrored across the right and left hemispheres.
Table 3 outlines the 12 selected seed-cluster pairs with significant differences in rsFC between SMA and control groups. FC was lower in individuals with SMA compared to peer controls across all pairs, except for the precentral gyri–PCC and precentral gyri–precuneus cortex pairs, where connectivity was higher in the SMA group.
Cerebellum
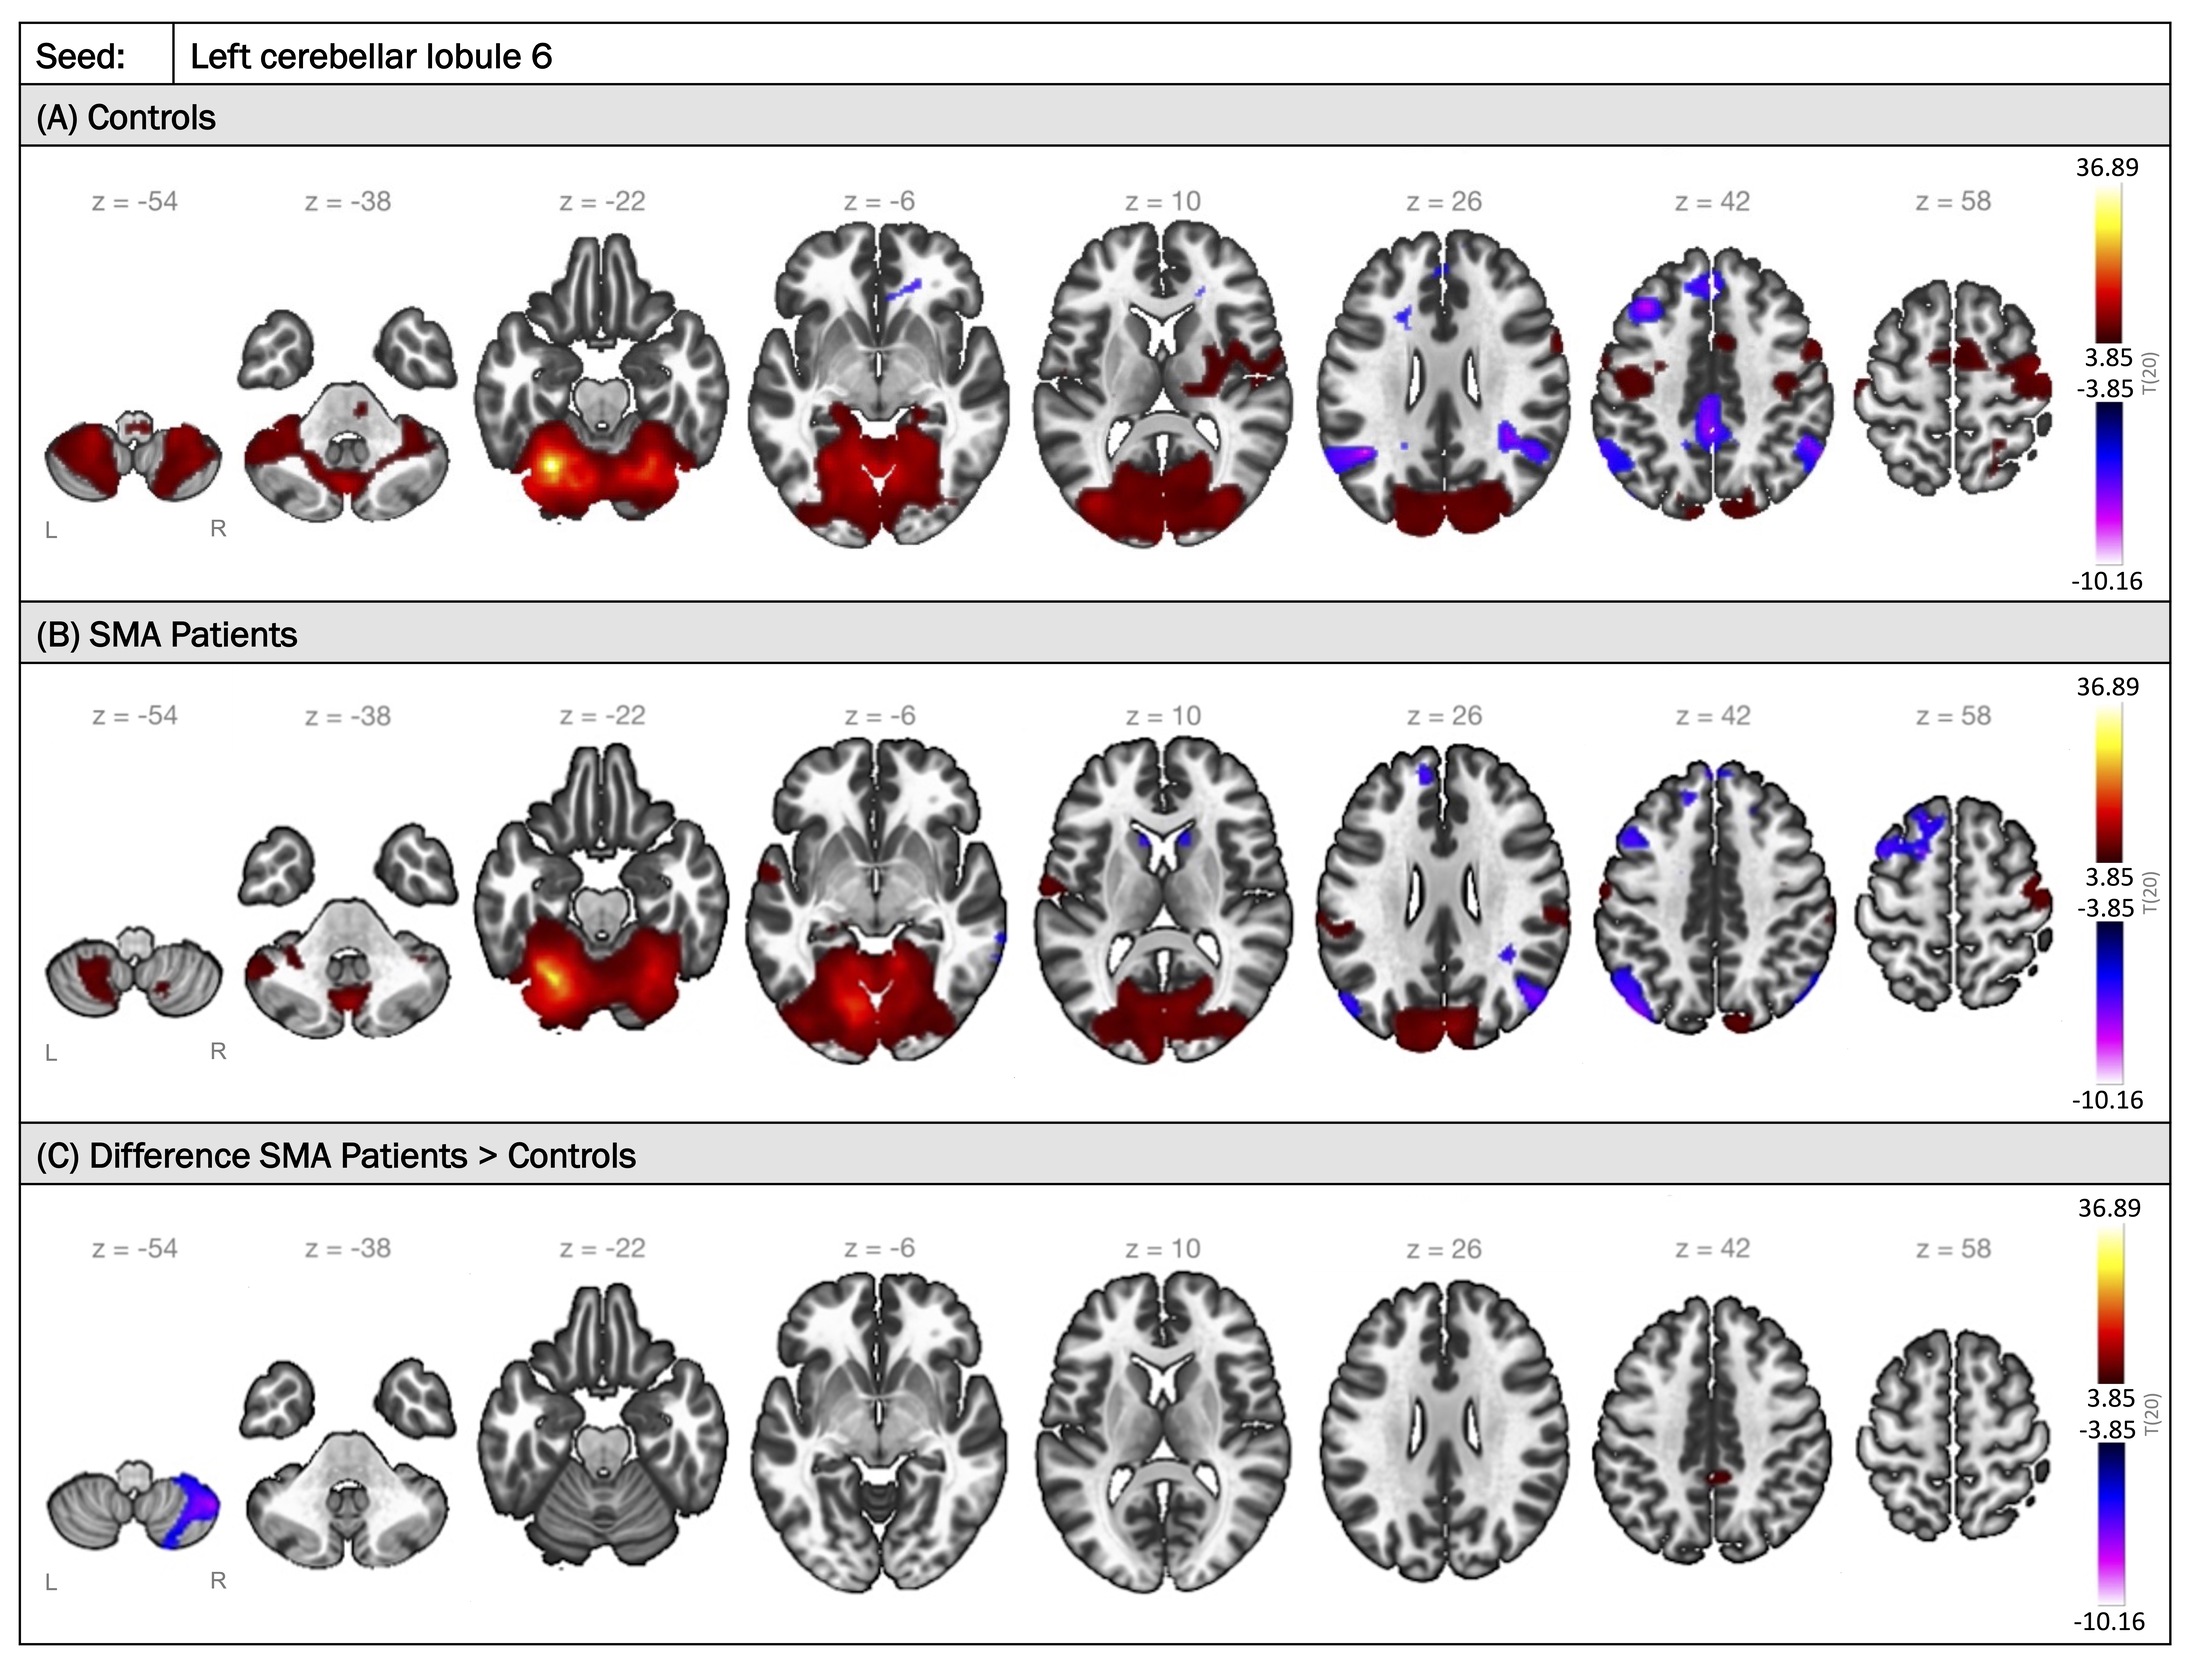
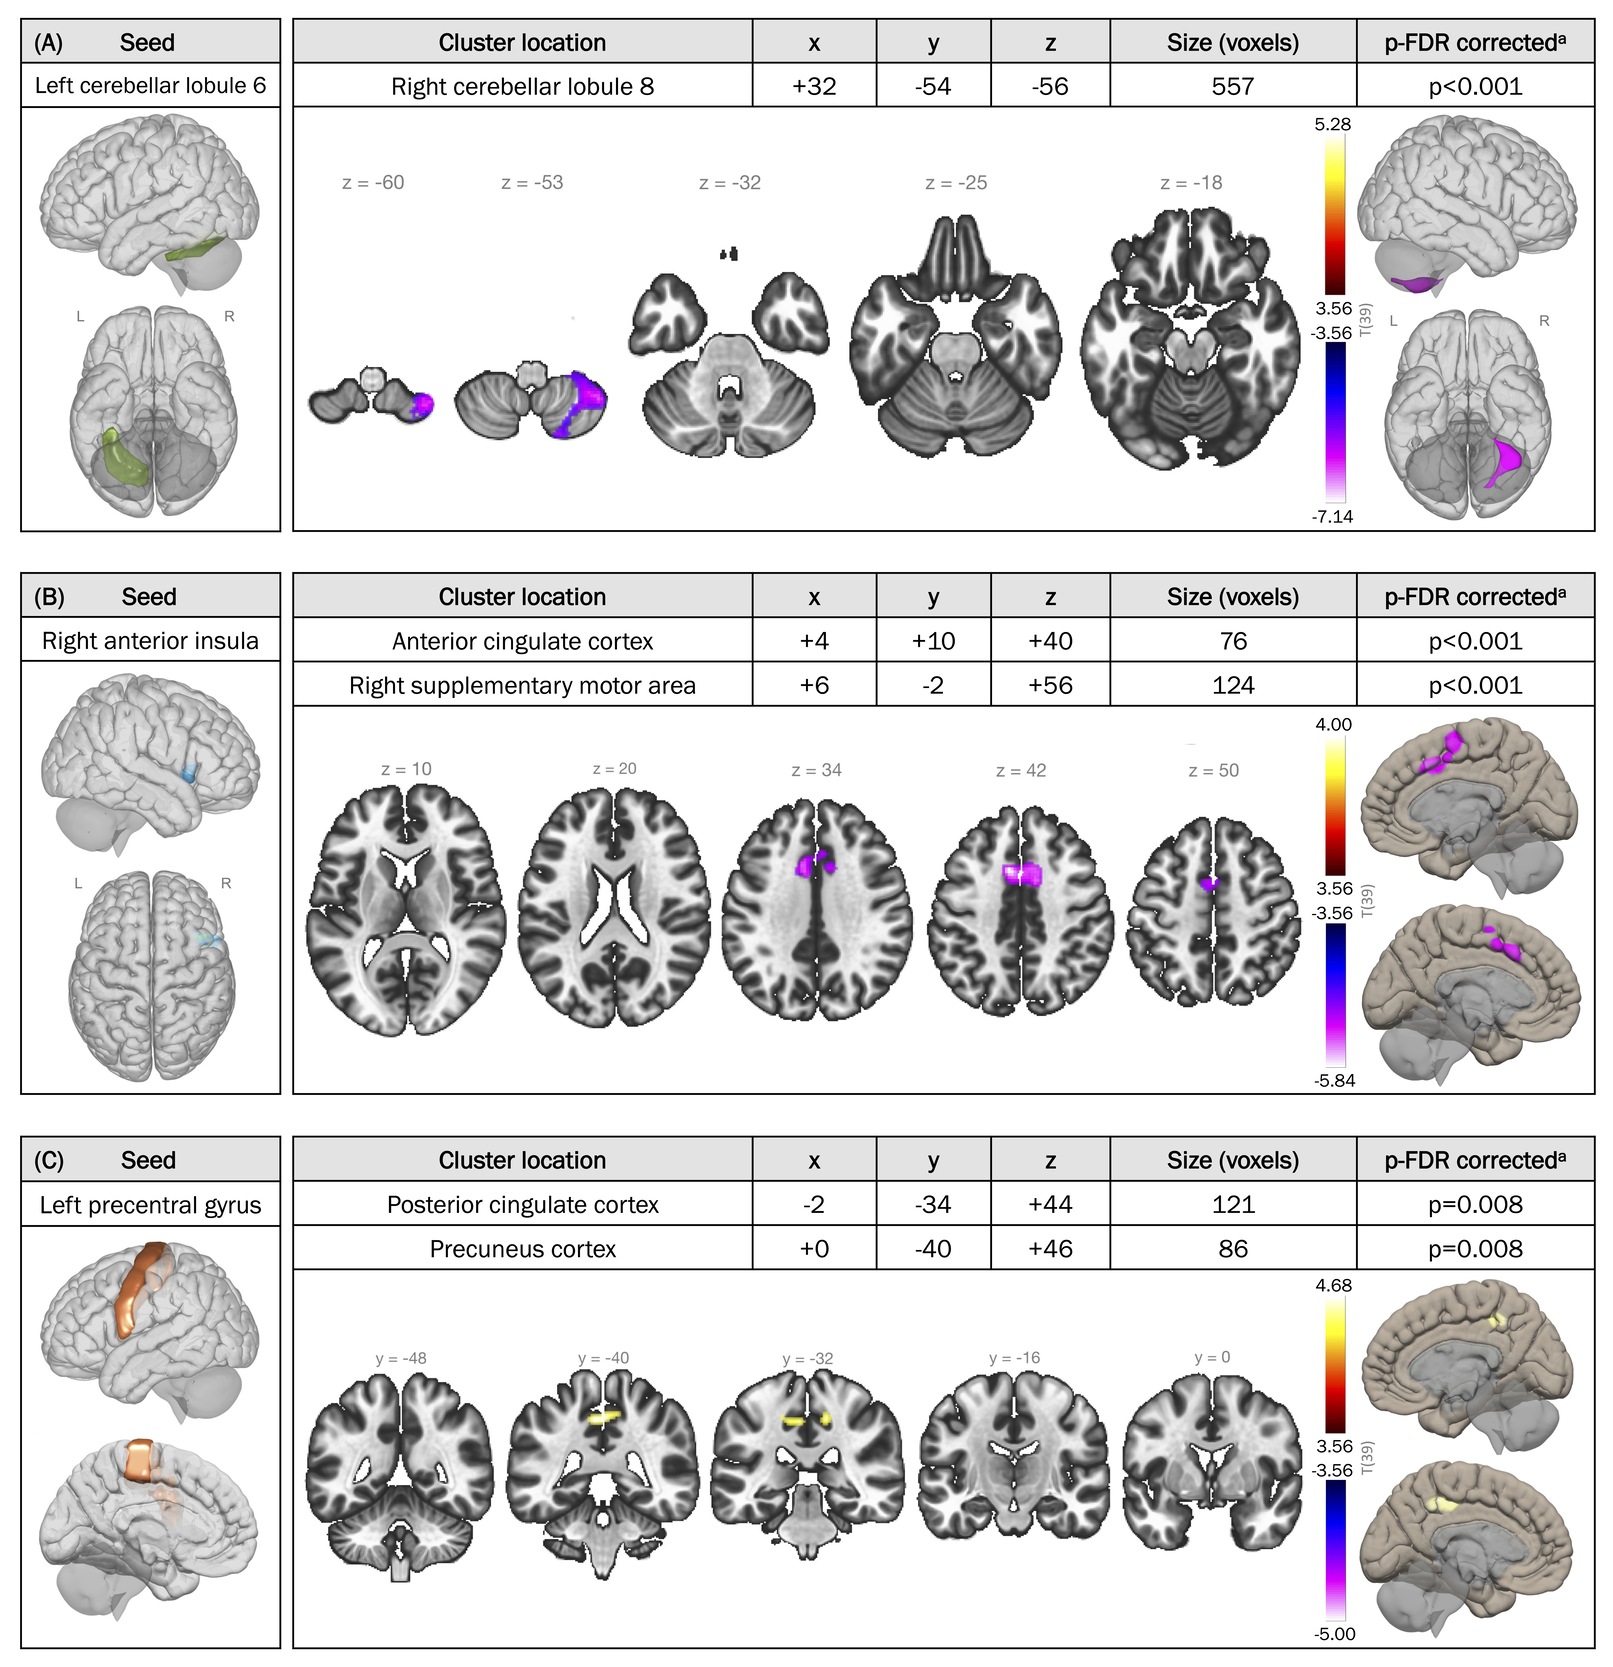
Among the 12 region pairs, the seed associated with the largest cluster (557 voxels) was the left cerebellar lobule 6. FC maps with seeding in the left cerebellar lobule 6 are illustrated in Figure 2, comparing the two groups. In typically developing individuals, positive FC was observed between the left cerebellar lobule 6 and other regions of the cerebellum, the occipital cortex diffusely, and sensorimotor areas including the precentral and postcentral gyri, basal ganglia structures, and supplementary motor areas bilaterally. Conversely, activity in the left cerebellar lobule 6 was anti-correlated with activity in the PCC, bilateral inferior parietal lobules, and regions of the superior and middle frontal gyri bilaterally. A similar pattern was found in the SMA group, with some notable differences: higher connectivity to the precuneus and lower connectivity to the contralateral cerebellar lobule 8 compared to controls (corrected p-FDR<0.001) (Figures 2C and 3A). Similarly, lower FC was observed between the right cerebellar lobules 6 and 8 in individuals with SMA relative to peer controls (corrected p-FDR=0.004) (Table 3).


Salience network regions
Individuals with SMA were found to exhibit lower FC within the salience network, as well as lower connectivity between areas of the salience network and motor regions. Specifically, SMA patients demonstrated lower rsFC between the anterior insula and the ACC (corrected p-FDR<0.001), regions of the salience network, compared to peer controls (Figure 3B). Additionally, SMA patients exhibited lower rsFC between the anterior insula (salience network) and ipsilateral supplementary motor area (motor) (corrected p-FDR<0.001), and between the rostral prefrontal cortex (salience network) and the contralateral putamen (motor) bilaterally (corrected p-FDR=0.008).
Precentral gyrus
FC between the bilateral precentral gyri and areas of the DMN, namely the PCC and precuneus cortex, were higher in SMA patients compared to controls (left precentral gyrus seed: corrected p-FDR=0.008; right precentral gyrus seed: corrected p-FDR=0.045 for both clusters) (Figure 3C).
FC and motor function scores
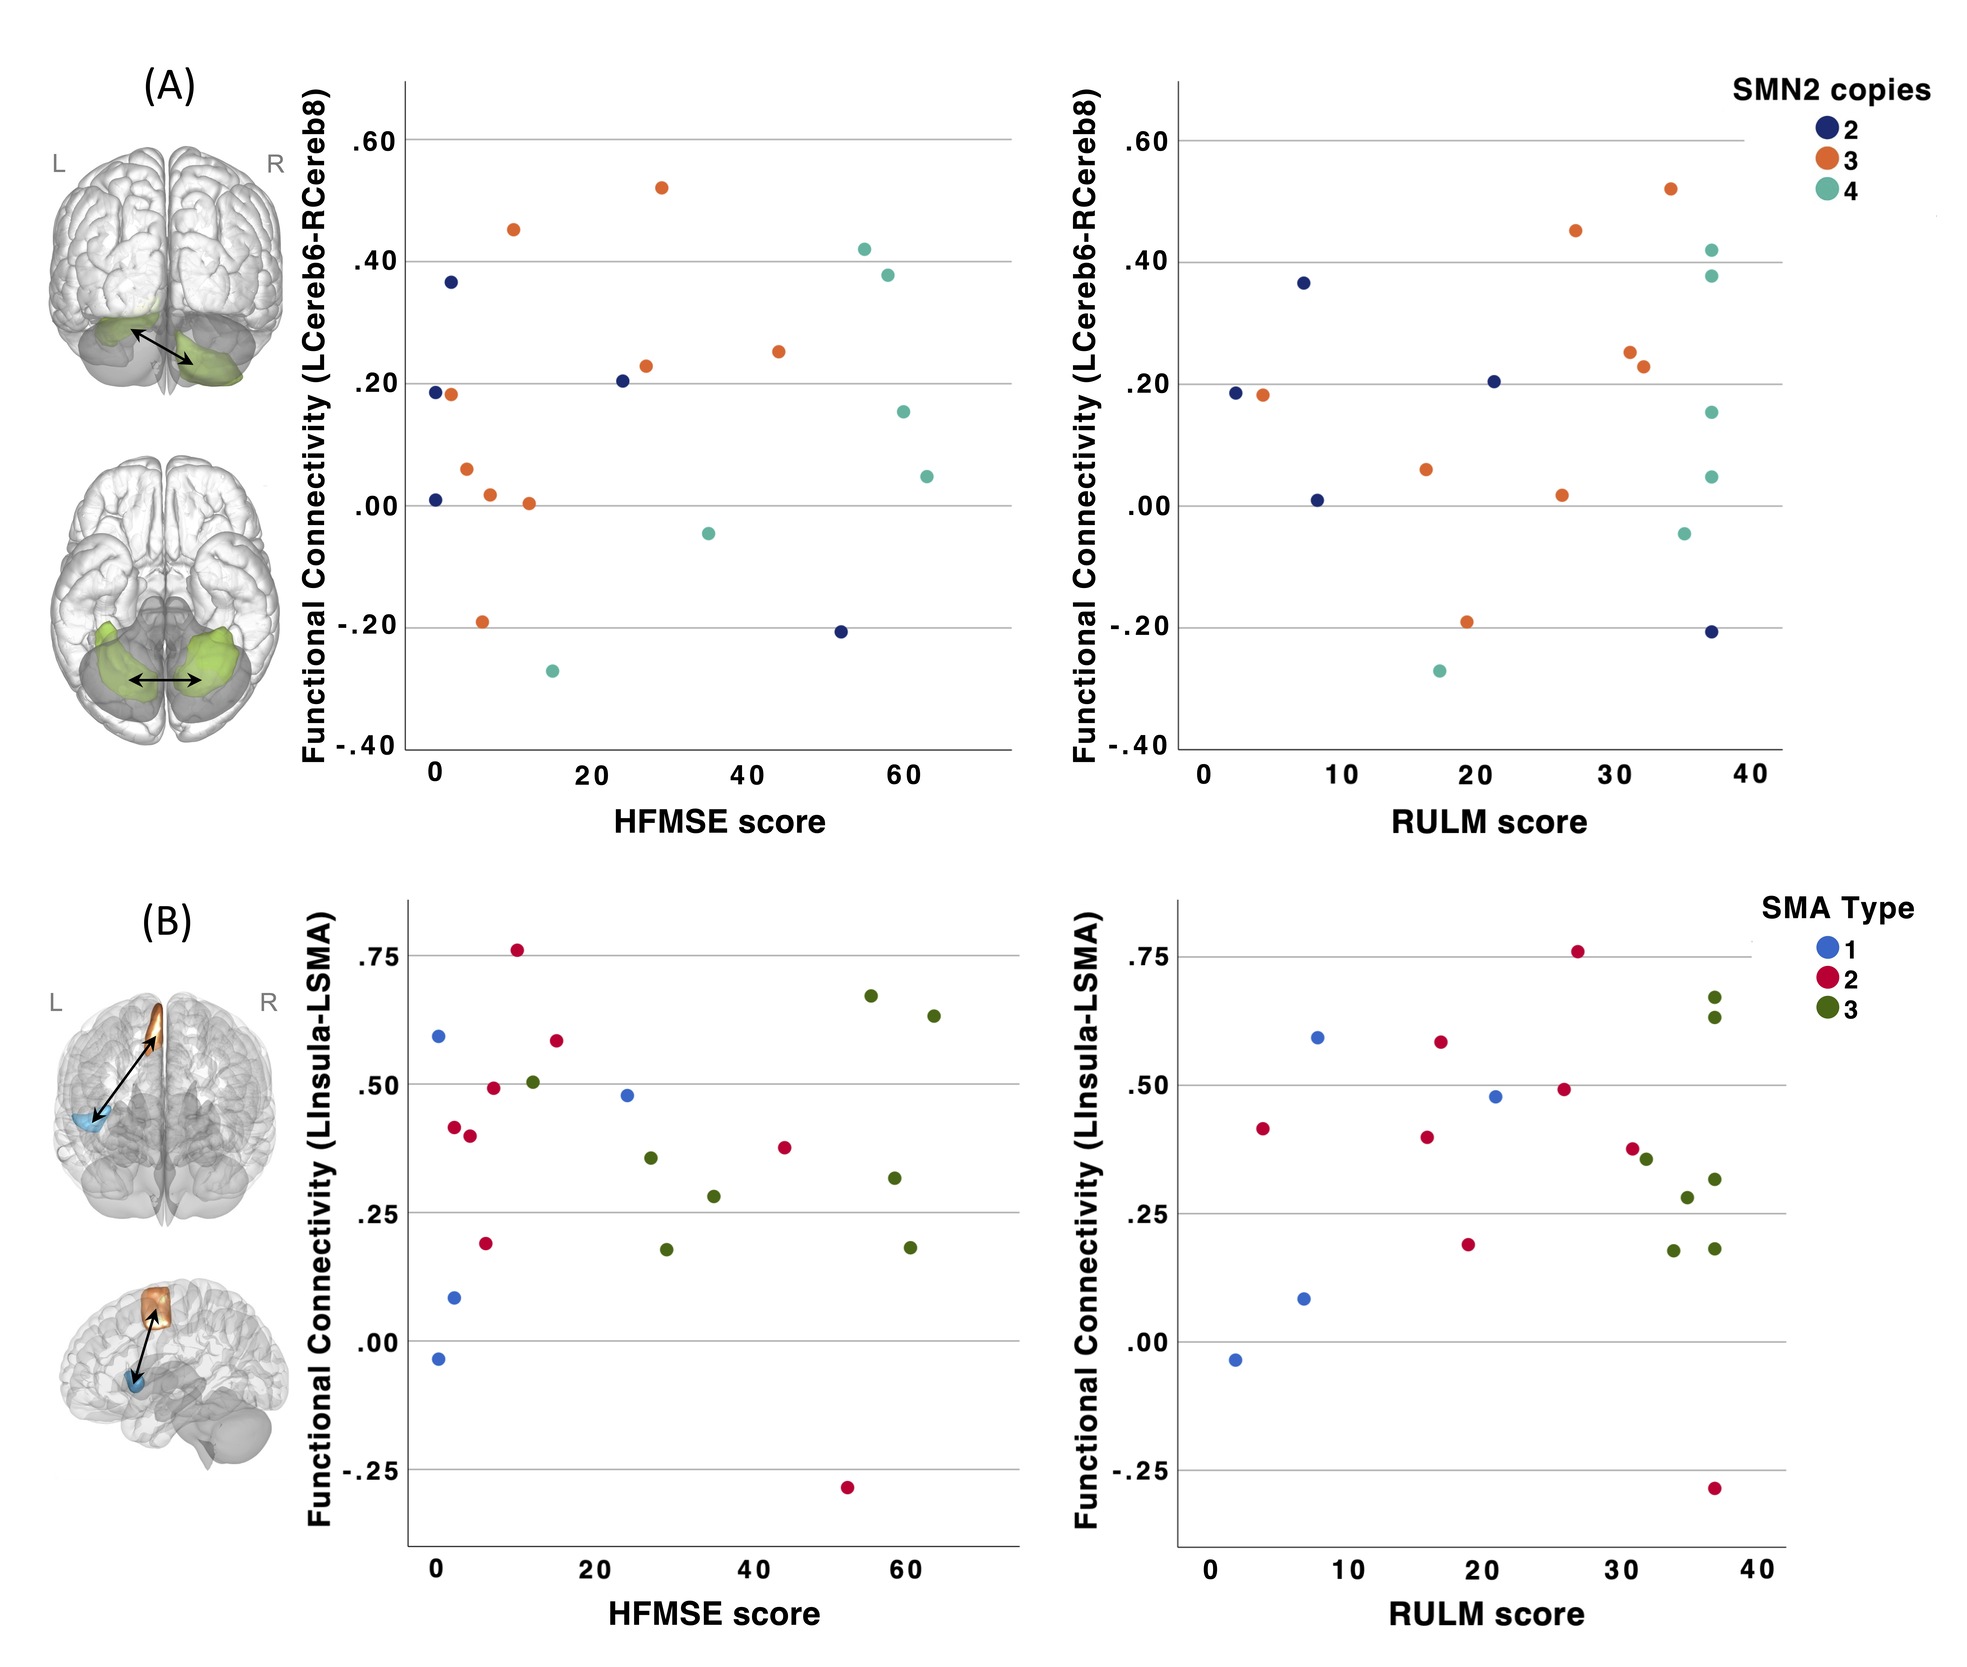
In SMA patients, no significant correlations were observed between rsFC across the 12 seed-cluster pairs and functional motor scores (HFMSE and RULM) after controlling for age at MRI and site (all corrected p>0.05). Scatterplots depicting rsFC as a function of HFMSE and RULM scores for two seed-cluster pairs are shown in Figure 4. Similar patterns were observed for the other 10 seed-cluster pairs.

FC and SMN2 copy number or SMA type
Similarly, no significant associations were found between FC values across the 12 seed-cluster pairs and SMN2 copy number or SMA type when controlling for age at MRI and site (all corrected p>0.05).
Discussion
This study is the first to report rsFC differences between individuals with SMA and peer controls. Compared to typically developing peers, the SMA group exhibited lower FC within the cerebellum, within the salience network, as well as between areas of the salience network and motor regions. Conversely, individuals with SMA demonstrated higher FC between the precentral gyri and areas of the DMN than the control group. These patterns were consistent across both the left and right hemispheres. We also examined potential associations between rsFC and motor function scores, SMN2 copy number, and SMA type, but found no significant correlations when controlling for age at MRI and scanning site.
The observed lower FC within the cerebellum of SMA patients, along with findings from other studies, suggests that cerebellar involvement may be a common feature in SMA. In mouse models of SMA, defects in cerebellar structure and function are consistently observed, including reduced cerebellar volume, disruption of afferent tracts, degeneration of Purkinje cells, as well as decreased spontaneous firing within the cerebellum.33,34 In humans, post-mortem neuropathological studies have similarly demonstrated widespread neuronal degeneration and focal Purkinje cell loss in the cerebellum of type 1 SMA patients.35 Moreover, recent neuroimaging studies in individuals with SMA have shown reductions in cerebellar volume, and alterations in nodal properties of the bilateral cerebellar lobules 6, further supporting the presence of cerebellar dysfunction in the disease.4,36 This cerebellar dysfunction may contribute to the motor impairments observed in SMA patients, as the cerebellum has long been recognized as essential for motor control and coordination. The SMN protein, which is central to SMA pathology, is highly expressed in Purkinje cells and deep cerebellar nuclei.37 Therefore, cerebellar dysfunction in SMA is believed to be a direct consequence of decreased SMN expression, in contrast to ALS, where the cerebellum is thought to play a compensatory role for degeneration of primary motor regions.38 Our findings are consistent with these posited mechanisms of disease-specific alterations in cerebellar function. Indeed, while we observed lower cerebellar FC in SMA patients, prior rs-fMRI studies reported increased FC in the cerebellum of participants with ALS.14,39 Notably, children with cerebral palsy and DMD also exhibit decreased rsFC within the cerebellar network.12,16 Collectively, these findings highlight the significance of cerebellar connectivity in neuromuscular disorders, emphasizing the need for further research into its role in SMA and potential as a therapeutic target.
Unlike the cognitive impairments frequently reported in other neuromuscular disorders, such as DMD40 and ALS,41 overall cognitive performance in individuals with SMA types 2 and 3 appeared to be comparable to that of controls.42 However, the availability of disease-modifying therapies has extended survival in children with severe forms of SMA, allowing for the assessment of their neurodevelopment. Increasing evidence now highlights the presence of neurodevelopmental comorbidities in individuals with early-onset SMA, such as developmental delay, intellectual disability, speech impairment, and autism spectrum disorder (ASD).6 A recent study found that as many as 55% of children with type I SMA who were treated with disease-modifying therapy within the first year of life experience cognitive impairments.43 Whether these neurodevelopmental challenges stem from SMN protein depletion, or are shaped by the effects of early motor impairments and prolonged hospitalizations on language and social development, is yet to be determined. Nonetheless, the parallels between our findings in SMA and the salience network dysfunction documented in other neurological and developmental disorders highlight a potential contribution of salience network alterations to the non-motor manifestations of SMA.
We identified lower FC between non-motor regions, including the anterior insula and ACC, in individuals with SMA compared to peer controls. These brain areas, along with the rostral prefrontal cortex and subcortical structures, comprise the salience network: a resting-state network that plays a critical role in detecting and filtering relevant stimuli to guide attention, decision-making, and behavior.8 The salience network also acts as a dynamic switch, shifting focus between self-directed introspection and internal states, mediated by the DMN, and task-oriented attention to external stimuli, supported by the frontoparietal network.8 Despite the paucity of studies on salience network FC in SMA, differences in the structure and function of the insula and ACC have been observed, including increased gray matter density in the ACC and increased nodal degree in the right insula.36,44 Interestingly, hypoactivity of the salience network has been linked to cognitive and affective deficits in a variety of disorders such as anxiety, chronic pain, bipolar disorder, schizophrenia, and autism.8 In fact, a meta-analysis of functional neuroimaging studies demonstrated that, compared to neurotypical peers, individuals with ASD are more likely to exhibit reduced activation of the anterior insula and ACC during social tasks.45 Disrupted communication between sensory regions, limbic structures, and the insula is thought to cause the salience network to under-prioritize social stimuli, contributing to the social deficits seen in ASD.46
Our findings of higher FC between the precentral gyri and areas of the DMN, including the PCC and precuneus, in individuals with SMA closely mirror those reported in other developmental and neuromuscular conditions. The DMN, often described as a task-negative network, is most active during rest and typically deactivates during cognitively demanding tasks. In our cohort, as expected, the FC between the precentral gyri (task-positive) and DMN (task-negative) was negative in both the SMA and control groups. However, the FC between those areas was higher, or less negative, in the SMA group, suggesting that the anti-correlation between the precentral gyri and DMN is weaker in individuals with SMA compared to typically developing peers. Disruptions of the normal inverse relationship between task-positive (frontoparietal network) and task-negative (DMN) networks have similarly been reported in fMRI studies of attention deficit hyperactivity disorder (ADHD).47 Furthermore, a comparable pattern has been documented in children with perinatal stroke, where FC values were highly associated with parental reports of executive dysfunction and severity of ADHD symptoms.48 These findings have led to the hypothesis that inattentiveness in ADHD stems from inadequate DMN suppression, allowing task-unrelated thoughts to intrude.49 Similar to what we observed in SMA, altered FC between the precentral gyri, precuneus and PCC has also been observed in ALS patients, with higher FC correlating with greater disability and faster disease progression.50 Additionally, there is evidence of altered FC within the DMN in ASD,51 DMD,15 and myotonic dystrophy type 1 (DM1),52 though findings have been more variable, and the anti-correlation between the DMN and task-positive networks remains underexplored in these conditions.
Although unexpected, the lack of association between FC and motor function scores, SMN2 copy number, and SMA type aligns with findings from previous studies. For instance, De Borba et al. found no correlation between reductions in cerebellar volumes in individuals with SMA and their SMN2 copy number or SMA type.4 In addition, in our cohort, we had previously reported that the frequency of macrostructural brain abnormalities was associated with SMA type but not HFMSE or RULM scores.3 Rs-fMRI studies in other neuromuscular disorders, such as ALS, PLS, and DM1, have shown FC alterations to correlate with executive dysfunction, behavioral disturbances, or personality traits, rather than motor function.13,52 Similarly, in DMD patients, abnormal FC was closely linked to the extent of cognitive impairments, suggesting that FC changes may reflect broader neurological involvement beyond motor systems.16 These findings raise the possibility that FC alterations in SMA may be more closely associated with cognitive function and behavior, domains which were not formally evaluated in this cohort.
While this study provides important insights into rsFC in SMA, several limitations need to be acknowledged. First, the cross-sectional design of the study limits the ability to track changes in FC over time, which would be valuable for understanding temporal patterns of brain network alterations in SMA. Furthermore, participants with SMA were primarily recruited from tertiary care pediatric and adult neuromuscular clinics, which could introduce selection bias. However, with the advent of disease-modifying therapies, most SMA patients are now followed in these specialized clinics. Although we did ensure that all peer controls were age-matched to the SMA group, the inclusion of participants across a wide age range (from 7 to 40 years) may mask age-specific changes in brain connectivity. Our cohort was also heterogeneous in terms of SMA type, disease duration, and treatment status (age at treatment and type(s) of therapies received). Since the effects of disease-modifying therapies on FC are not well understood, this variability may confound our results. Additionally, the rates of macrostructural brain abnormalities differed between the SMA and control groups,3 potentially influencing fMRI data acquisition and interpretation. However, the analysis pipeline was designed to mitigate the effects of structural differences on FC measurements, and previous studies have indicated limited concordance between anatomical and FC changes.53 Although brain fMRIs were acquired on two different scanners (Montreal and Calgary), we had SMA patients and peer controls at both sites and therefore data harmonization was not required. We also statistically controlled for site in all rsFC analyses. Our choice of a relatively short (5-minute) rs-fMRI sequence and slightly larger voxels (3.6 mm isotropic) was driven by the need to maximize participant comfort and tolerability. As this was a multimodal imaging acquisition session, each sequence was optimized to be as brief as possible to enable acquisition of additional modalities while maintaining maximal brain coverage and signal-to-noise ratio. Future studies could use smaller voxel sizes to achieve higher spatial resolution as well as longer sequence durations to maximize reliability.54 However, in the present study, shorter sequences were sufficient to achieve good data quality, particularly given that some participants were children with moderate-to-severe motor impairments who were required to remain motionless in a potentially uncomfortable supine position, where longer acquisitions would be more likely to increase motion and degrade data quality. We also elected not to apply extremely stringent denoising approaches (e.g., using the 24-parameter Friston model) to reduce the possibility of regressing out neural signal, reduce loss of degrees of freedom in our model, and prevent potential over-regression. Given the low levels of head motion in our sample, a 12-parameter head motion model (six translational and rotational components plus their first-order derivatives) was deemed sufficient. Nevertheless, subsequent studies could apply more stringent parameters to confirm our findings. Additionally, data were upsampled from 3.6 mm to 2 mm voxels during preprocessing. While this degree of up sampling has been reported to potentially increase false-positive rates in cluster-extent inference, this remains an area of ongoing research, and its impact on the present findings is uncertain.55–57 Lastly, clinical measures of cerebellar function, cognition, behavior, language, and emotion were not included in this study. Future prospective research using larger, longitudinal cohorts are needed to validate our findings and explore dynamic changes in FC over time and their relationship with non-motor outcomes in SMA.
Conclusion
This study provides novel evidence of rsFC alterations in individuals with SMA across multiple brain regions, extending beyond motor areas, and offers valuable preliminary findings to guide future, more targeted investigations. Although our cohort was heterogeneous, this variability reflects real-world SMA populations and does not detract from the exploratory nature of the study. Future fMRI research that further elucidates the reorganization of brain networks in SMA may inform the development of adjunctive therapies, ultimately improving quality of life for affected individuals.
Data availability
Anonymized data not included in this article will be made available upon reasonable request to qualified investigators, contingent on approval from the appropriate research ethics committees.
Ethics approval
The Research Ethics Board at both participating centers approved this study, and informed consent was obtained from all participants or their parents/guardians, as appropriate.
Funding sources
This study was funded by Muscular Dystrophy Canada.
Emilie Groulx-Boivin is funded by the Canada Graduate Scholarships-Master’s (CGS M) award from the Canadian Institutes of Health Research (CIHR), and Fonds de Recherche du Québec – Santé (FRQS) Master’s Research Scholarship.
Conflicts of interest
Jean K. Mah received research grants from Biogen, Italfarmaco SpA, Novartis, NS Pharma, Pfizer, PTC Therapeutics, ReveraGen Biopharma, Roche, Sarepta Therapeutics, and the Alberta Children’s Hospital Foundation. Roberta La Piana is a junior 1 research scholar of the FRQS. She received research funds from CIHR, Spastic Paraplegia Foundation, Ataxia Canada, Roche Canada, consulting honoraria from Novoglia and speaking honoraria from Novartis. The institution of Maryam Oskoui has received research support from Biogen, Hoffmann-La Roche Ltd., Muscular Dystrophy Canada, the Canadian Institutes of Health Research, Santhera, and Novartis. Maryam Oskoui is a Distinguished research scholar of the FRQS and has a non-compensated relationship as a Member of the Medical and Scientific Advisory Committee with Muscular Dystrophy Canada.