
Human brain mappers are professional scientists. That means we are likely universally aware of the climate emergency, understand it is caused by humans burning fossil fuels, and recognise that the majority of human activities – including our science – contribute to global warming. However, because we do not see the power plant emissions when we run our scanners, and we do not see the kerosene burnt when we travel by plane to conferences, it is easy to forget our scientific carbon footprint.
I co-founded the Sustainability and Environmental Action Special Interest Group (SEA-SIG) six years ago to bring these issues to wider awareness amongst our community, assess the scale of the impact, and co-create solutions.
SEA-SIG’s activities are structured in three working groups: Outreach, Neuroimaging Pipelines, and Annual Meeting. The Outreach group leads environmental sustainability-themed sessions in the conference programme, from symposiums to roundtables and a booth in the exhibition area, as well as reaching wider audiences via social media (e.g., @ohbmenvironment.bsky.social). The Neuroimaging Pipelines group assesses the environmental impacts of our neuroimaging research, across the lifecycle from data collection, to data analysis, to data sharing. The Annual Meeting group assesses the environmental impacts of the in-person OHBM conference, and identifies opportunities for carbon savings, from considering the location of the in-person meeting, to offering alternative meeting participation formats. Excitingly, we are now forming a fourth working group: Climate Effects on the Brain. This team will scope the new, but rapidly increasing literature on how climate change affects the brain and identify future research priorities for our community.
Raising awareness amongst our community
Over the last six years, at the Annual Meeting the Outreach group has organised five symposiums, two roundtables, and a yearly exhibition booth showcasing ideas to reduce our community’s environmental impacts. We have covered the environmental impacts of the neuroimaging lifecycle,1 the carbon footprint of the Annual Meeting (driven by long-haul flights),2 and offered opportunities for reflection and discussion on practical actions our community could take.
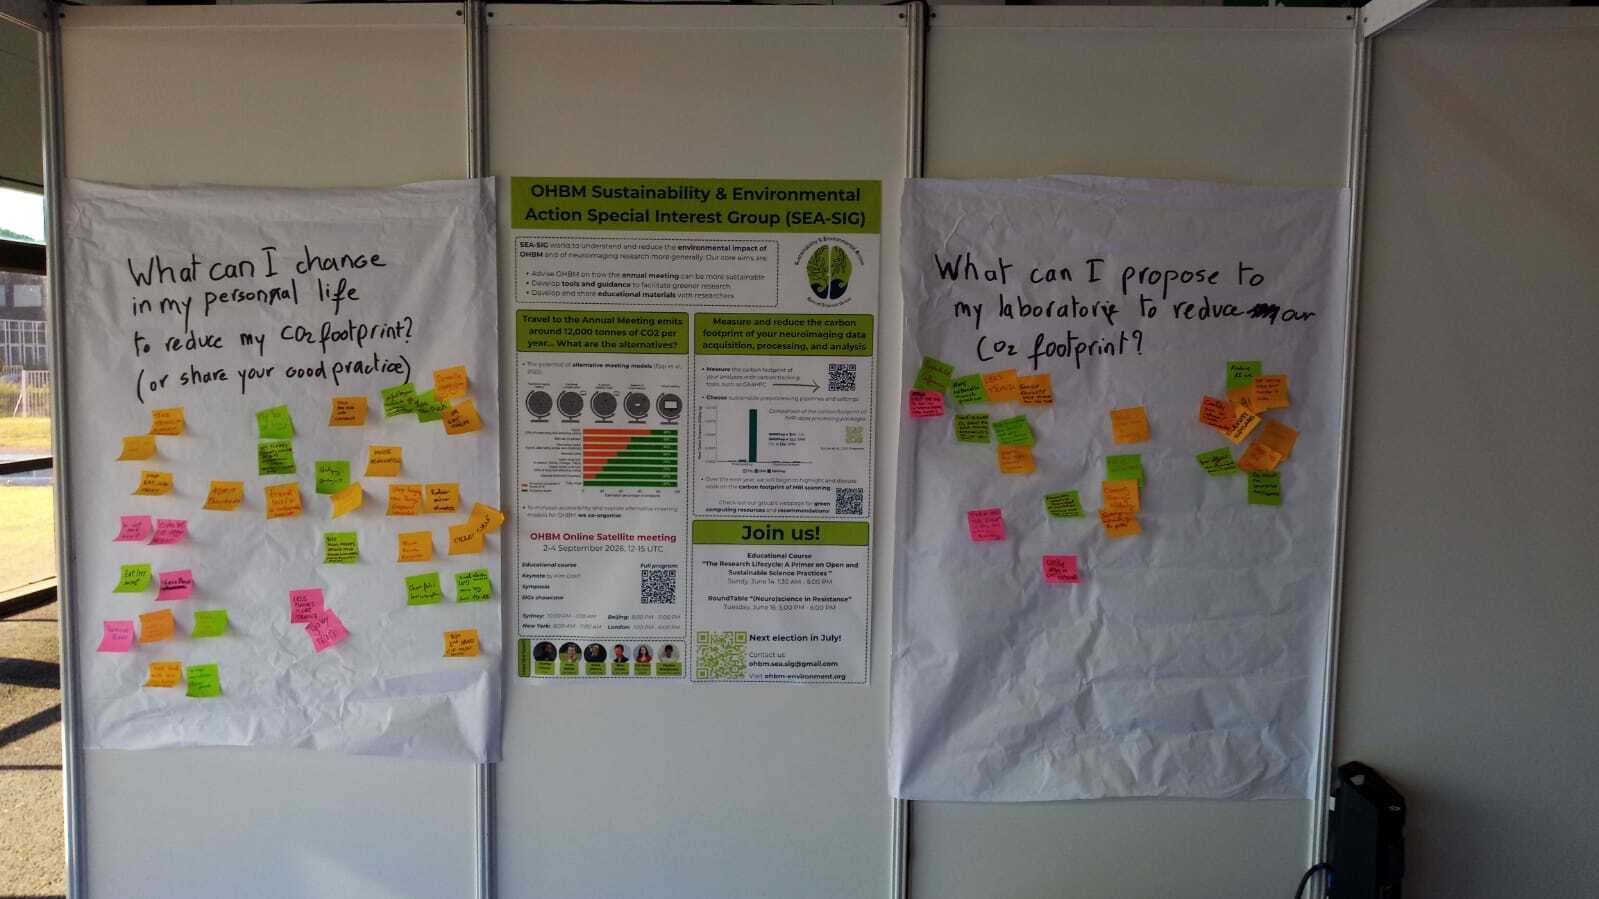
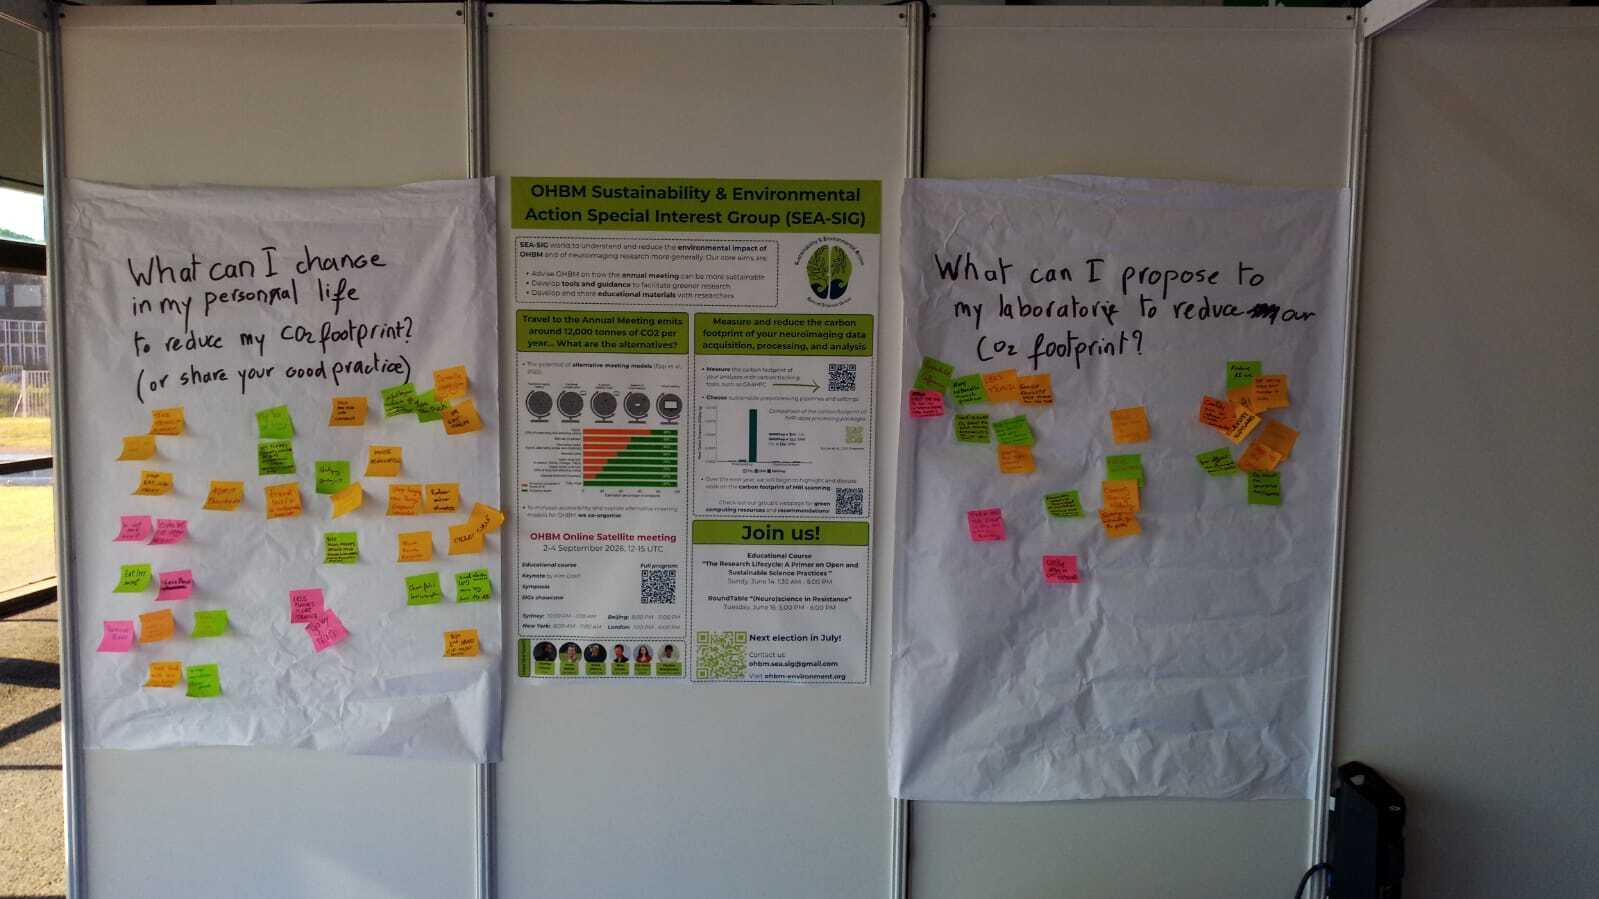
At OHBM2026 in Bordeaux, for the first time we ran a ‘Climate Fresk’: a card game that explains the science of climate change and allows players to identify the most impactful actions they can take in response. We recorded the actions under two categories: ‘actions I can take in my life’, and ‘actions I can take in my lab’ (Figure 2, highlight actions listed in Box 1). We encourage OHBM colleagues to review the list and take an action back to their team! My personal action was to run a dedicated lab meeting for my team, for us to review our research processes and where we can reduce our environmental impacts.
We have enjoyed a close relationship with the Open Science-SIG for many years, given the natural overlap between open science and sustainable science, through the reuse of precious open data resources (although there is a tension with the energy required to share data on public cloud repositories).1 As a result, SEA-SIG speakers have regularly appeared in Open Science Room sessions, explaining where open and sustainable science align and diverge, and the practical issues that open neuroimagers should consider, such as reflecting on exactly which files should be shared.1
Measuring the carbon footprint of MRI research
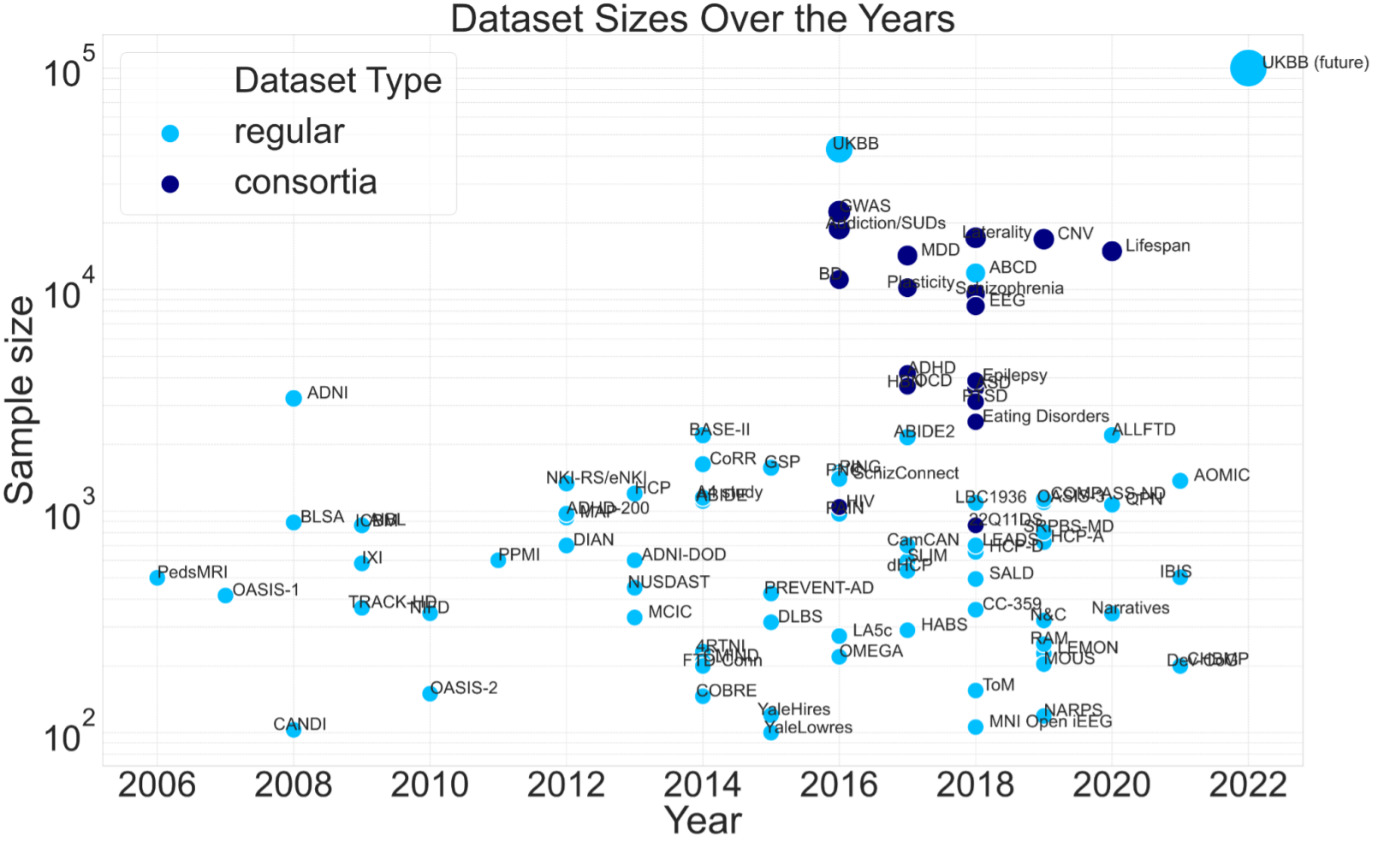
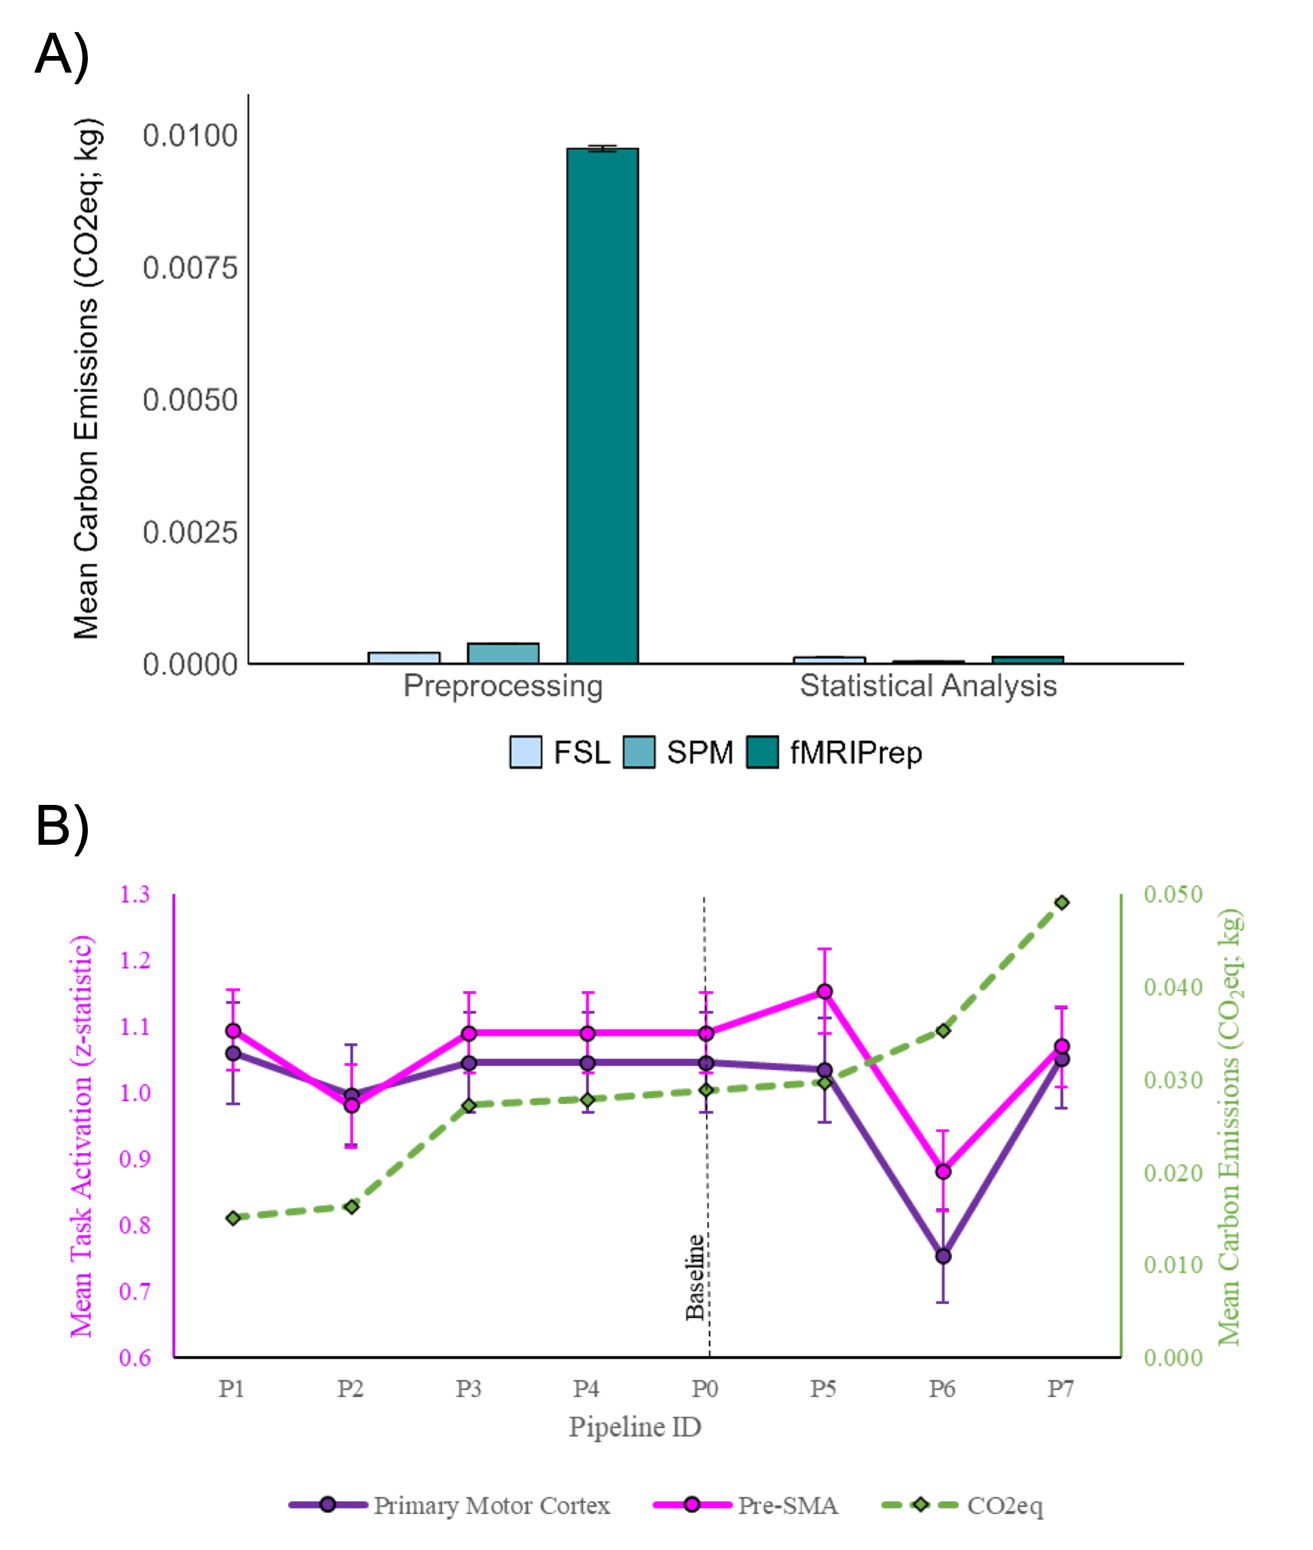
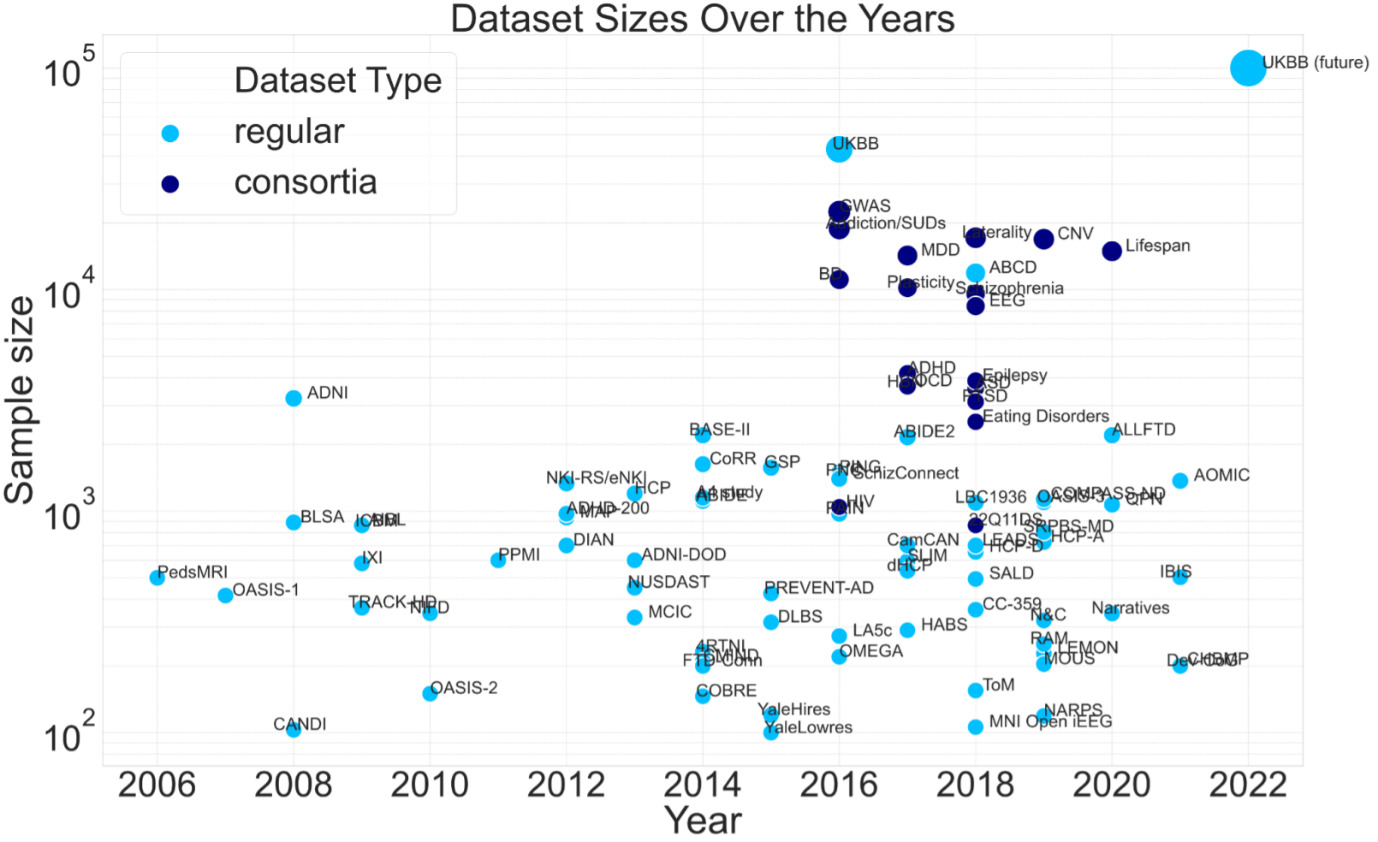
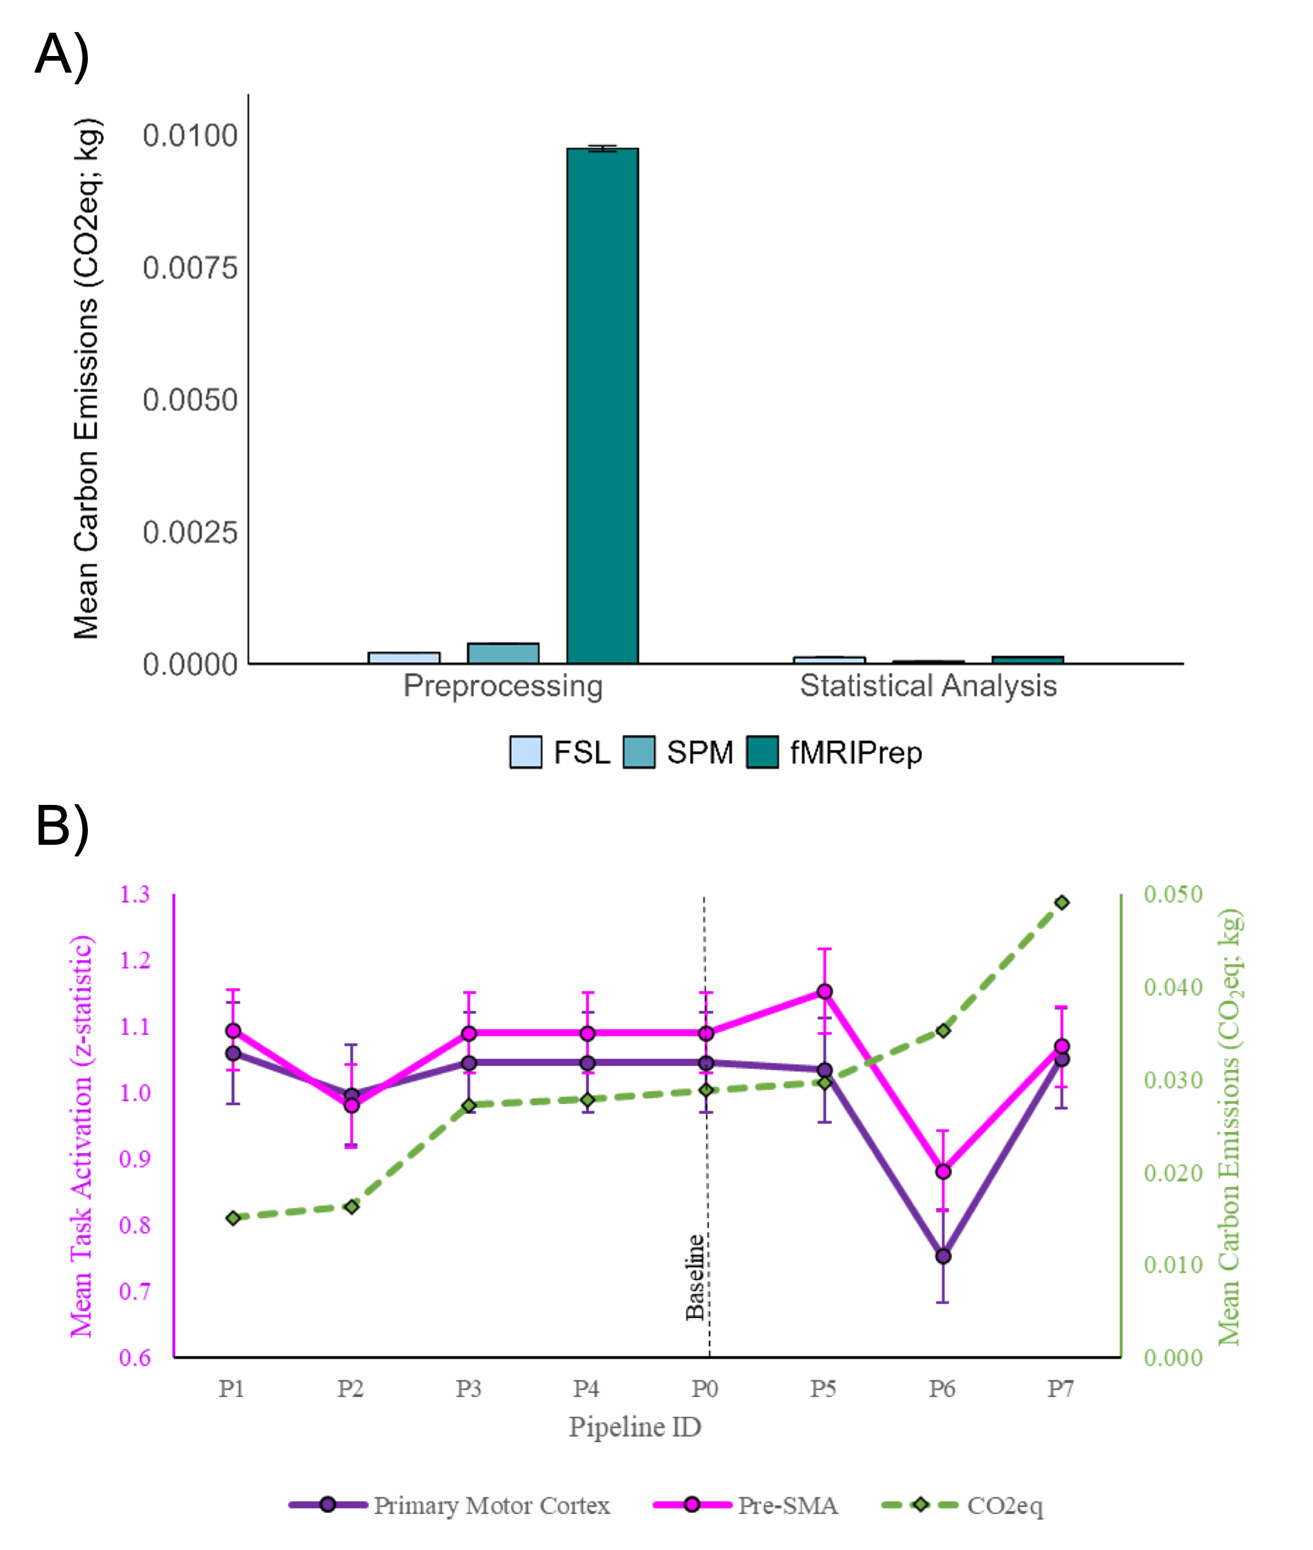
The pilot work of the Neuroimaging Pipelines group in our early days, such as demonstrating the log-scale increasing size of datasets in our field (Figure 3), enabled us to acquire grant funding to formally measure the energy usage and associated carbon emissions of fMRI analysis. Led by current SEA-SIG Chair, Nick Souter, this work showed that preprocessing has higher energy usage than statistical analysis, and that older software (FSL, SPM) was lighter-weight in energy consumption than the more recent ‘best-in-breed’ fMRIprep3 (Figure 4a). Even so, more energy-intensive processing such as fMRIprep can still be optimised to minimise energy consumption, such as by switching off default output files that are not needed for your particular analysis, with no impact on statistical sensitivity4 (Figure 4b).
Next, Nick and the Neuroimaging Pipelines group are leading work to assess the energy consumption of MRI data collection. Using available data from scanner manufacturers (which is not tailored according to sequence type), Nick and the team have developed an easy-to-use web app to calculate the energy usage and associated carbon emissions of your MRI scanning. Although not yet customisable by sequence, this will nevertheless give a rough estimation of your study’s data collection carbon footprint. We encourage you to try the tool here, and then report this information on talk slides and in your paper. However, because the tool uses generic information from scanner manufacturers, with no detail available on sequence type, the estimates are likely biased towards the scanning sequences more typically used in clinical practice, such as structural scans.
Sequences used by the human brain mapping community, particularly echo-planar imaging such as functional MRI and diffusion MRI, likely use more energy than T1 or T2 structural sequences (for example, due to the rapid gradient switching). However, to formally assess this, we need to attach energy monitors to the power cables of scanners. Scanner power cables are often buried in the scanner room floor, but if you can isolate the power cable to your scanner, please contact us, so that we can attach an energy monitor! We would love to understand not only how different types of sequences use energy, but also how protocol differences and durations of the same type of sequence differ – for example, what difference does multi-band fMRI make versus single-band? Does energy usage of fMRI scale linearly, with duration of task or resting state acquisition?
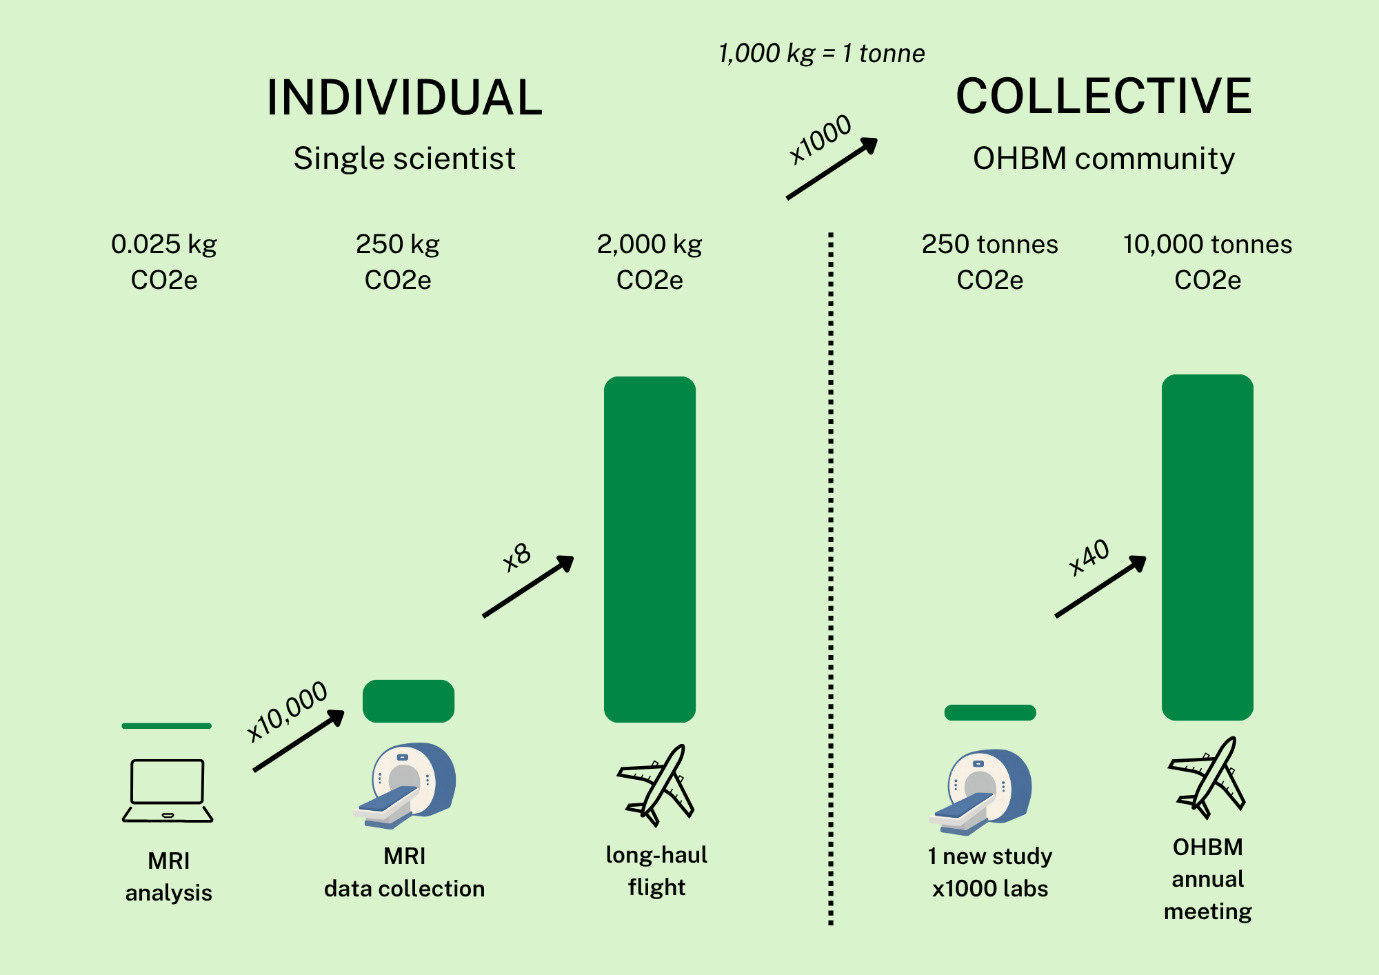
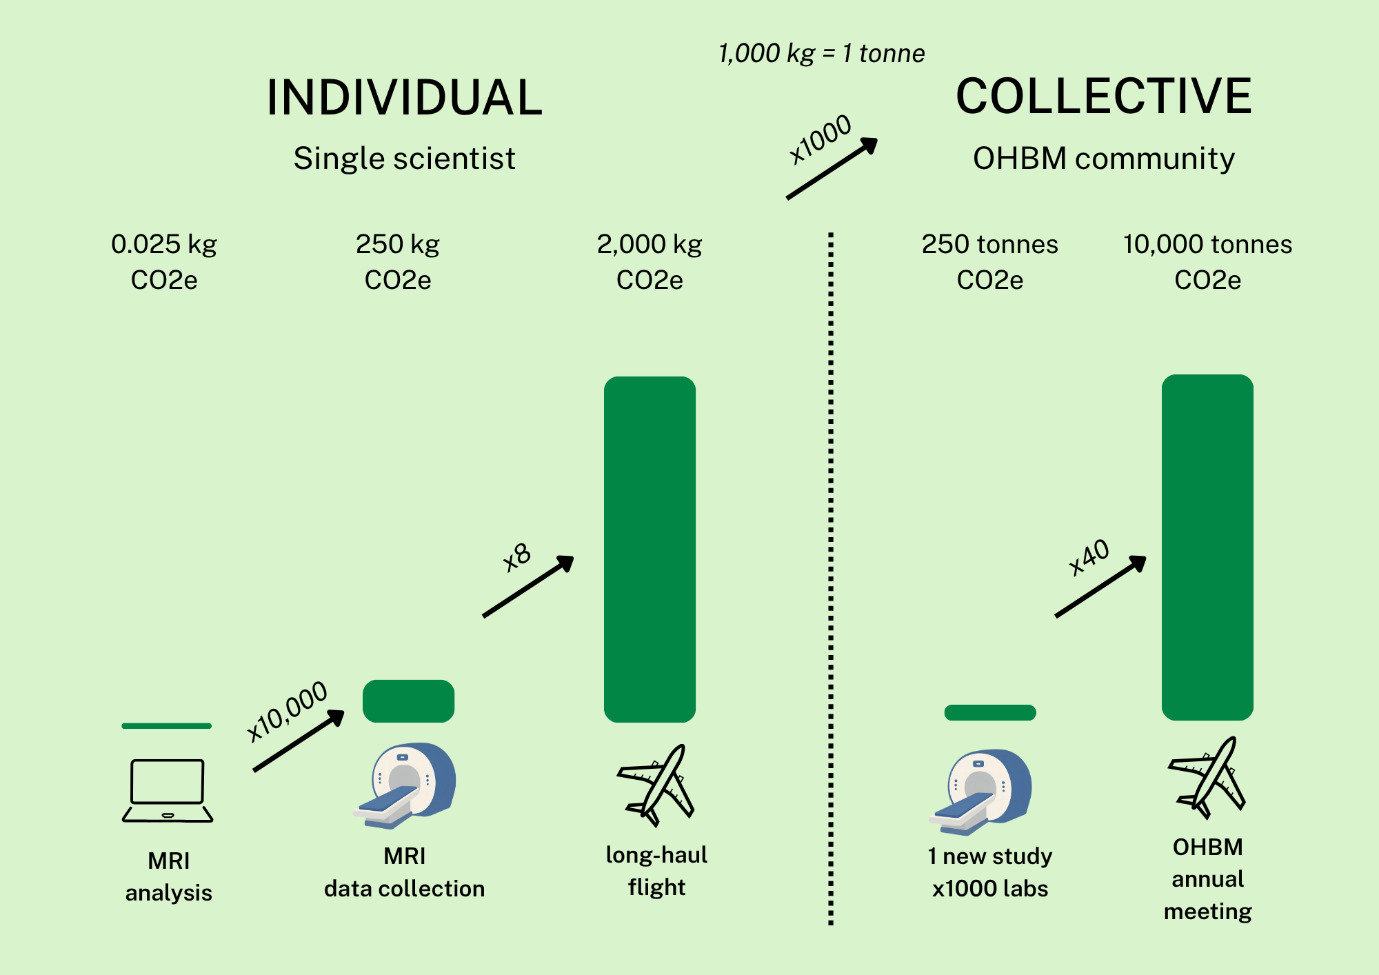
Nevertheless, the data available so far suggest that the carbon emissions arising from MRI data collection are of a significant order of magnitude bigger than data analysis: approximately 250 kg CO2e to acquire MRI data for 50 participants, scanning for 60 minutes, on a 3T. Compare this to only 0.025 kg CO2e for preprocessing 60 minutes of fMRI data from 50 participants. This highlights the importance going forward of reusing data wherever possible and worrying less about precise software settings. However, it is also important to bear in mind that our computational usage will likely change with the advent of AI, and its incorporation into our analysis tools, so we must be cognisant and watchful that our energy and emissions from analysis do not harmfully escalate.
More precisely calculating the carbon emissions of scanning will enable us all, as practising scientists, to formally measure the carbon emissions associated with our data collection, as well as our data analysis. Ultimately, we would like all human brain mappers to include an ‘Environmental Impact Statement’ in their research papers – akin to a Data Availability Statement, but declaring your study’s environmental impact (and what you did to reduce it, where possible).
Tackling the society’s own carbon emissions
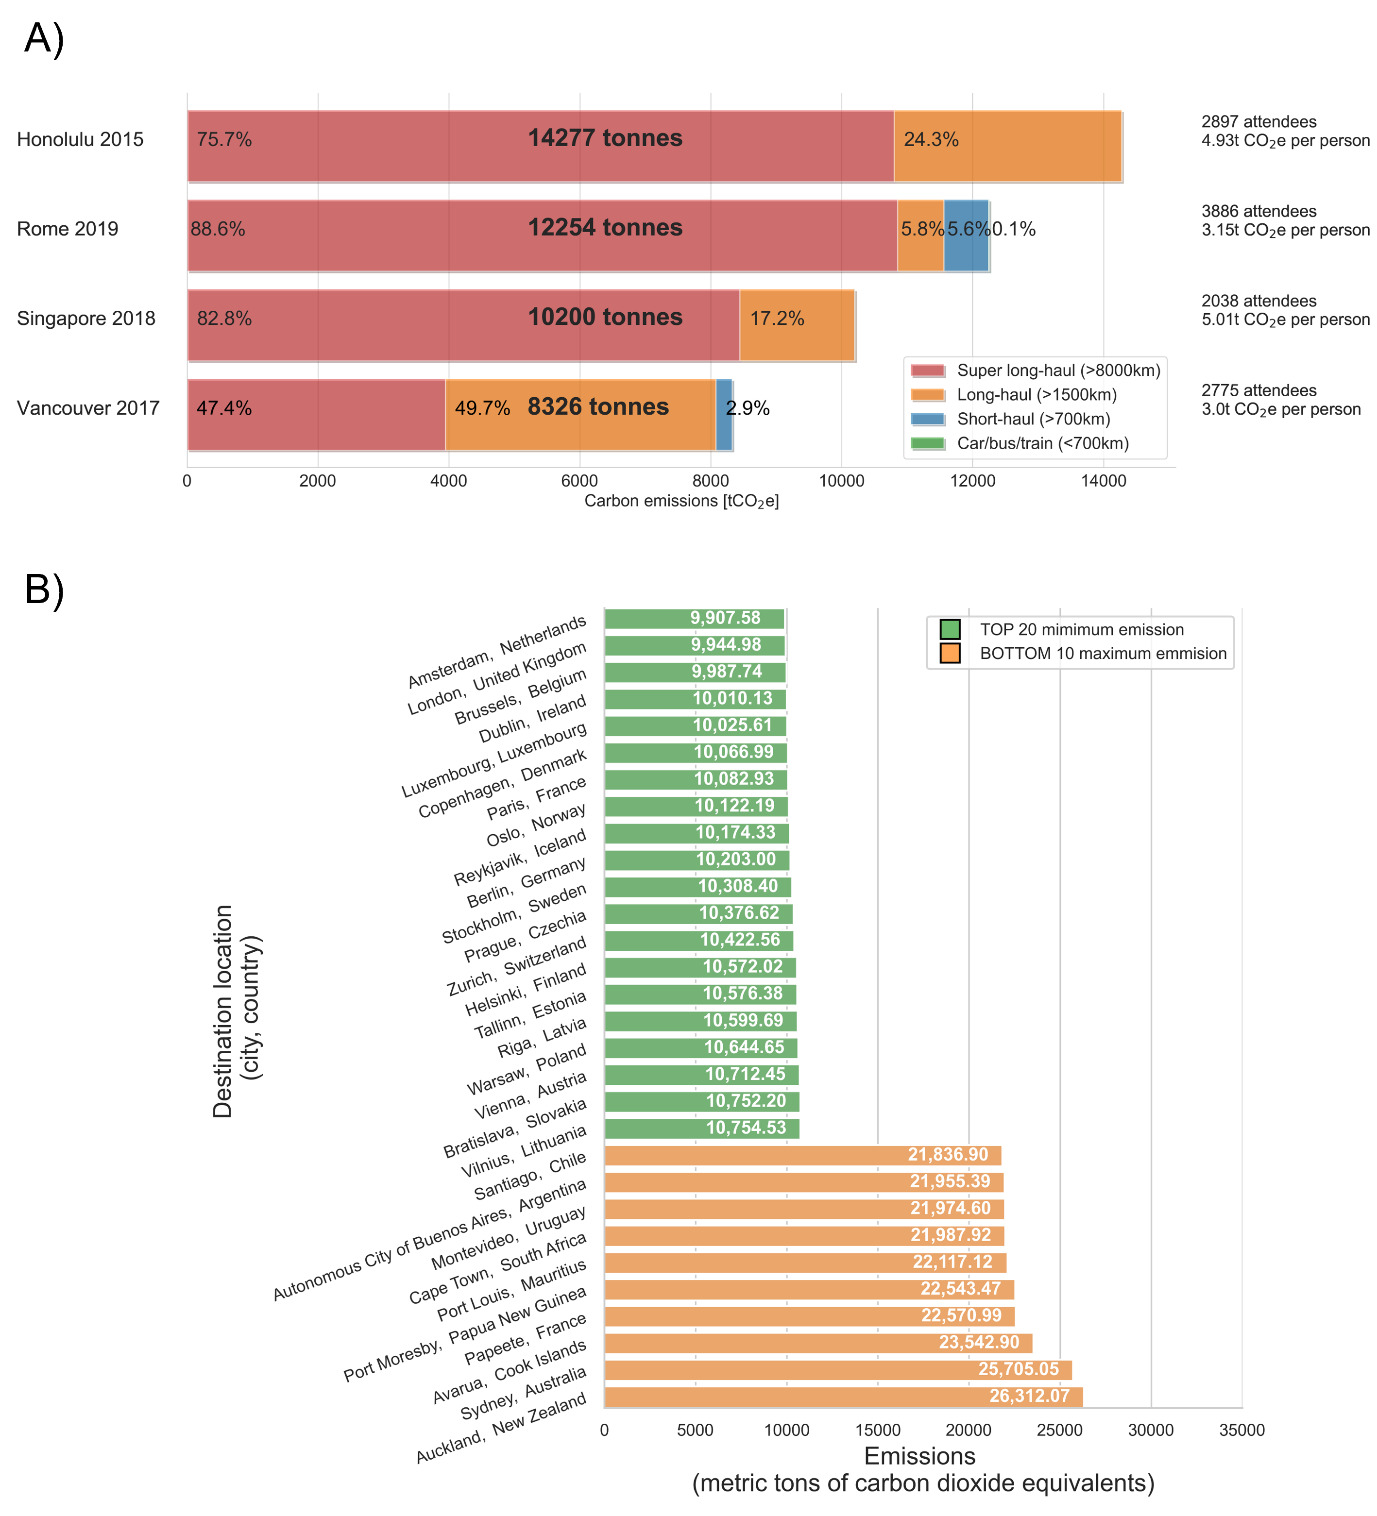
20 years ago, in his seminal 2006 documentary ‘An Inconvenient Truth’, Al Gore brought human-caused climate change to international attention. It is An Inconvenient Truth indeed for our international, global society which relies financially on significant Annual Meeting registration fee income to exist, that each Annual Meeting generates an average of ~10,000 tonnes of carbon emissions. These emissions come almost exclusively from international air travel, particularly driven by the attendees who take the longest-haul flights2 (Figure 5A). Attendees taking super long-haul flights are over-represented in the meeting’s collective carbon footprint, because on super long-haul flights, the plane is in the air for longer and therefore burning fossil fuels for longer.
_the_total_carbon_emissions_vary_by_location__acco.png)
The location of the in person meeting also heavily influences that year’s carbon emissions. Because most OHBM attendees are based in North America and Europe, locations in western Europe and the east coast of North America tend to have the lowest emissions (Figure 5B), because collectively they require the lowest duration of air travel from the attendees. There is a tension here with accessibility, which OHBM has traditionally approached by rotating the conference around continents every 3 years. However, even within a continent, certain locations are much more favourable in terms of lower emissions: compare Vancouver 2017 (8,326 tonnes) with Honolulu 2015 (14,277 tonnes). In the present 3 year rotation model, we would love for OHBM decision-makers to consider the carbon of precise locations within each year’s continent in the decision-making process. It could save thousands of tonnes of carbon each year.
In our Aperture Neuro paper analysing the Annual Meeting’s carbon footprint, we also proposed format solutions to reducing it.2 These included offering a hybrid participation option, but post-COVID, we have seen the concept of hybrid gradually fall out of favour, with demand for in-person interactions bouncing back to pre-pandemic levels. Additional venue costs to provide synchronous two-way interactions between the venue and online participants were also reported to us as a barrier. Another option we proposed was a biennial meeting – meeting every 2 years, instead of annually – which would instantly save 50% of emissions. However, this potentially disadvantages Early Career Researchers and is also unaffordable financially under current society funding models (because of the lost registration income).
Therefore, in 2024, we put forward a proposal to OHBM Council for an Online Satellite Meeting, intended to be a smaller online-only sister event to the in-person Annual Meeting. This was accepted, and our first OHBM Online Satellite Meeting ran in September 2025.5 Organised by SEA-SIG, in close collaboration with the Executive Office and with support from Programme Committee, we featured a range of symposiums, an Educational Course, a SIG showcase, and a keynote from Council Chair Prof Michael Breakspear. We are looking forward to the 2026 Satellite Meeting, which by the time of publication, will have already happened – and we will hopefully be on our way to our 3rd Online Satellite in 2027!
Increasingly, we in SEA-SIG are aware of the intersectionality of sustainability and accessibility: members desire more opportunities to connect with one another globally, in diverse ways that do not require international air travel. This may not necessarily be for environmental reasons, but because of difficulties with visas, caring responsibilities, or disabilities. Diversity, Equity and Inclusion has been a central value of our society for many years,6 and offering more routes to networking and learning will support multiple society aims. It is in this light that SEA-SIG are keenly exploring with society colleagues the possibility of a ‘mini-hub’ pilot, with a second, and possibly even third, in-person location, on different continents to the main Annual Meeting. The aim is to stream a limited amount of material from the main conference centre, with a local watch party and networking opportunity for those who are based geographically closer to the mini-hubs. Watch this space.
The most impactful actions
When we started SEA-SIG six years ago, we thought that there were likely emissions coming from across the stages of the neuroimaging research lifecycle, and from the OHBM Annual Meeting. However, we first needed to conduct the careful work to assess exactly how big these emissions were.2–4 We now understand more clearly that although one can indeed tweak MRI analysis settings to marginally reduce energy usage, the much larger data impacts seem to come from data collection in the first place (Figure 6). Running scanners is energy-intensive, and so reusing existing data in the lab – or from the many public datasets now available – looks to be a much more impactful action to take.
Secondly, we can see that while there is certainly important scope to address our neuroimaging emissions, the much larger source of carbon for many members of the OHBM community who regularly travel to the in-person meeting is the planes they take to get there.
At the individual level, skipping one long-haul flight can save a few tonnes of carbon (the precise amount varies by route and duration). But when we scale this to the level of the Annual Meeting, we as a community have the potential to save many thousands of tonnes of carbon, if we are more creative about how we connect with each other (Figure 6). We invite suggestions from across our community as to how we do this and want to work collaboratively across our society to find ways to meaningfully interact while reducing our society’s emissions.
Finding my community
I was deeply honoured to receive the OHBM2026 Sustainability Award. But I will use a terrible cliché in ending this piece, to say that the Award reflects not my achievements, but the endeavours and efforts of the whole of the SEA-SIG over many years. I am deeply grateful to everyone I have worked with in SEA-SIG, for not only the advancements we have made, but because you helped me feel that I was not alone in the climate crisis anymore. Thank you, SEA-SIG.
Funding
Charlotte Rae is supported by a UKRI Future Leaders Fellowship (MR/X034100/1).
Conflicts of Interest
None declared.
Acknowledgements
Nick Souter and Thomas Hinualt provided comments and feedback on the draft manuscript.