_frontal_mask_used_to_def.tif)
1. Introduction
Psychosis appears in many severe disorders and is often accompanied with varied symptoms in cognitive, emotional, social, and motor domains.1,2 Psychosis symptoms are consistently associated with dysconnectivity in the frontal cortex.3,4 Despite this, recent work highlights how individual differences and diagnostic subgroups reduce reliability of psychosis related biomarkers, limiting their clinical and scientific utility.2,5 Multivariate approaches may help address this by leveraging individual specific patterns of neural information to characterize clinical disorders.6,7 To this end, the current work applies hyperalignment to resting state connectivity data from individuals diagnosed with psychosis and healthy controls. Hyperalignment applies mathematical transformations to voxelwise patterns of brain data to improve signal of brain-behavior relationships.8 As such, hyperaligned data may be uniquely suited to reveal fine-grained functional differences in connectivity data that characterize clinical disorders.9 Furthermore, individual components of hyperalignment may reflect clinically meaningful information reflecting patterns of frontal connectivity across connections (scale), baseline connectivity of specific voxels with targets throughout the brain (translation), and reorganization of neural connections (rotation). Such fine-grained information may help reveal clinical subgroups within heterogeneous diagnoses and yield reliable individual specific information, paving the way for personalized psychiatric medicine.
The frontal cortex is thought to regulate processes that are disrupted in psychosis.10–12 For example, reduced middle frontal cortex connectivity may impact one’s capacity to make self-other distinctions and coordinate mental states with future decisions.13 Altered somatomotor connectivity in the precentral gyrus may impact motor and cognitive performance.14,15 Altered inferior prefrontal cortex connectivity may contribute to changes in emotion and motivation.16,17 However, brain changes underlying these effects are complex and traditional methods don’t account for patterns of imbalanced frontal connectivity highlighted by more recent work.16,18 Interindividual differences further impede efforts to comprehensively summarize frontal dysconnectivity in psychosis.19,20 New methods may help describe these changes.21
Multivariate approaches improve reliability of neuroscientific work and help characterize complex clinical disorders with brain data.22 Approaches that leverage voxel-wise information have identified clinical subpopulations,23 defined individual specific functional networks,24 and accurately classified clinical disorders.22 While promising, multivariate models can be difficult to interpret and can overfit models to specific samples.25–27 Furthermore, interindividual variability poses a problem for machine learning approaches.8 In response, methods like hyperalignment have been used to supplement multivariate analysis.8
Hyperalignment adjusts interindividual variability in functional brain anatomy, using methods based on generalized Procrustean analysis.28 It generates a common functional brain template and transforms individual brains to match it.29,30 This synchronizes patterns of functional information that appear in distinct anatomical locations across individuals, despite their involvement in similar neural processes.8 A growing body of work demonstrates improved reliability in neuroscientific studies when hyperaligned data are used.8,29,30 Recent work also shows stronger relationships between hyperaligned brain data and clinical symptoms of depression and anxiety31 as well as cognitive performance.32 In addition, work highlights brain properties that may be characterized by transformation matrices. Rotation, for instance, is thought to highlight functional connections that are preferentially active in particular individuals.33 This collected evidence suggests hyperalignment enhances brain data while also revealing subtle functional differences in brain data. This sets the stage for new applications in clinical neuroscience.
In the current study, we apply hyperalignment to resting state functional connectivity data collected from individuals with psychotic disorders and a comparison group of matched healthy controls. Given past work in frontal dysconnectivity in psychosis,3 we focus analysis on frontal cortex connectivity within whole brain networks. To our knowledge, this is the first study that applies hyperalignment to brain data from individuals diagnosed with psychosis. We make the following predictions. 1) As hyperalignment addresses interindividual variability in fMRI data,8 we predict that hyperaligned data will reliably classify diagnostic status. This may indicate that hyperalignment enhances clinically relevant differences in brain connectivity, building on previous findings.34 In cases where individuals are incorrectly classified, we will contrast voxelwise translation and rotation maps to understand how hyperalignment may reveal fine-grained individual differences that impact classification. 2) We suggest that transformation coefficients defined in hyperalignment may provide clinically relevant insights. We predict that smaller scaling coefficients in individuals with psychosis may reflect patterns of hyperconnectivity between the frontal cortex and targets throughout the brain. This aligns with work that reports frontal hyperconnectivity is present in psychosis.35 3) We predict that heightened translation will be associated with psychosis, which could reflect blunted baseline connections in individuals with psychosis that reflect average connectivity between individual voxels and their respective targets throughout the brain. Although contradictory to our scaling prediction, this prediction is supported by findings that link blunted connectivity in the inferior frontal gyrus to psychosis.36,37 Together, scaling and translation may speak to the complex imbalances in frontal cortex function.18 4) Finally, we predict that heightened rotation will be related to psychosis. This may reflect reorganization of frontal connections relative to controls and corresponds with findings that suggest individuals with psychosis gravitate toward particular frontal networks.35,38 To supplement these hypotheses, we will run additional analyses on symptom severity within the psychosis group. We expect that heightened severity of clinical symptoms will correspond with greater changes in global scaling, translation, and rotation.
2. Methods
2.1. Participants
Data for the current project was provided by the Center of Biomedical Research Excellence (COBRE) project.39 Data were collected and shared by the Mind Research Network and the University of New Mexico. Participants gave informed consent before participating in this work. The psychosis group included individuals diagnosed with Structured Clinical Interview for DSM Disorders (DSM-IV-TR) including schizophrenia (N = 61) or schizoaffective disorder (N = 10). The control group included 75 community controls (no DSM diagnosis) matched on demographic variables. Ages in these groups ranged from 18-65. Exclusionary criteria included: a history of neurological disorder, history of mental retardation, history of severe head trauma with more than 5 minutes loss of consciousness, history of substance abuse or dependence within the past 12 months. We also excluded participants with a diagnosis of bipolar disorder (N=5) or average framewise displacement during resting state scanning greater than 0.5mm (N=26). This resulted in 57 participants diagnosed with schizophrenia or schizoaffective disorder and 69 healthy controls. When analyzing group differences in transformation composites (described in section 2.8), we discovered outliers (N=1) using the generalized studentized deviate test.40 Once removed, this resulted in sample of 124 participants. Demographic and clinical information is included in Table 1.
2.2. fMRI acquisition and preprocessing
Structural 3D sagittal multi-echo MPRAGE images were acquired (Voxel size=1x1x1mm3; TR=2530ms; TE=[1.64, 3.5, 5.36, 7.22, 9.08]ms; FOV=256x256; Matrix=256x256x176; Flip Angle=7°; Number of echoes=5). Resting state fMRI runs utilized a gradient echo EPI sequence covering 64 axial slices (Voxel size=3x3x4mm3; TR=2000ms; TE=29ms; Matrix=64x64). Data were preprocessed using fMRIPrep 20.2.3 (RRID:SCR_016216,41; which is based on Nipype 1.3.1 (RRID:SCR_00250242). Full details of this pipeline can be found in supplemental material (S1).
2.3. Denoising procedure
Regressors describing motion, white matter intensity, and cerebral spinal fluid were extracted by fMRIprep (for details see S1.2) and applied to resting state data using the SPM12 software suite.43 Nuisance covariates included regressors for motion in the x, y, and z directions, their first derivative and a squared term for each of these 12 regressors.44 Two separate regressors accounted for cerebral spinal fluid and white matter signal. Spike regression45 was used to identify outlier images for each participant. Denoised residual images were concatenated for subsequent analysis.
2.4. Anatomically based region of interest selection
Regions of interest (ROIs) were defined in the AAL3 anatomical atlas (Rolls et al., 2020). We used software from the CanlabCore toolbox (https://github.com/canlab/CanlabCore.git) to extract signal from these ROIs. Seeds for connectivity analysis included voxel-wise time series information from frontal cortex regions (Figure 1a). A list of these seed regions can be found in supplemental table 1 (S2). We extracted average signal from target regions, which included all whole brain ROIs (Figure 1b).
_frontal_mask_used_to_def.tif)
2.5. Functional connectivity profiles
Functional connectivity profiles in the current work reflect connectivity between voxels in the frontal cortex and average signal from whole brain regions. As in prior work,32 we correlated voxel-wise timeseries data from frontal cortex voxels with average signal extracted from target regions. This resulted in a voxel-by-region connectivity matrix for all individuals in the sample.
2.6. Hyperalignment
We used a hyperalignment algorithm implemented in MATLAB (47) to align individual’s functional connectivity profiles to a group common space.30 Saved transformation metrics include three components: a translation matrix, a rotation matrix, and a global scaling coefficient. These reflect individual specific changes needed to match their connectivity profiles to group common space. Recent work highlights the importance of order in this version of hyperalignment as the initial reference image is defined by the first subject.46 To address this, we performed hyperalignment 100 times with random ordering. More information on the hyperalignment algorithm can be found in supplementary materials (S3).
Frobenius distances were calculated for translation and rotation matrices.47 Frobenius distances were averaged across the 100 runs of hyperalignment to describe total translation and total rotation. Positive values suggest more translation or rotation was required. Global scaling components are single values that reflect universal changes across all dimensions in the connectivity profiles. These were also averaged across the 100 runs of hyperalignment. Relatively large estimates indicate connectivity needed to be expanded (due to blunted patterns of connectivity).
2.7. Group level analysis – Support Vector Machine classification of diagnosis based on aligned and unaligned functional connectivity profiles
We applied a binary class linear support vector machine (SVM) using the ‘fitcsvm’ function in Matlab (version R2021b, Mathworks Inc., Natick, MA) to classify individuals with psychosis versus healthy controls. We ran a total of 1000 SVM models, which included 10 SVMs per run of hyperalignment. Each SVM employed a stratified 10-fold cross validation procedure that balanced the number of individuals with psychosis and controls across folds. Voxel-by-region correlations from functional connectivity profiles were input as predictors. Average accuracies from these models are reported for hyperaligned and unaligned data.
To assess whether accuracies were statistically better than chance, a second set of permutations were performed. Across 10,000 iterations, diagnostic labels were randomly shuffled and models using hyperaligned and unaligned data were refit to the model. When average accuracies from the initial models are compared to this null distribution, it results in a p-value that reflects the likelihood each accuracy is due to chance.48
2.7.1. Subgroup identification using voxelwise estimates of translation and rotation
Following classification, individuals with psychosis were split into quartiles based on diagnostic prediction accuracy. We identified individuals who were predicted accurately (>75%) and inaccurately (<25%). We generated voxelwise maps of translation and rotation estimates for all individuals in the sample. To accomplish this, we rotated translation matrices into an individual’s native space by applying inverse rotation matrices. We then summed the absolute value of translation coefficients within each voxel. This reflects the cumulative translation applied to each voxel across the 100 runs of hyperalignment. We calculated the equivalent voxelwise value for rotation matrices, resulting in a single translation and rotation map for each participant. We performed a two-sample t-test at each voxel to test for group differences in translation and rotation between individuals who were predicted accurately versus inaccurately. We adjusted t-maps for false discover rate (FDR<0.05) using the Benajamini-Hochberg method.49
2.8. Group level analysis - Whole frontal cortex transformation analysis
In three separate models, global scaling, Frobenius distance of translation, and Frobenius distance of rotation were related to a binary variable that distinguished individuals with psychosis from healthy controls. Additional models were run on individuals with psychosis to test for effects between positive and negative symptom severity with each hyperalignment composite. All models adjusted for sex assigned at birth, age, medication calculated in olanzapine equivalents, and average framewise displacement during the resting state scan. This resulted in 9 models. Significance was based on a permutation-based approach48 where outcomes were randomly shuffled 10,000 times and linear models were refit. Comparing original estimates to these empirically generated null distributions results to the p-value reported in the present work.
2.9. Identification of most translated and rotated voxels related to psychosis
Voxelwise translation and rotation maps, described in 2.7.1, were separately entered into a mass univariate linear regression. Identical models to those described in section 2.8 were fit to each voxel. This tested for the effect of diagnosis and symptom severity on voxelwise patterns of translation and rotation. We thresholded resulting t-maps using the Benajamini-Hochberg method49 to adjust for false discovery rate (FDR<0.05).
3. Results
3.1. Classification results
3.1.1. SVM classification of diagnosis
When applied to unaligned functional connectivity profiles, SVM accurately identified patients 66.50% (p=0.0009) of the time. Following hyperalignment, SVM accurately identified patients 65.85% (p=0.0011) of the time. The minimal difference in accuracies from these two models demonstrate convergent validity of these two types of data.
3.1.2. Voxelwise maps
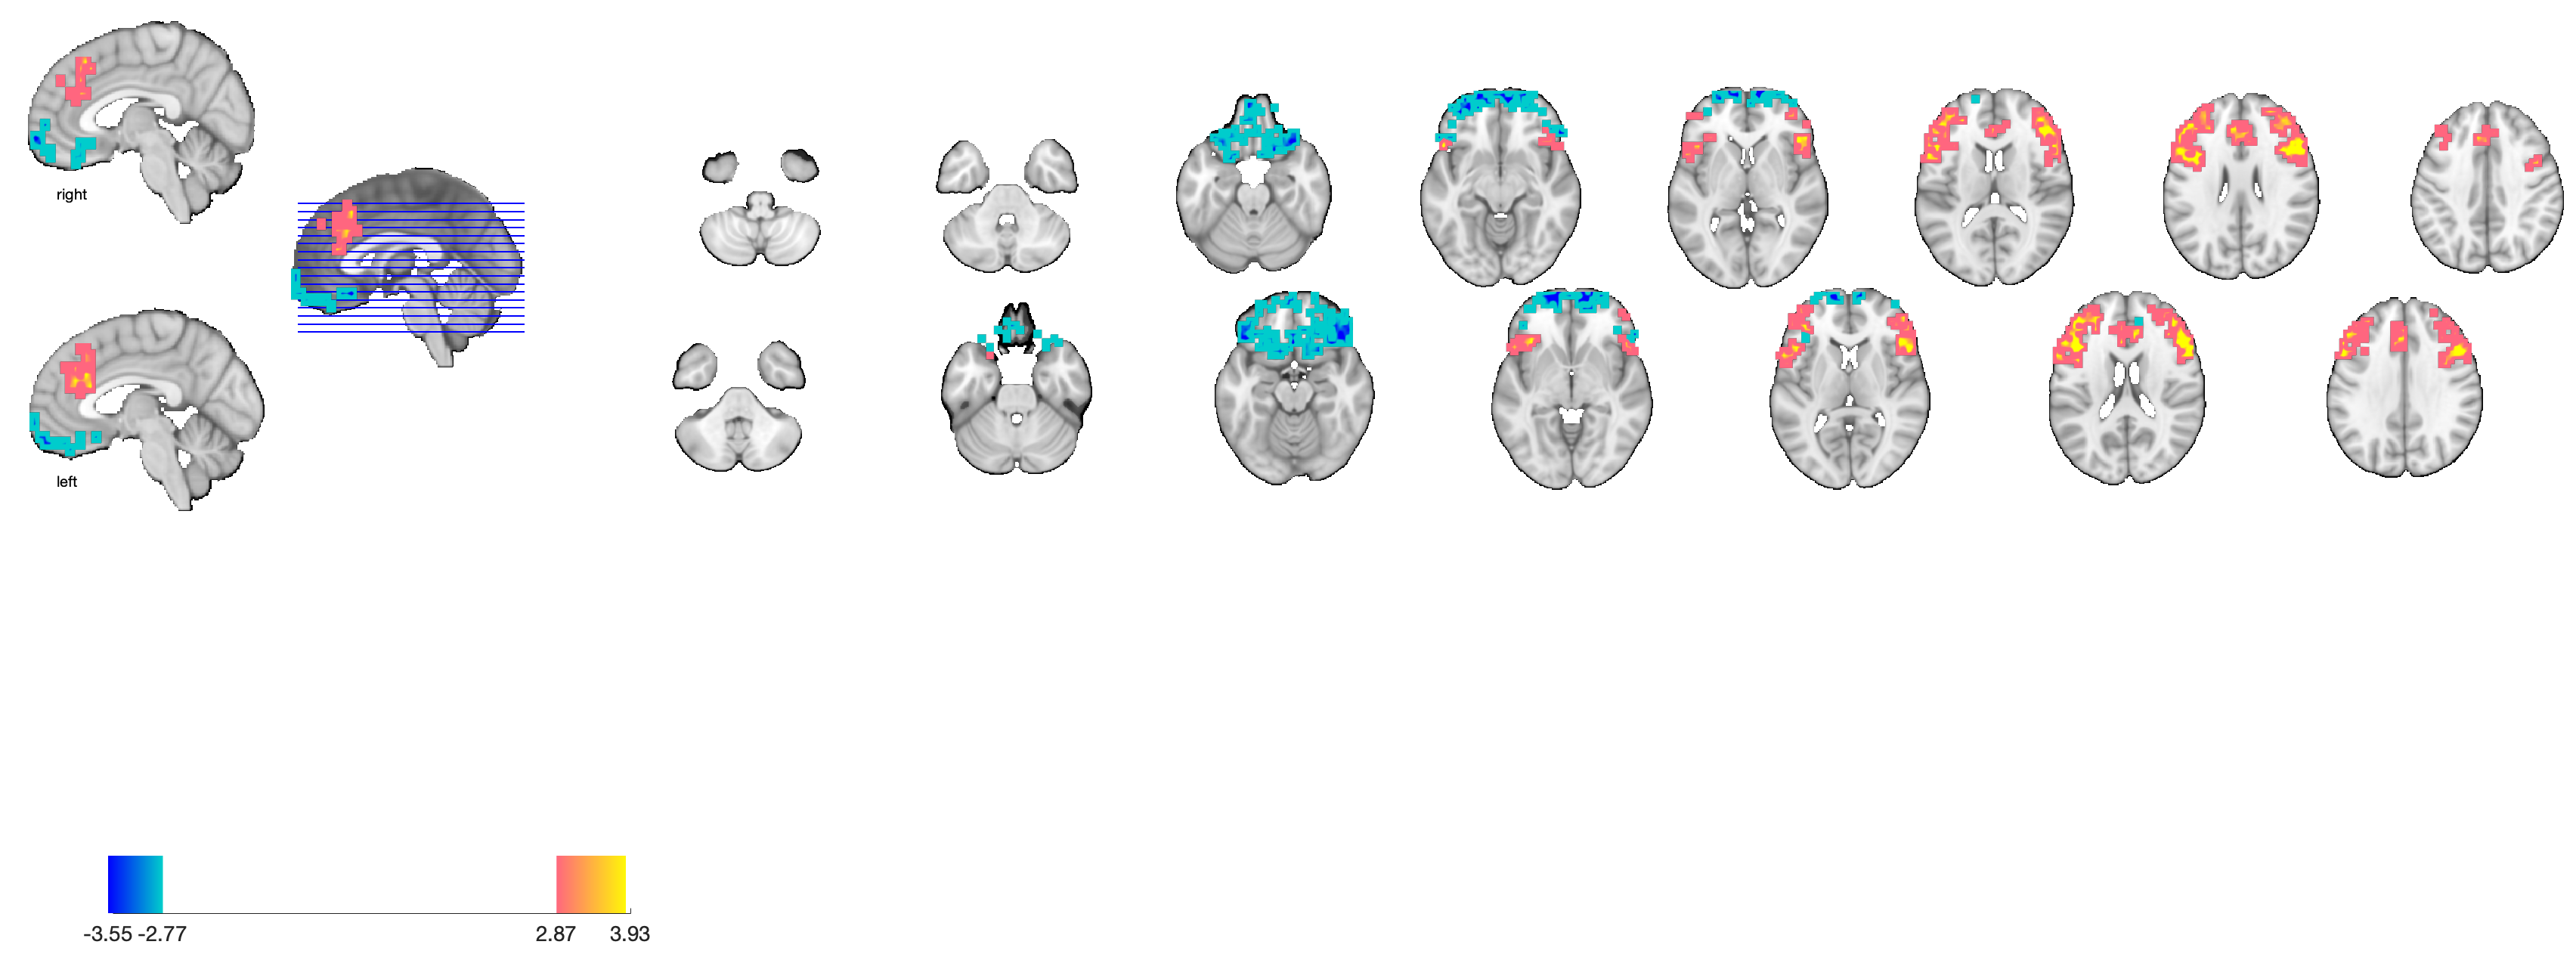
We contrasted voxelwise translation and rotation maps of individuals who were classified correctly (N=31) with incorrectly (N=20). We applied a cluster-extent threshold to resulting maps (FDR<0.05, cluster size>50). With respect to translation, no voxels passed the FDR corrected threshold. Rotation revealed several clusters displayed in Figure 2.

We identified several regions that fall into the contiguous clusters of voxels noted in Figure 2. Peak regions from contiguous clusters were identified and listed below in Table 2. Negative values reflect regions preferentially recruited by those who were classified accurately, while positive values highlight regions preferentially recruited by those with psychosis who classified incorrectly. There is notable overlap in regions like the anterior cingulate cortex and the triangular part of the inferior frontal gyrus, which suggests transdiagnostic changes.
To assess whether these findings were due to demographic differences, we ran a series of tests. The two groups did not differ in gender (chi-squared=0.159, p=0.690), age (t=1.53, p=0.133), race (chi-squared=1.15, p=0.562), olanzapine equivalent dosage (t=0.39, p=0.697), or motion during fMRI scanning (t=1.12, p=0.270).
We then tested whether differences were due to positive or negative symptoms using two general linear models. In these supplemental models, we adjusted for age, sex at birth, olanzapine equivalent dose, and average framewise displacement during scanning. We similarly did not find a significant difference between these two groups based on positive (t=1.58, p=0.232) or negative symptoms (t=1.79, p=0.080).
3.2. Diagnostic and symptom specific associations with hyperalignment transformation components
3.2.1. Diagnosis related changes in transformation components
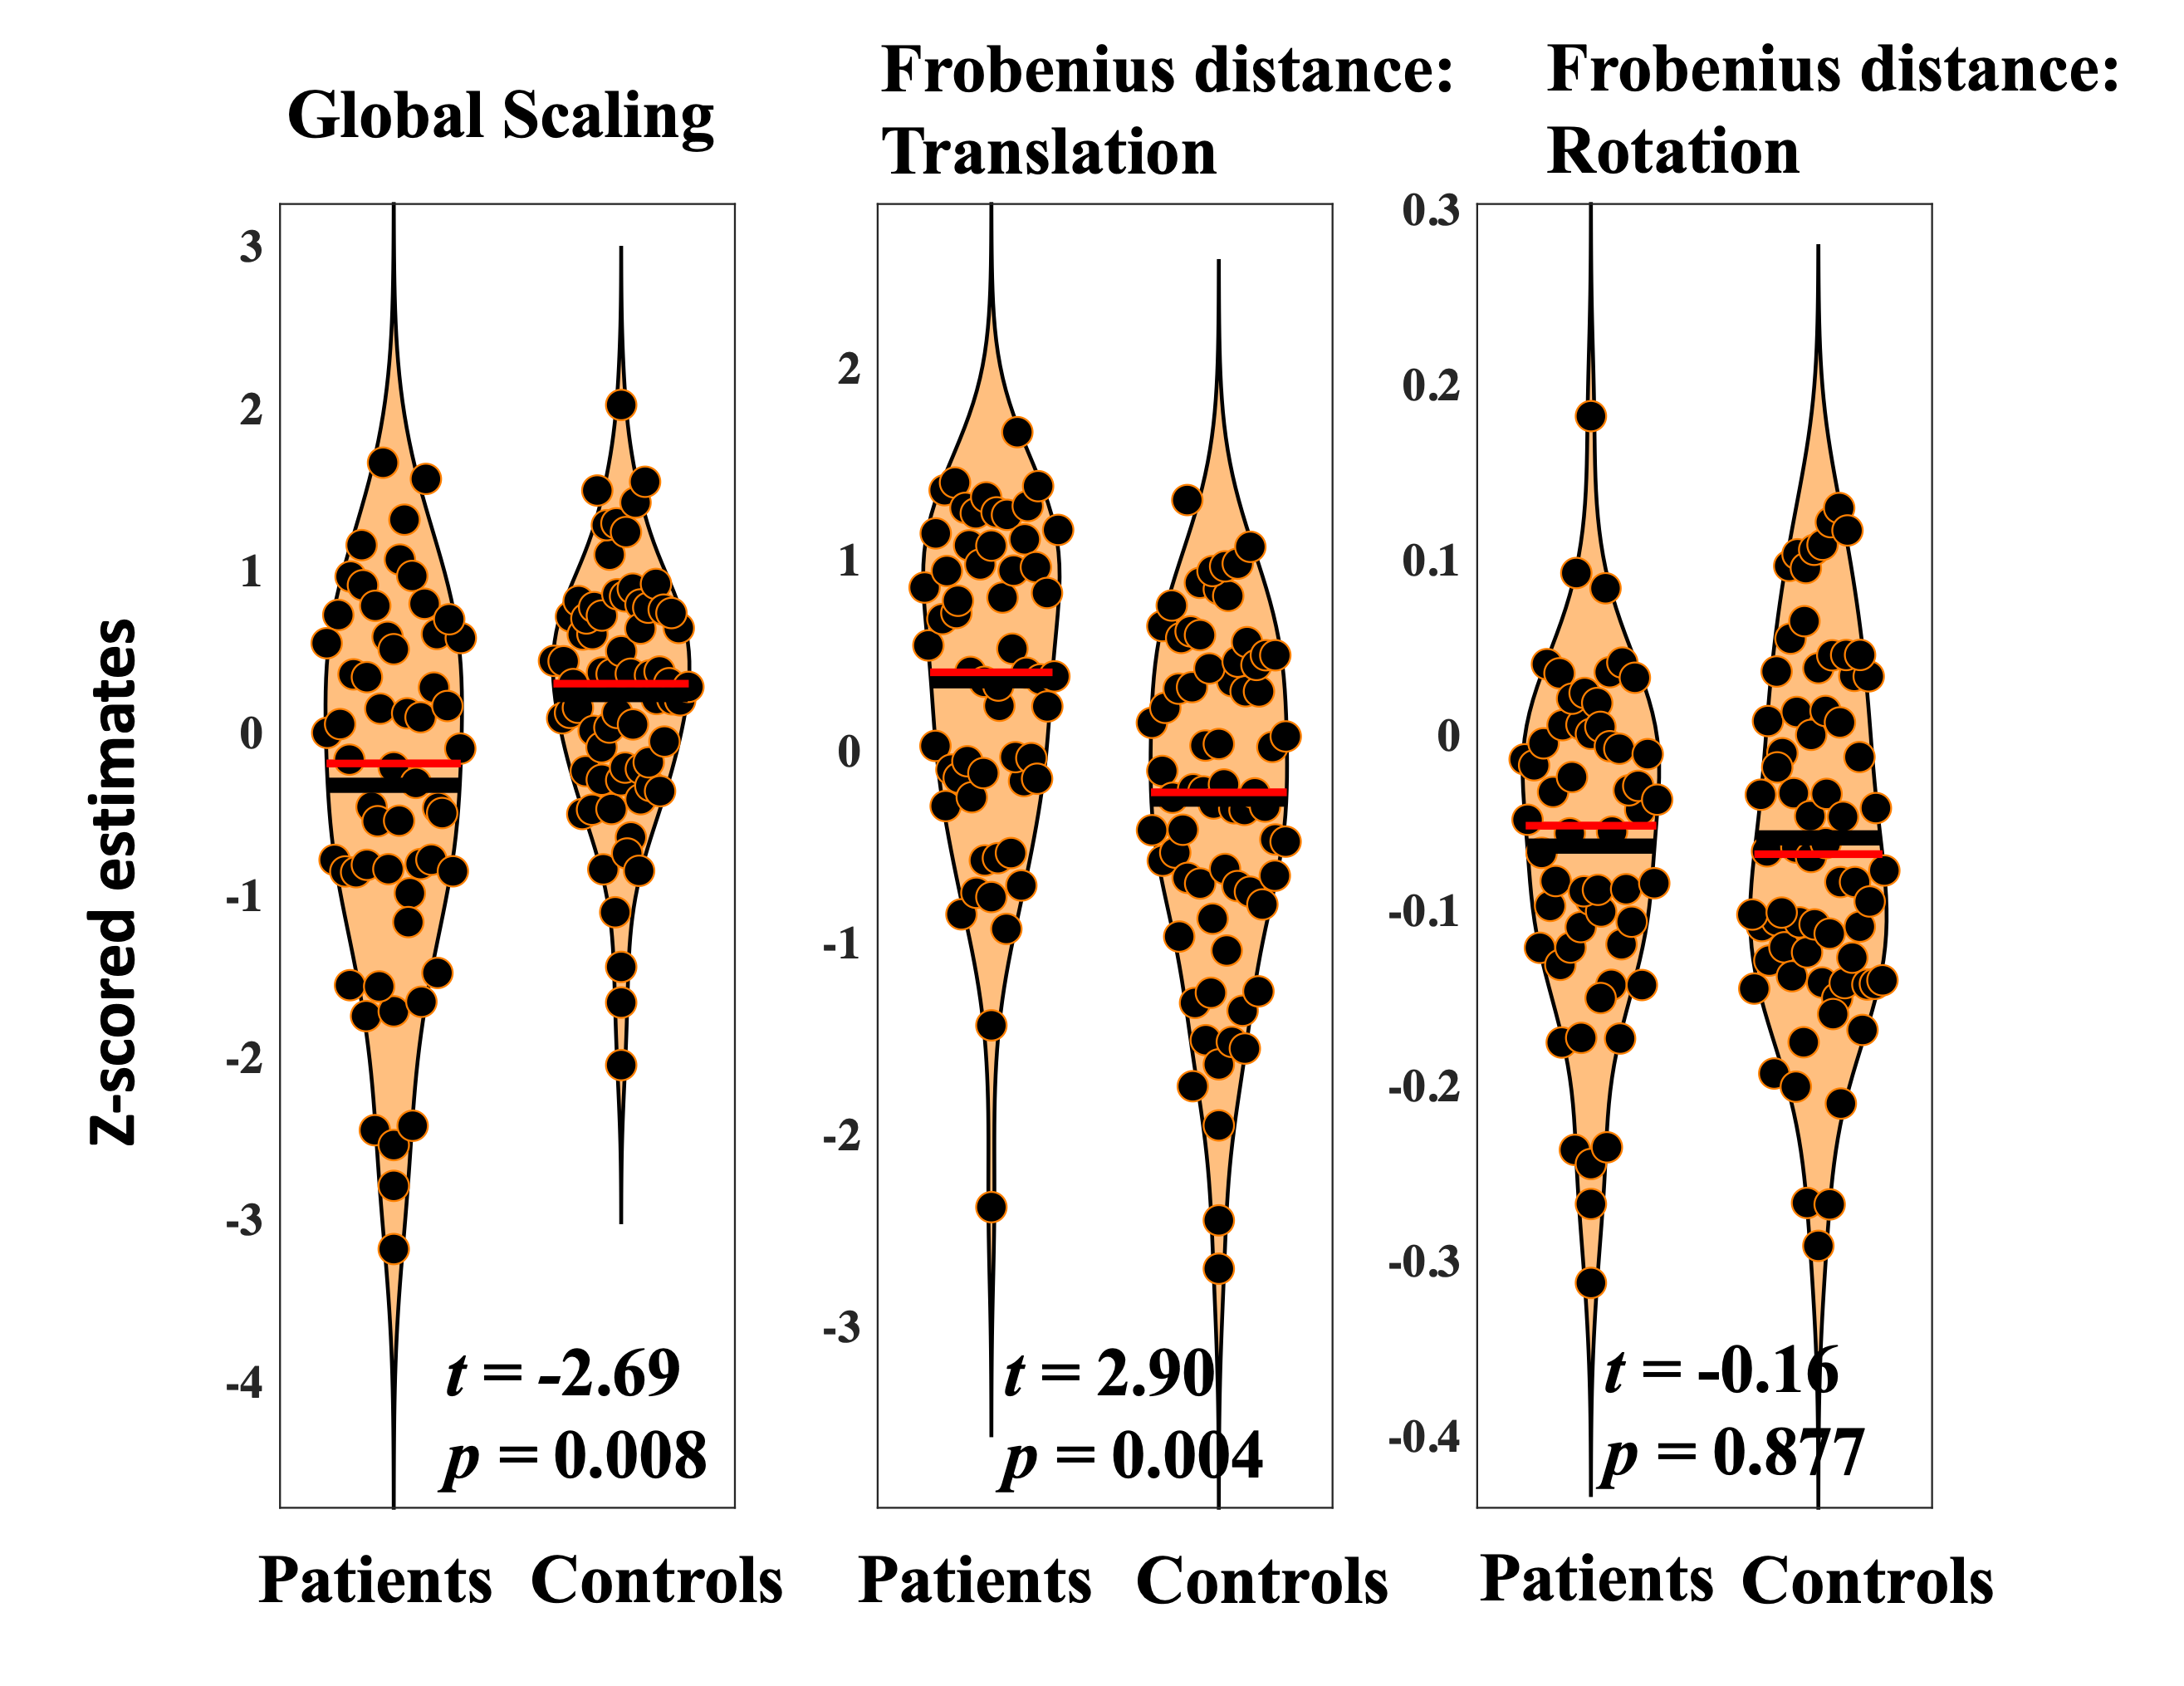
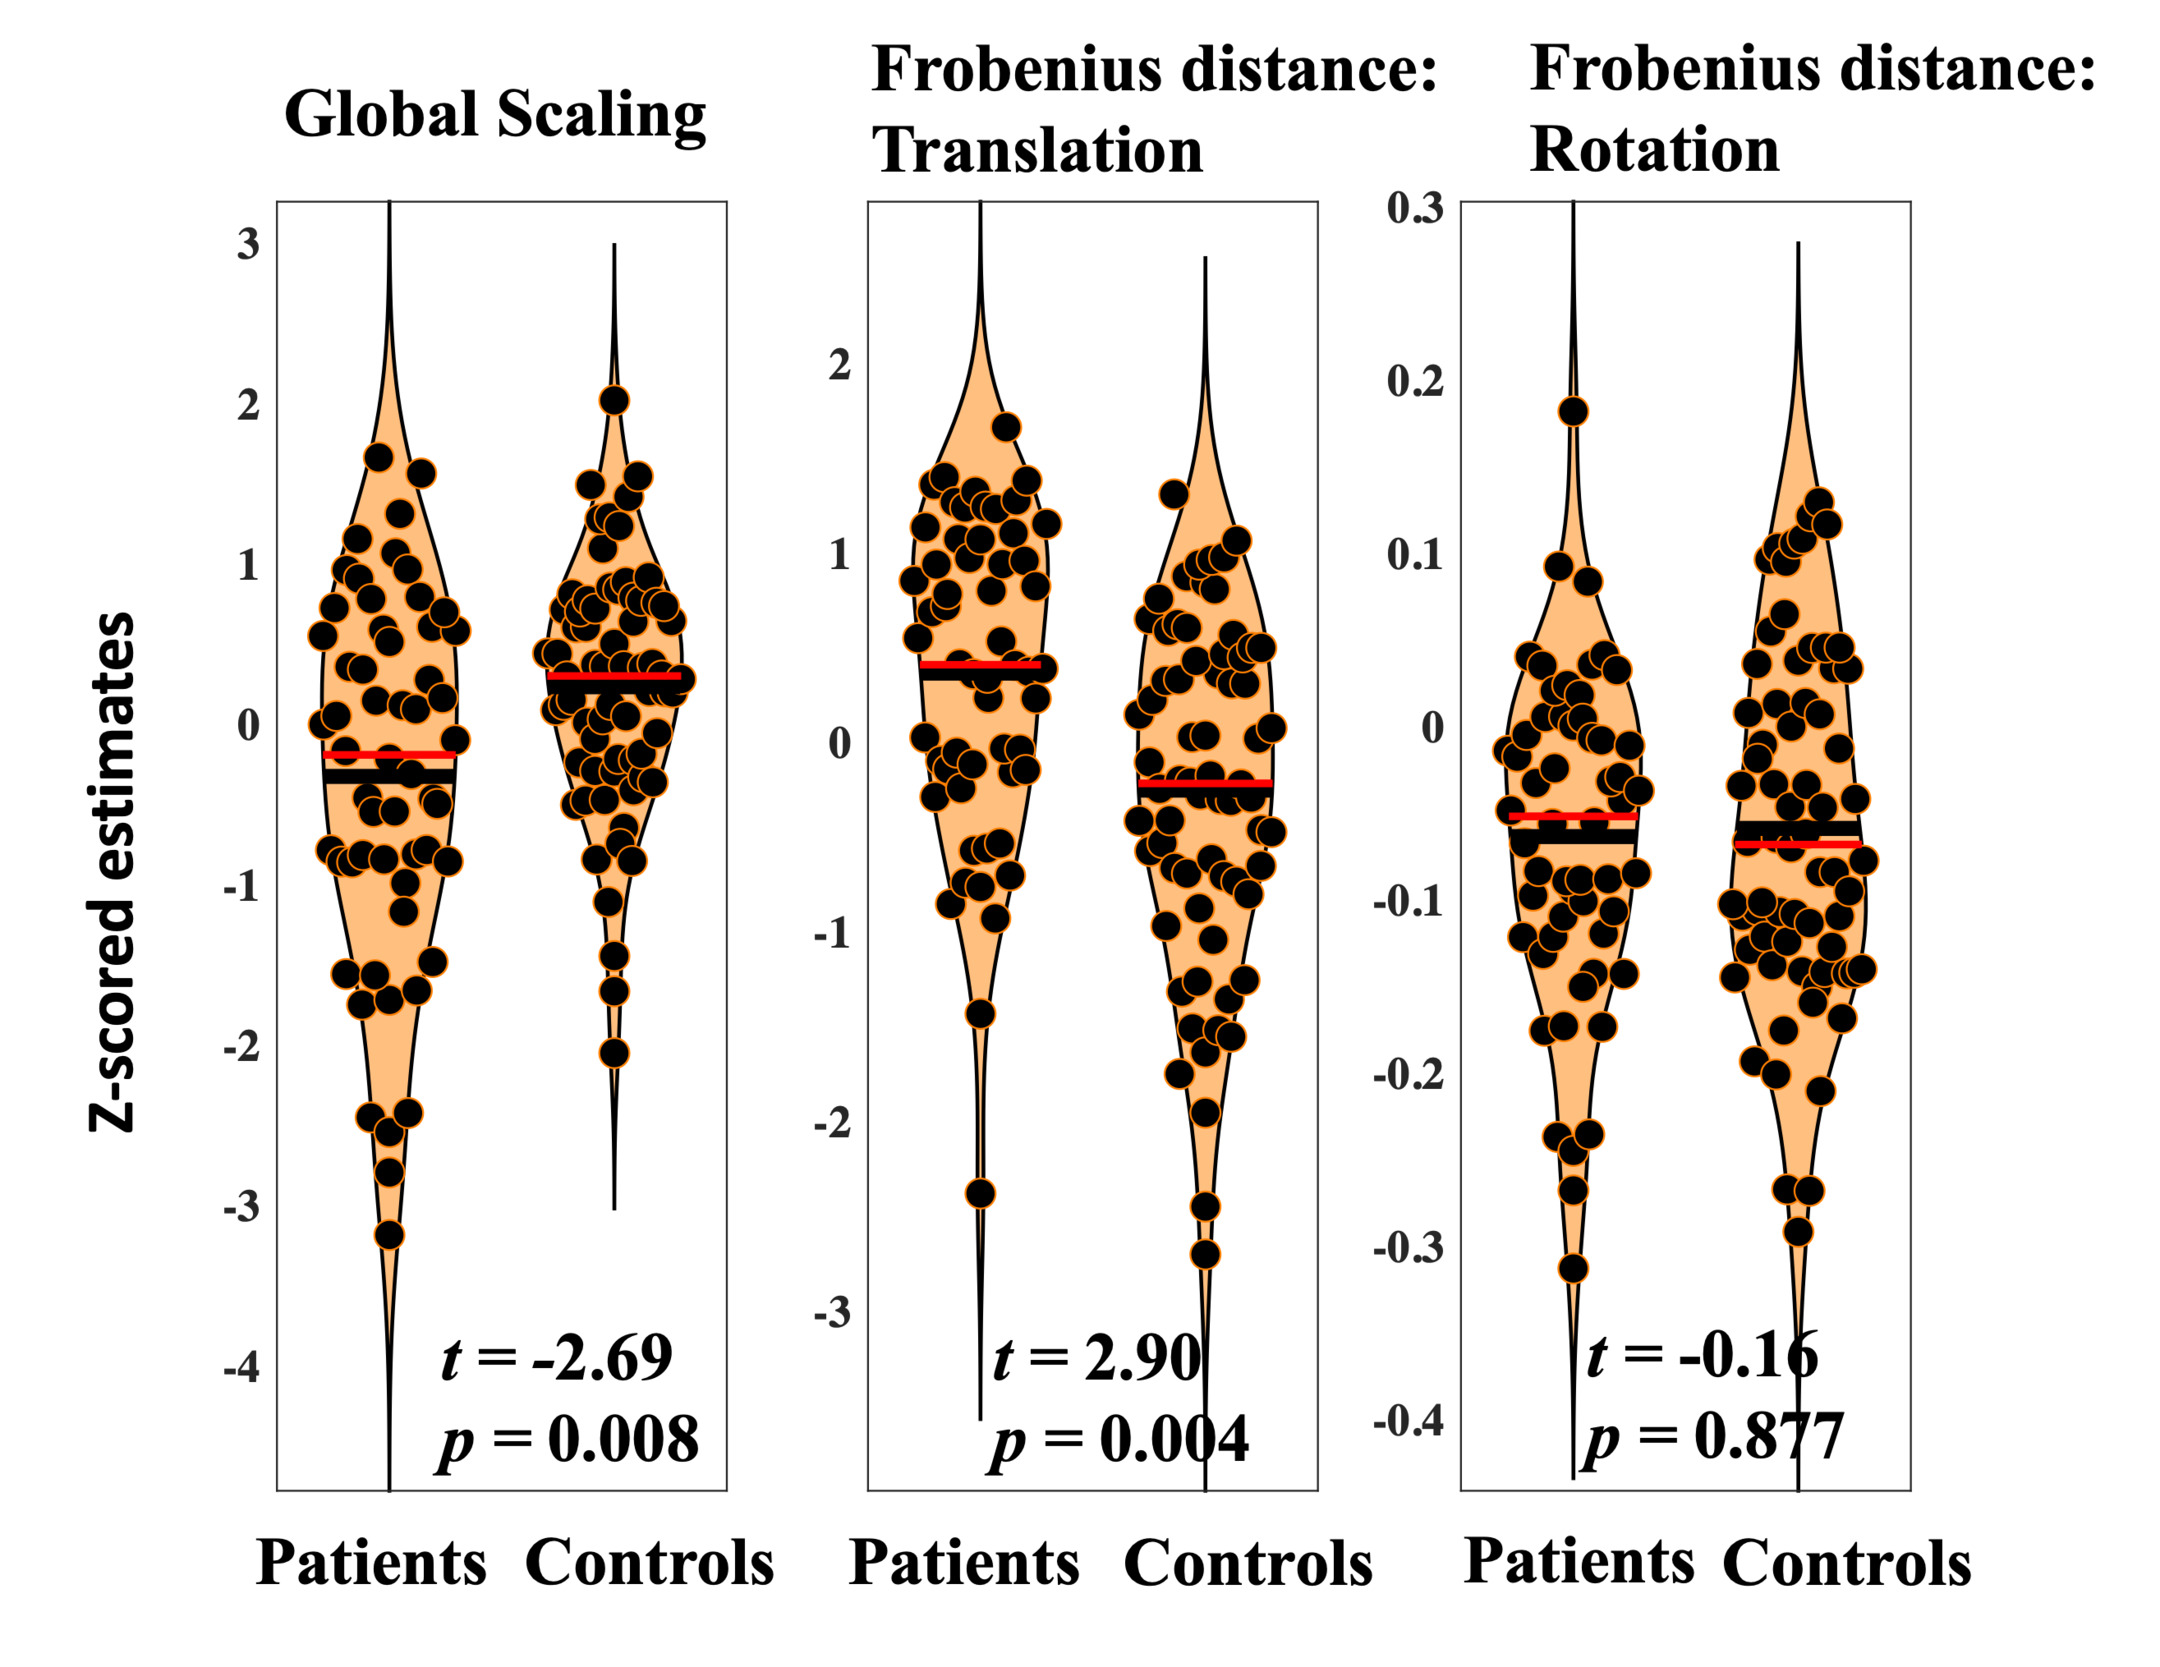
Diagnosis was significantly associated with reduced scaling (t=-2.69, p=0.008). Lower global scaling in individuals with psychosis suggests relatively high patterns of connectivity estimates across the frontal cortex that needed to be adjusted to fit common space. This may reflect global hyperconnectivity in psychosis.
Diagnosis was significantly associated with heightened total translation (t=2.90, p=0.004). Total translation reflects cumulative multivariate differences in voxelwise frontal connectivity. Results suggest that, when global hyperconnectivity is accounted for, baseline connectivity in particular voxels need to be increased to bring individuals with psychosis into common space. This may reflect patterns of blunted connectivity in those diagnosed with psychosis.
Diagnosis was not associated with differences in total rotation (t=-0.15, p=0.877). Average rotation across the frontal cortex is intended to reflect differences in the organization of frontal voxels during resting state scanning. Present findings may indicate that while translation and global scaling provide transdiagnostic biomarkers of psychosis, rotation reflects more individual specific information that allows for the identification of subgroups with distinct patterns of frontal connectivity. Results related to diagnostic differences in scale, translation, and rotation are displayed in Figure 3.
3.2.2. Symptom related differences in transformation composites
We ran six separate general linear models on individuals diagnosed with psychosis to test whether the severity of positive or negative symptoms was related to hyperalignment composites. We do not report a relationship between positive symptoms and global scaling (t=-1.45, p=0.154), translation (t=0.792, p=0.431), or rotation (t=0.217, p=0.829). We do not report a relationship between negative symptoms and global scaling (t=-1.73, p=0.089), translation (t=1.62, p=0.112), or rotation (t=-1.52, p=0.134).
3.3. Relationship between psychosis and voxelwise estimates of translation and rotation
Six separate mass-univariate tests were run to assess whether clusters of voxels might be associated with diagnosis or symptom severity in the present work. These included separate tests relating diagnosis, positive symptom severity, and negative symptom severity to voxelwise estimates of translation and rotation. No significant clusters passed a cluster extent threshold (FDR<0.05, cluster size>10 voxels).
4. Discussion
Schizophrenia is characterized by complex neurobiological changes that manifest in a heterogenous symptoms. While literature ties several brain changes to these symptoms, complex findings can be difficult to reconcile.6,19 To address this, we leverage transformations performed as part of hyperalignment. This allowed for the use of classification techniques as well as unique outcomes related to decomposed elements of the transformation itself.
We first applied a binary class SVM to unaligned and hyperaligned data. We found that both models performed better than chance with nearly identical accuracy. We believe this supports the convergent validity hyperaligned data, however it did not match our initial expectations. We assessed the extent to which voxelwise hyperalignment estimates of translation and rotation provided information about individuals who were classified accurately versus inaccurately. This resulted in the identification of two distinct neurobiological subgroups based on rotation estimates. In those who were accurately classified, brain regions throughout the inferior frontal cortex were preferentially recruited. Individuals incorrectly classified appeared to engage more dorsal regions of the frontal cortex. Overlap was present between groups that appeared in the anterior cingulate cortex and the triangular part of the inferior frontal gyrus. This overlap may reflect transdiagnostic neural features of psychosis, as other regions clearly delineate unique subgroups within the data. These groups showed no differences in demographic measures or motion during scanning. Marginally heightened negative symptom severity was present in those accurately classified by SVM, which suggests that subgroups may be characterized by distinct symptom profiles. Though small, this effect aligns with prior work that links specific symptoms to biologically defined subgroups.50 Our results also aligns with work showing blunted inferior frontal gyrus connectivity is associated with blunted affect, delusions, and hallucinations in psychosis.51,52 Aberrant connectivity in several of the additional regions is linked with poor regulation stress, perception, and emotions in psychosis.53 As such, rotation appears to provide information related to precise changes in the brain. Future work is needed to further explore this idea, which could have implications for research and personalized psychiatric medicine.
We then assessed how specific components of hyperalignment (global scaling, translation, rotation) were related to psychosis. With respect to diagnosis, we report significant differences in global scaling and the translation composite, which may capture complex imbalances in frontal connectivity. Individuals with psychosis exhibit reduced scaling. This transformation is applied to all voxelwise connections and suggests that psychosis is associated with global hyperconnectivity in patterns of connectivity across the frontal cortex. Subsequent translations are then applied to specific voxels to bring individuals to common space. Lower estimates in psychosis may reflect blunted connectivity in more specific frontal connections after scaling is accounted for. Dysconnectivity in psychosis is defined by complex alterations in excitatory and inhibitory connections throughout the frontal cortex, which involves both increases and decreases in standard measures of connectivity.16 Findings that link psychosis to both hypoconnectivity12,36,51,54 and hyperconnectivity35,55,56 in frontal networks underscores this variability. Hyperalignment appears to characterize both changes simultaneously with concise measures of complex patterns of connectivity (scale) and localized baseline connectivity (translation). More work is needed to assess the extent to which hyperalignment may be sensitive to these opposing effects.
We do not report significant differences in rotation related to psychosis. Hyperalignment works by applying optimized alignment parameters to bring individual brain data to common space. This involves the identification of regions that contribute preferentially to resting state connectivity networks, which is thought to be reflected in rotation estimates.33 Given the presence of subgroups noted in the present work, it makes some sense that a psychosis versus control analysis may not reveal differences. Everyone is being rotated. The location of rotation is what makes the difference.
4. Conclusions
We present a novel approach to studying brain data in the context of psychosis and report several differences throughout the frontal cortex. Global scaling and translation results add to prior findings in this dataset35,37 and potentially characterize imbalanced patterns of frontal connectivity. In addition, rotation appears to facilitate the identification of subgroups, using individual specific rotation estimates. These results highlight differential recruitment of brain networks active at rest and may underlie several cognitive and emotion related symptoms in psychosis. Current findings begin to establish the clinical and scientific utility of hyperalignment in clinical neuroscience as it may simultaneously highlight systematic and individual differences in brain data. The future application of this method may have major implications and more work is needed to gauge the efficacy of this method.
4.1. Limitations and future directions
The present work had limitations to be addressed in future work. First, we used an open-source dataset with limited resting state data available. Past work criticizes the use of brief resting state scans, which may be unreliable.57 Hyperalignment is believed to address sources of noise caused by inter-individual variation.8 As such, this method, perhaps combined with spatially constrained data-driven approaches,34 may be uniquely suited to address reliability concerns in brief scans. Second, we focused on psychosis diagnosis, which is known to be heterogenous.58 While we also perform analyses focused on individual symptoms, our sample was underpowered. Future work can increase sample size to explore precise relationships between symptoms and hyperalignment outcomes. Such increases may also include a higher number of individuals who are on anti-psychotic medication. This would enhance the ecological validity of the sample while also enabling future work to stratify models based on medication status. Third, while our sample relatively large, this does not eliminate recent concerns about reproducibility in fMRI.59 Future work should determine the reliability of current methods. Fourth, the present work did not apply distortion correction to resting state data as field maps were not collected. The acquisition used for the present study implemented a slower, more robust sequence to address potential signal problems in high susceptibility regions such as the inferior frontal gyrus. However, it’s possible that distortion correction could improve data quality and should be employed where possible. Finally, this work is cross-sectional and focuses on patients already diagnosed with psychosis. Future work should include developmental samples to better understand how hyperalignment metrics might relate risk for future episodes of psychosis.
Data and Code Availability
Data for the present work is part of the Schizconnect project, a publicly available database that integrates schizophrenia neuroimaging and related data from disparate, heterogeneous databases. It provides access to multi-site, multi-dimensional, multi-modal data all in one place. This data can be found at schizconnect.org
Code for the version of hyperalignment used in the present work is publicly available. It can be downloaded as a Matlab toolbox. The citation is provided in the References section.
Author Contributions
ZA worked to conceptualize the current project, managed data, ran processing steps, ran analyses, wrote the initial draft of the manuscript, and made all edits throughout the creation. JT worked to conceptualize the current project, was involved in the initial creation of the Schizconnect database, provided access to the data, contributed to analysis, contributed to processing, and edited all versions of the manuscript. YA worked to conceptualize the current project, contributed to processing, contributed to analysis, and edited all versions of the manuscript. VC worked to conceptualize the current project, contributed to analysis, and edited all drafts. VM worked to conceptualize the current project, contributed to analysis, and edited all versions of the manuscript.
Funding
Funding for the Schizconnect database was originally provided by the National Institute of Mental Health (NIMH 1U01 MH097435)
Funding for ZA was provided by two NIH T32 grants over the course of this project (T32 EB025766; T32 NS047987)
Declaration of Competing Interests
The authors deny any conflicts of interest.