Given the growing interest in ultra-fast functional Magnetic Resonance Imaging (fMRI) mapping, we are providing an optimized pulse sequence method for a 2D line-scanning technique, allowing for the detection of dynamic MRI signals with a high temporal resolution (6 ms). Afonso et al. first implemented the line-scanning scheme to the Fast Low-Angle SHot (FLASH) fMRI method and achieved the temporal resolution with a 40 ms repetition time (TR) to differentiate laminar-specific Blood Oxygen Level Dependent (BOLD) signal onsets across the cortex.1 Yu et al. further developed a line-scanning-based single-vessel fMRI method to characterize distinct BOLD and Cerebral Blood Volume (CBV) signals from individual arterioles and venules in the rat somatosensory cortex with 100 ms TR and 100 x100 µm2 in-plane spatial resolution.2 Lately, Toi et al. has shortened the TR of this line-scanning 2D sequence to 5 ms, and setup a repetitive 5 Hz stimulation paradigm that is matched with the k-t space acquisition scheme, revealing evoked T2* MRI signal changes in the tens of millisecond scale.3 This work addresses an intriguing observation using MRI to directly detect neuronal activity in the brain; a topic that has been investigated by many scientists in the past few decades .4–17
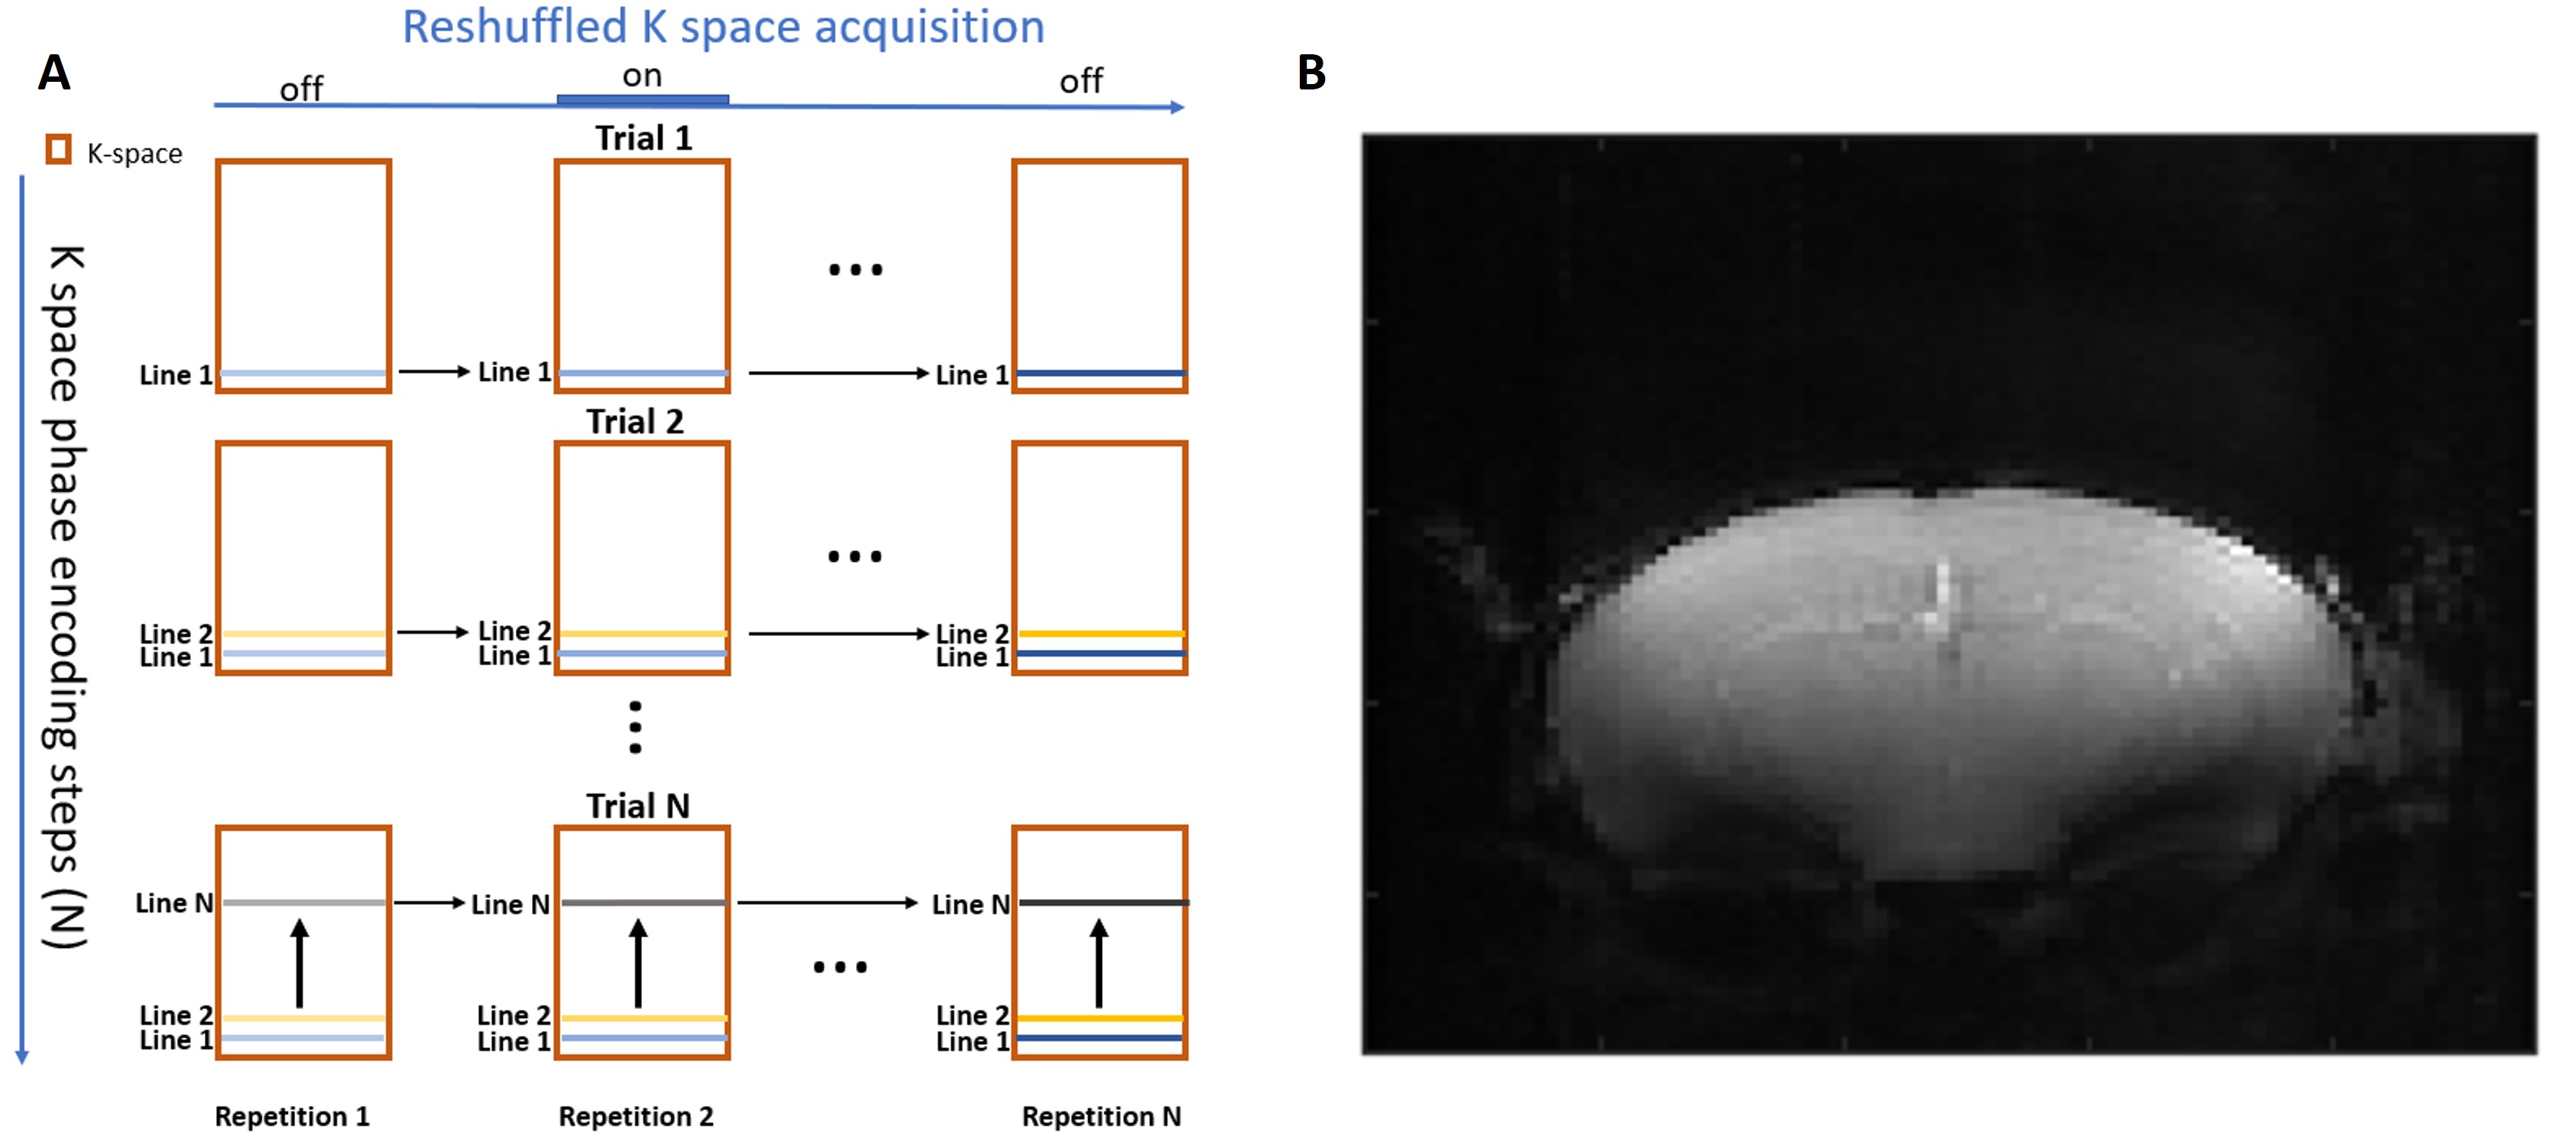
This 2D line-scanning mapping method enables the ultrafast sampling of MRI signals by reshuffling single k-space line acquisitions across multiple repetitions as the function of time for a given block design stimulation paradigm.18 The k-space used to reconstruct each image in the time series is composed of interleaved k-space lines through the stimulation paradigm. Different from real-time fMRI mapping, this 2D line-scanning method acquires reshuffled fMRI datasets that could contain aliased oscillatory signals from confounding sources. A better understanding of the sequence parameters, as well as the detailed methodological acquisition and triggering schemes, is crucial to implement this method for further brain mapping studies. The goal of this paper is to provide a readily applicable method to the MRI research community, facilitate the application of ultrafast fMRI imaging methods to map vessel-specific hemodynamic fMRI signals, and investigate the newly reported direct neuronal activity mapping with MRI in animal models.
This method provides itself to be used over a wide range of target regions. For example, investigations into the visual field would highlight alterations of visual cortex under visual stimulation. Additionally, investigating the barrel cortex would show somatosensory based responses of vibrissa stimulation. Furthermore, this method could be used to investigate the different vessel-specific hemodynamic fMRI signals acquired from transgenic models of neurodegenerative diseases.
This FLASH-based fMRI pulse sequence is available at https://tnnc.mgh.harvard.edu/method/, and includes a user manual readme file to assist in implementation. In the link, we provide sequence scripts and binary code, which has been developed for use on Bruker scanners (specifically using ParaVision 360 v.3.3 and ParaVision 6).
Here, we highlight three methodological settings in the simulated pulse sequences (Fig. 1) that are crucial when implementing the 2D line-scanning method:
-
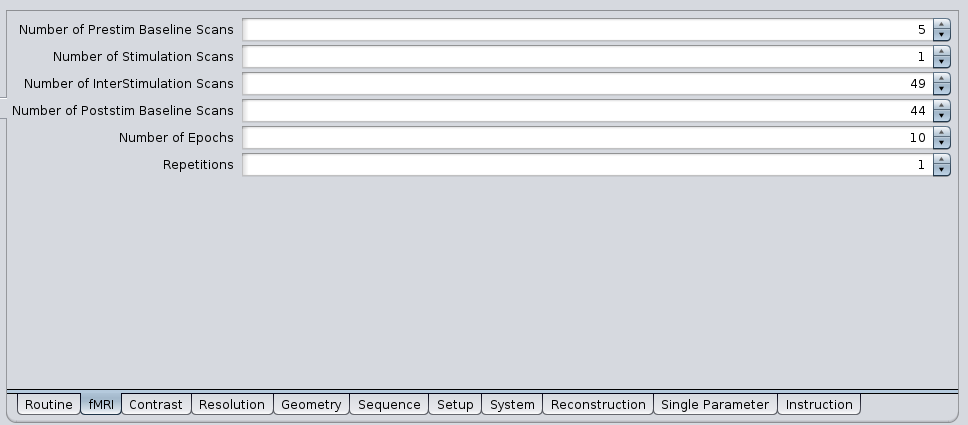
A built-in Transistor-Transistor Logic (TTL) trigger out script is programmed in the .ppg file so that the stimulation paradigm can be directly input through the PV360/6.0 GUI (Fig. 2). In particular, the default delay time for the trigger out pulse is set at the microsecond scale.
-
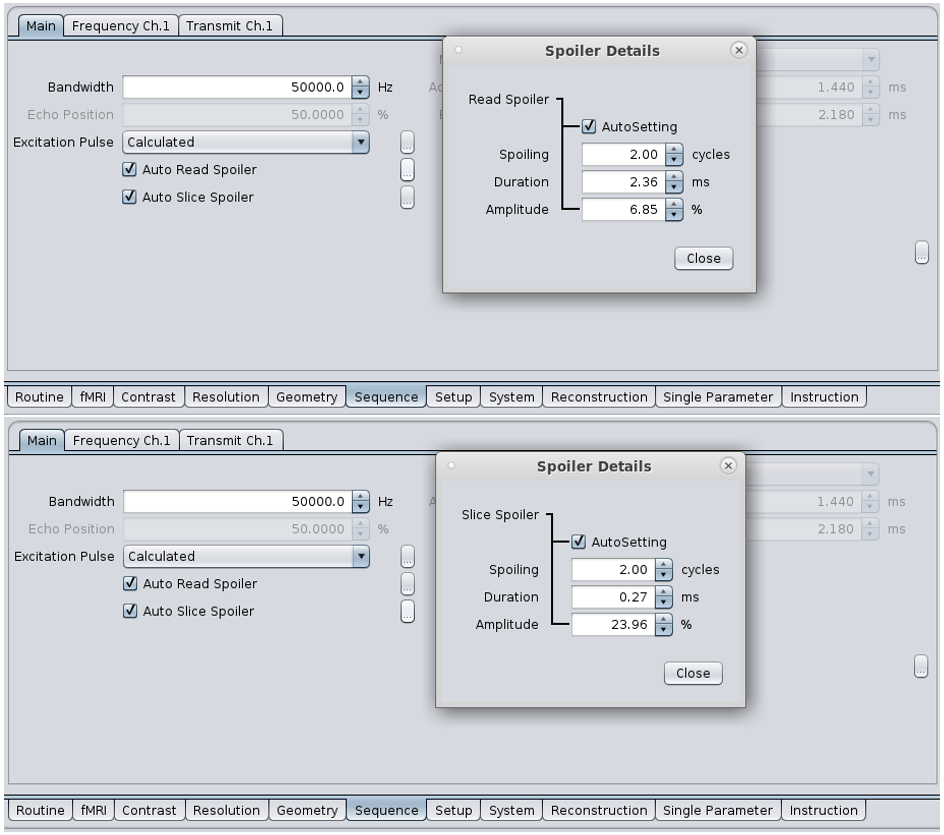
The spoiling gradient for each TR is highlighted in the sequence for users to test the potential of a diffusion-related gradient’s impact on in vivo studies. Both slice and read spoiling gradients are easily manipulated through the check box as seen in Fig. 4.
-
The total TR time is calculated to be precise in the microsecond scale.
**_graphic_visualization_of_single-line_k-space_sampling_using_the_line-scanning_flash.jpg)


_and__slice__(**bottom**)_spoile.png)
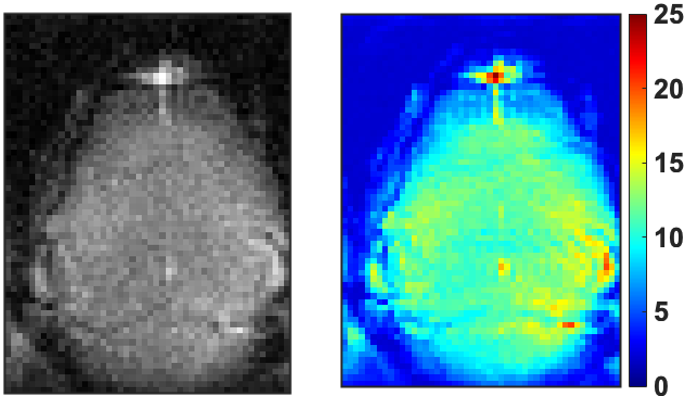
Eventually, this 2D line-scanning sequence can directly be compiled for testing at user sites. Also, a video tutorial for beginners who want to use the method is available at https://www.youtube.com/watch?v=GCY6XPGdO_s. Fig. 3 shows the example of the reconstructed 2D line-scanning image of an in vivo C57BL/6J mouse brain collected using a 14 T/13 mm horizontal bore magnet (Magnex Scientific, Oxford, UK), interfaced to a Bruker AV-Neo console (Bruker, Billerica, MA, USA), and equipped with a 6 cm gradient set (Resonance Research Inc., Billerica, MA, USA) using a custom built surface transceive radio frequency coil (9x11mm single loop) positioned and secured with medical tape over the mouse’s head with the following parameters:
- TE/TR = 1.2/6 ms, Flip Angle = 6°, FOV = 12.8 x 9.6 mm2, matrix size = 64 x 48, slice thickness = 1 mm.
Functional experiments can be performed by applying a stimulation task (e.g., visual or electrical simulation) and the fMRI paradigm can consist of 30 ms pre-stimulation (Number of Prestim Baseline Scans = 5), 10 ms stimulation (Number of Stimulation Scans = 1), and 260 ms post-stimulation (Number of Poststim Baseline scans = 44) with a total of 300 ms repeated 10 times (Number of Epochs = 10) to total 2 min 24 sec. It should be noted that we use a Master-9 AMPI system (Jerusalem, Israel) to precisely control the stimulation duration needed for the stimulus paradigm. A deeper explaination of the parameters are as follows: StimNum 1 (number of stimulation scans) indicaters that a trigger signal is sent to Master-9 AMPI system where the stimulation duration is set. In this case, 10 ms stimulation duration was set with Master-9 AMPI (Fig. 5). To set a total of 300 ms, the total number of the fMRI paradigm loop should be 50 (based on a TR of 6 ms) on the PV360/6.0 GUI (Fig. 1B). Thus, PostBaseLineNum (number of post-stimulation baseline scans) should be:
- total number – (PreBaseLineNum + StimNum); 50 – (5+1) = 44.
Since the total duration is 300 ms, post-stimulation duration should be determined by:
- total duration – (pre-stimulation duration + stimulation duration); 300 – (50+10) = 240 ms.

Given TR 6 ms and the T1 value of cortex (~2100 ms at 9.4T),19 the Ernst angle is ~5°. Thus, a flip angle of 6° was used as an optimal flip angle to target cortex at 14T. Since a short TR is chosen for ultrafast FLASH-based 2D line-scanning imaging, fresh blood may enter into an imaging plane. However, given cerebral blood velocities of rodents,20 inflow effects can be minimized by using short TR (i.e, 6 ms) and thick slices (i.e., all flowing spins in the imaging plane experience the same number of RF pulses). To enhance the image quality of the 2D line-scanning, the orientation of the line scan should be a direction covering a relatively large FOV (e.g., rostral-caudal direction in the axial view), which allows minimizing motion artifacts with less phase encoding steps (e.g, left-right direction in the axial view) and also avoids aliasing artifacts along the large FOV in rodent brains (Fig. 3). If those artifacts appear in the image plane, one should check if readout and phase encoding directions are correct in terms of the desired imaging protocol.
Funding
This work is supported by funding from NIH R21NS121642, NSF 2123970, NIH R01NS122904, and NIH R01NS120594.