


Introduction
Estimating effect size is critical in power analyses and can provide valuable insight throughout the experimental design process.1–3 Various tools have been developed to facilitate power calculation for functional magnetic resonance imaging (fMRI),3–6 requiring users to provide effect size estimates. However, establishing effect sizes for study planning can be challenging for fMRI researchers. Estimates obtained from pilot studies can be highly imprecise due to small sample sizes. Further, it is difficult to obtain effect estimates from the literature because they are often either not reported at all or not reported across the whole brain, and may be inflated due to publication bias. These challenges may lead researchers to abandon the use of effect size estimates or guidelines when planning their studies, which contributes to low rates of reproducible findings in the field.
To address this gap, we introduce BrainEffeX (the Brain Effect size eXplorer), a web app that is designed to facilitate the sharing and exploration of “typical” effect sizes for fMRI studies. Leveraging large (n > 400), publicly available datasets, we conducted brain-behavior correlations (r), task vs. rest contrasts (t), and between-group (t2) analyses with various common tasks and phenotypes for both functional connectivity (FC) and task-based activation maps. In light of the recent traction of multivariate methods,7,8 we included multivariate versions of all analyses, and we also provided results from pooling across edges or voxels prior to analysis. While the term multivariate often refers to prediction, here it is used purely for explanatory purposes. We transformed all results to both Cohen’s d and R2 estimates of effect size and calculated simultaneous confidence intervals.
The present manuscript is intended as user-, contributor-, and developer-oriented documentation for using, contributing to, and understanding the BrainEffeX web app. A separate manuscript in preparation discusses further details about the statistical methodology, results from the analyses, and open questions.
Section 1. For users
App overview
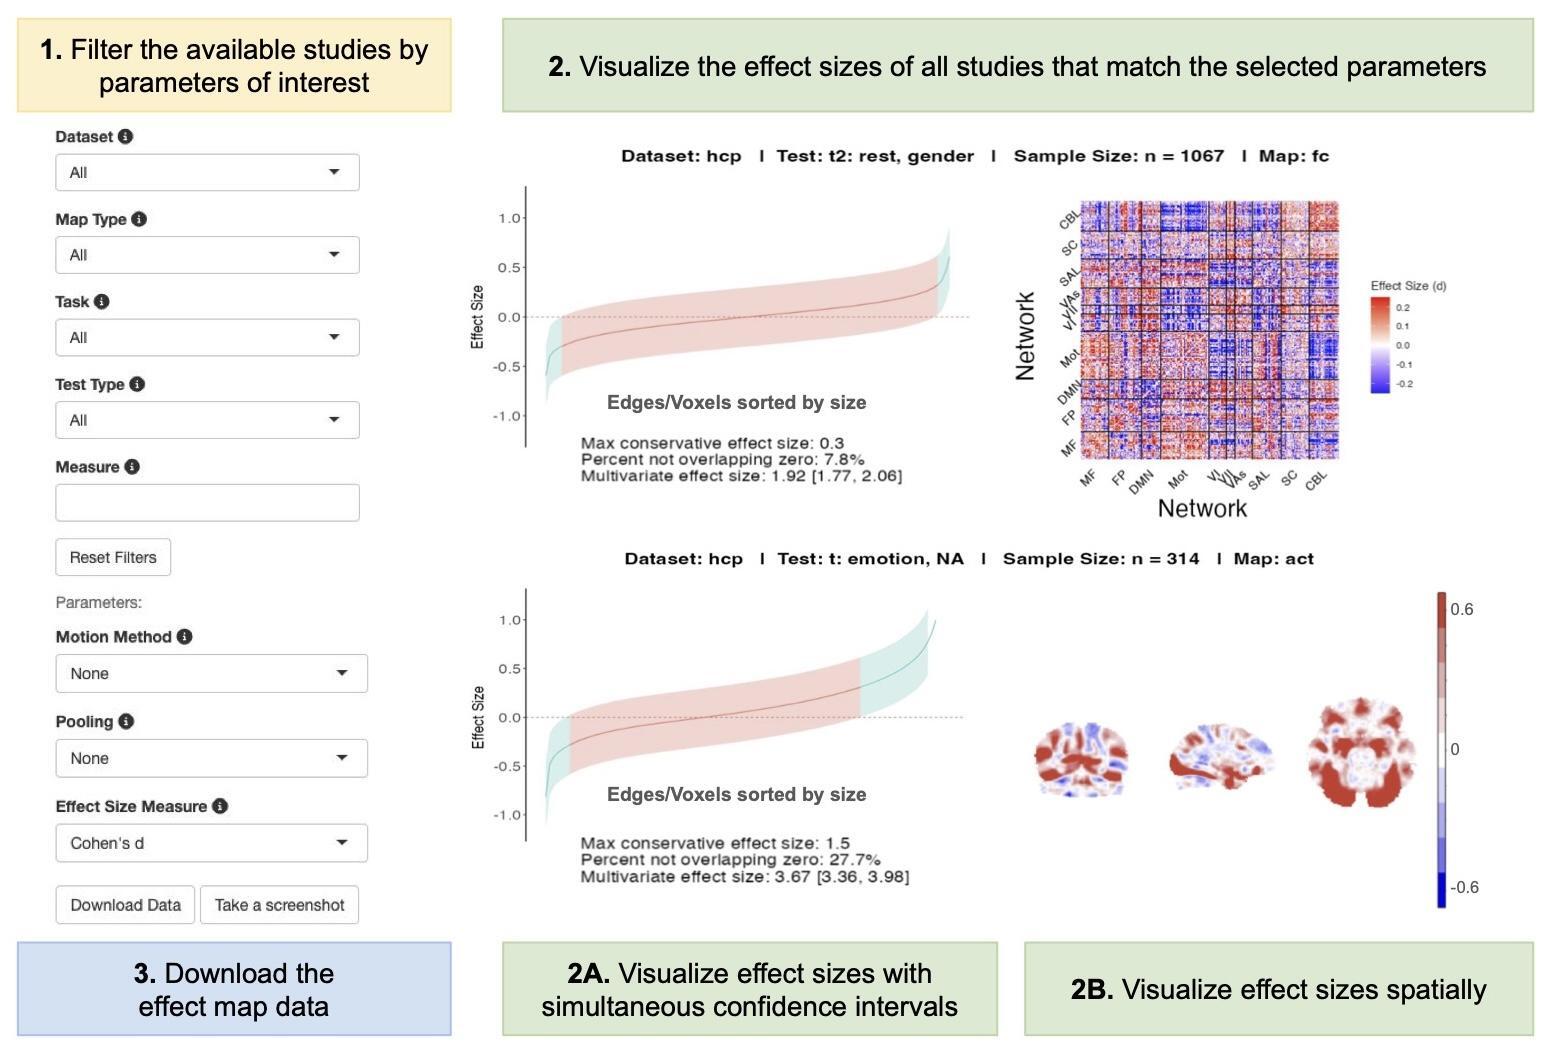
BrainEffeX (accessible at neuroprismlab.shinyapps.io/BrainEffeX) enables the interactive exploration of neuroimaging-based effect sizes in a variety of ways (Figure 1). Users can explore and visualize the effect sizes resulting from different univariate and multivariate analyses of large fMRI datasets. This will help researchers answer questions such as “What effect sizes can I expect for the association between functional connectivity in network X and phenotype Y?”, “What type of brain-behavior correlations show the largest effect sizes?”, and “Which brain regions show the largest effect sizes during a given task?”.
The app is organized into three main pages. Effect maps from various studies can be found on the main tab (Explorer). Results from meta-analyses across study categories can be found on the meta-analysis tab. More information about each study, including sample size, details about the task conducted, details about the measure or phenotype involved, and preprocessing information can be found on the “Study Info” tab.

Filter studies (Figure 1.1)
Users can filter the available studies by dataset, map type (FC or activation), task, test type, and measure. Of the available studies, users can specify methods of motion correction (none, motion regression, or thresholding), pooling (none or network-level pooling), and effect size estimation (Cohen’s d or R2). See Figure 2 for a snapshot summary of currently available data at the time of publication.
Visualize effect sizes (Figure 1.2)
Simultaneous confidence interval plots (Figure 1.2A)
Each plot in this panel represents a different “study”. The study shown is described by the heading at the top of each plot. The heading includes the test type (r, t, or t2), the two components of the test (i.e., “r: rest, age” means a correlation between resting-state data and participant age), the dataset name, the map type (FC or activation), and the sample size. All edges/voxels of the study are ranked from smallest to largest effect size and plotted in ascending order along the x-axis. The simultaneous confidence intervals (corrected for multiple comparisons) are plotted for each effect size, creating a ribbon between upper and lower bounds. The maximum conservative effect size - the largest of the absolute values of the simultaneous confidence interval bound closest to zero (lower bound for positive values, upper bound for negative values) across all edges/voxels - is displayed beneath each plot.
Matrices (Figure 1.2B)
For FC studies, effect sizes are also shown in the form of matrices with nodes organized into networks when applicable. A single effect size matrix is shown for each FC study and is updated to reflect different user selections such as effect size estimate or pooling. Since the parcellation scheme is selected by data contributors during preprocessing before data is provided to us, the parcellation scheme of these matrices can vary across datasets or studies.
Activation Maps (Figure 1.2B)
For activation studies (i.e., task vs. rest), axial, coronal, and sagittal slices of effect maps are displayed (x = 30, y = 30, z = 30). To view the whole activation map for a given study, users may download the data.
Meta-Analyses
Results from meta-analyses of effect sizes across test types (r, t, t2) and categories (age, biometric, psychiatric, cognitive, cognitive task, sex) can be found on the meta-analysis tab of the app. For each meta-analysis, simultaneous confidence interval plots and spatial maps are displayed.
Download (Figure 1.3)
Data
Users have the option to download the data by selecting ‘Download Data’ (Figure 1.3). This redirects the user to the data file available on Open Science Framework. The data file contains study information, binary brain masks (representing either the FC triangle or brain voxel mask for each study), effect maps for each study, and meta-analysis effect maps. See Figure 5 for more information on these data formats.
Visualizations
Users can download individual plots from the GitHub repository in the figures directory or take a screenshot of the whole page with the ‘Take a screenshot’ button below the filters.
Example workflows
Example 1: Estimating effect sizes for a standard power calculation
Motivation
Performing a power calculation is a critical step in study planning. By specifying the estimated effect size a study is designed to detect, we can calculate how many participants (or units of measurement) will be required to detect that effect if it is truly present (i.e., the null hypothesis is rejected). Larger effects generally require fewer subjects to detect compared to smaller effects. This can be thought of intuitively: every measurement contains some aspect of noise, and as we obtain more measurements, we can estimate the true effect in the data with greater precision. If the size of the effect is much smaller than the amount of noise in the data, then many measurements are required to combat such noise and detect the small effect. Alternatively, if the effect is much larger than the noise, fewer measurements will be required to detect the effect. As such, an ‘underpowered’ study would not include enough measurements to detect the effect even if it is present. For fMRI studies, conducting underpowered studies can be especially costly since data collection is expensive.9,10 Many studies unknowingly use small sample sizes to detect a small effect, which can lead to false negatives that discourage further investigation. Our tool can support these situations by specifying the sample size needed to detect the effect of interest, such that future research of null result studies is possible.
Therefore, a power analysis is a critical step in study planning. In fact, many funding agencies require a power analysis to justify the expected sample size for the proposed project. While BrainEffeX is not designed to perform power calculations, it can provide effect size estimates that may be utilized to provide guidelines for sample size calculations. The following section provides instructions for this application of BrainEffeX.
Step-by-Step
-
Filter the studies to fit the study design of interest as closely as possible. BrainEffeX will likely not have an exact match for your study design, but you should select parameters that you expect to produce similar effect sizes. For example, if you are designing a study relating FC to grade point average, you could explore studies of similar attributes such as IQ or fluid intelligence since grade point average is not currently included in BrainEffeX. We are not suggesting that grade point average is the same as IQ or fluid intelligence, but by exploring phenotypes that you expect to have similar effect sizes as your phenotype of interest, you may obtain refined estimates of effect size for study design. This process is akin to the more common method of obtaining effect size estimates by searching the literature for studies that are similar enough to inform study design.
-
Explore the expected effect sizes of the studies that match the provided filters. Inspect the simultaneous confidence interval plots to note whether there are any edges/voxels with effect sizes that may not be zero. If so, visualize the location of the edges with larger effect sizes with the effect size matrix, and/or the voxels with larger effect sizes on the brain images. If you are interested in a particular region or network, you can download the effect maps with the “Download data” button and then apply a mask to isolate the effect sizes to these regions.
-
Decide how you want to power your study. For example, you could power your study to detect the maximum conservative effect size (the largest absolute value of the lower bounds of the confidence intervals) or to detect an estimated effect size in a region of interest.
-
Use the chosen estimated effect size in the power calculation. Choose the power (often selected to be 0.8) and alpha (often 0.05). Using the effect size, power level, and alpha, compute the required sample size using a formula specific to your test of interest in a standard power calculation tool (e.g., the pwr R package11).
Example 2: Exploring effect sizes across analytic choices
Motivation
Study design involves many analytic choices. Comparing the expected effect sizes across different design choices may help optimize the statistical power of a given study. For example, you may be interested in exploring the differences in expected effect sizes from within-subject and between-subject designs, functional connectivity and activation analyses, or across different tasks and phenotypes.
Step-by-Step
-
Filter the available studies by the parameters that you would like to keep fixed. For example, you could select brain-behavior correlation as the test type, and rest as the task.
-
Vary the parameters that you would like to compare and visualize the results. For example, you could compare the effect sizes that are obtained from using fluid intelligence vs. processing speed as cognitive measures. At this point, it may be helpful to group the studies by statistical test or phenotype category, depending on your question. Grouping by phenotype category, for example, would allow you to compare expected effect sizes for brain-behavior correlations with biometric or cognitive measures. It may also be helpful to visualize the spatial distribution of effects from different parameter selections. However, users are encouraged to be cautious when making inferences from visual inspection alone.
-
Explore meta-analysis results across different test types and categories. The meta-analysis tab of BrainEffeX contains results from meta-analyses that may provide insight into the influences of different experimental design choices on effect sizes.
Section 2. Current datasets
A brief overview of included data as of August 2025
Currently, BrainEffeX includes 58 studies from five datasets: the Adolescent Brain Cognitive Development study (ABCD), the Human Connectome Project (HCP), the Philadelphia Neurodevelopmental Cohort (PNC), the Healthy Brain Network (HBN), the Southwest University Longitudinal Imaging Multimodal Brain Data Repository (SLIM), and the UK Biobank (UKB).12–16 Details about these datasets and currently available studies are available in Supplementary Table 2. These studies were selected in consultation with current contributors to provide balanced coverage of as many typical studies as possible in the field in a controlled contribution setting. We also conducted meta-analyses of the effect sizes across test categories (age, biometric, psychiatric, cognitive, cognitive task, sex).

A brief overview of the preprocessing and first-level analysis used for each study is provided in the Supplementary Methods. More detailed information regarding processing and analysis for each study included as of April 2025 will be presented in Noble et al. (manuscript in preparation), which will also provide more information about the effect size estimation, statistical methods, and interpretation of results.
Ethical Considerations
All data were obtained from publicly available datasets, which received IRB approval at the corresponding data collection sites. We only request sharing subject-level statistical maps for data contributions, which are generally considered to be de-identified. Contributors must not provide a set of predictors that are considered to be identifiable in combination, as per standard data sharing regulations.
Section 3. For contributors: Data structure and sharing
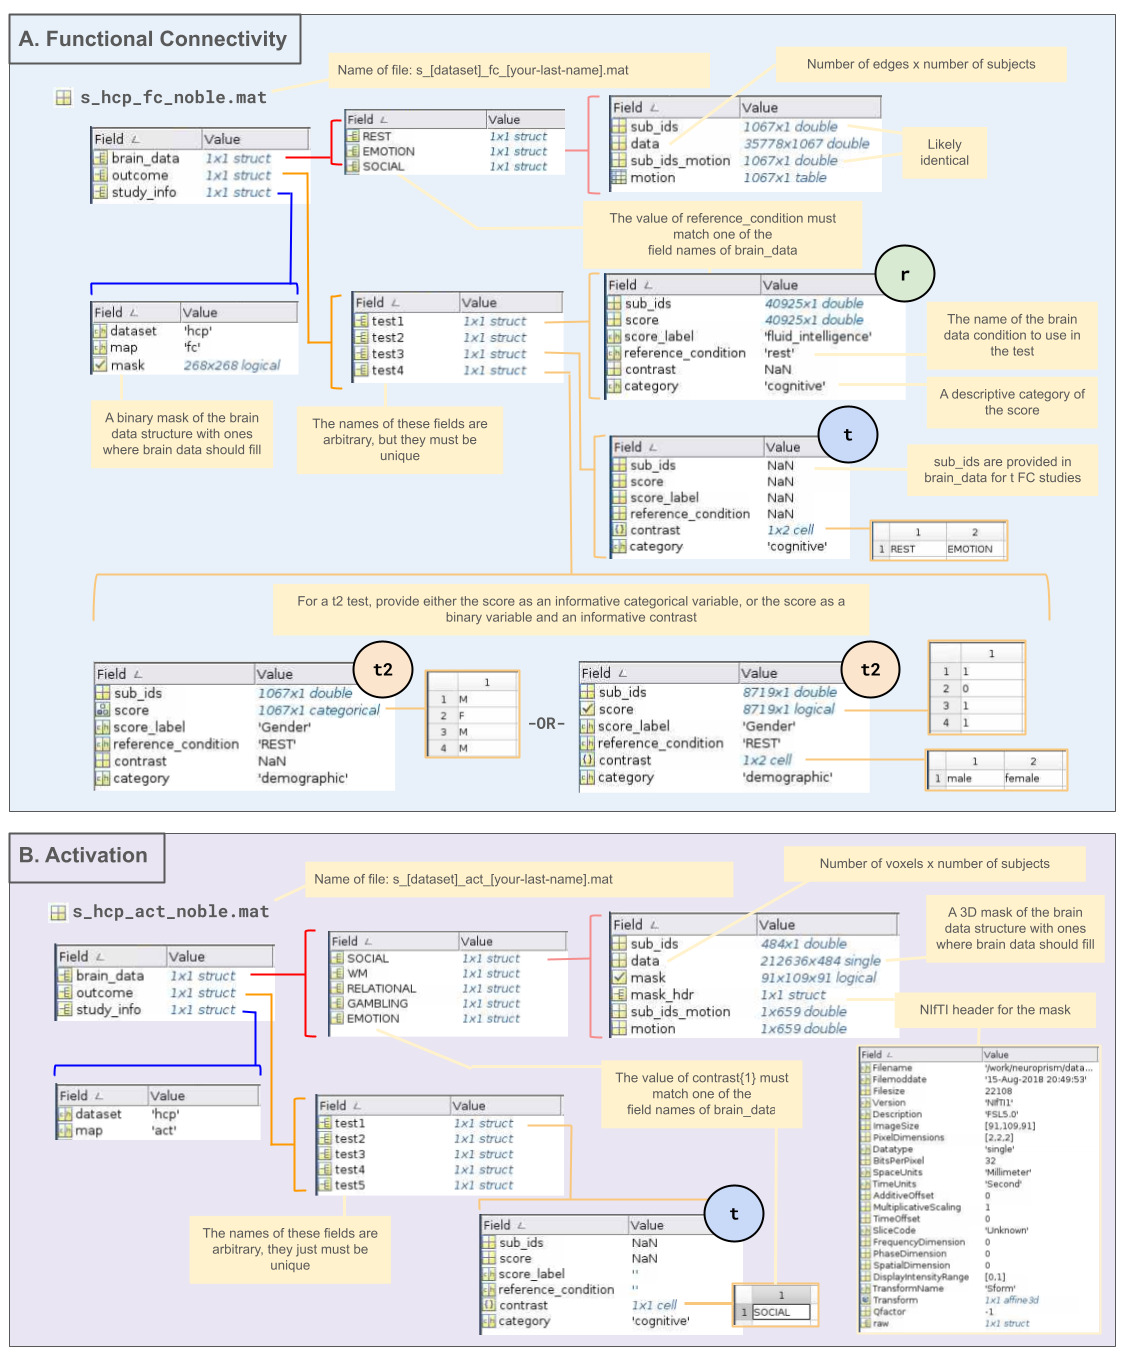
To support BrainEffeX as a growing resource, we welcome contributions of large publicly available fMRI datasets (n > 400). The minimum sample size of 400 subjects was chosen to reflect a balance between large sample size recommendations2 and feasibility. Data should be provided at the subject level, after preprocessing and computation of functional connectivity and/or task-based activation statistical maps. Specifically, a .mat file containing three structs should be provided, with fields listed in Figure 3. Note that for contributors who do not have access to MATLAB or prefer other languages, .mat files can be prepared with Scipy17 for Python or R.Matlab18 for R. Template .mat files with the proper structure for each test type may be downloaded from https://github.com/neuroprismlab/BrainEffeX/tree/main/for_contributors/templates to facilitate the organization of the data files. All fields are required, except where explicitly noted (i.e., allowing NaN). See https://github.com/neuroprismlab/BrainEffeX/tree/main/for_contributors/README.md for more details on formatting dataset contributions. If contributors do not have familiarity with, or access to, MATLAB, they should submit an issue on GitHub or contact the authors by email for assistance.

Once the data is properly formatted, please follow the instructions at https://github.com/neuroprismlab/BrainEffeX/blob/main/for_contributors/README.md to upload the data to brainlife.io and create an issue on GitHub (neuroprismlab/BrainEffeX). The issue template specifies details required from the contributor, including the collection of preprocessing information from the contributor.
For examples of contributed data, please refer to Section 2. For any questions about data contributions that are not addressed in the present manuscript, please submit an issue on the GitHub repository (neuroprismlab/BrainEffeX). Some elements of the app have been currently built for certain idiosyncratic data types (e.g., Shen atlas19 or UKB component14 matrix visualization), but future development will accommodate additional common use cases.
Section 4. For developers: Architecture and technical details
For the Shiny app, built-in or custom functions were used for all of the aforementioned procedures except as follows. The Shiny R package20 was used to build the app, and neurobase21 and oro.nifti22 R packages were used for manipulation and plotting of NIfTI files. The following packages were utilized for user interface (UI) components: shinythemes,23 shinycssloaders,24 shinyjs,25 shinyBS,26 bslib,27 and DT.28 The gridExtra,29 shinyscreenshot,30 ggplot2,31 reshape32 and fields33 packages were used in the server script. We created an R package called BrainEffeX_utils34 (https://github.com/neuroprismlab/BrainEffeX_utils) containing custom R functions relevant to the app, including functions to recreate the visualizations in the app. Instructions to download the package can be found in the README.md file of the GitHub repository.
Information flow
Our pipeline produces effect size maps from contributor datasets (Figure 4). This section will focus on the implementation of the pipeline. For each section of the pipeline, we have included notebook files that demonstrate how to run the pipeline. We also provide a brief overview of the group-level analysis and effect size estimation in the supplementary methods. More detailed information regarding statistical methods used for effect size estimation and rationale is forthcoming (Noble et al., manuscript in preparation).

The first section of the pipeline, accessible at http://github.com/neuroprismlab/calculate_effeX/tree/main/group_level/, takes subject-level datasets from contributors (see Figure 3 for format) and performs group-level analyses in MATLAB version 9.6.0.35 Since MATLAB is proprietary, this dependency may limit the availability of this section of the pipeline for readers without a license; however, the efficiency of MATLAB was favored for such large datasets and computationally heavy analyses. Future work will focus on facilitating contributions in a more general format. The function do_group_level loops through each dataset, and each test within each dataset, to perform the appropriate test. The type of test to perform (r, t, or t2) is inferred based on the content of the outcome variable by infer_test_type. The tests are performed by the run_test function for all available combinations of motion accounting, pooling, and dimensionality (univariate or multivariate). For each study, a resulting MATLAB struct file is saved containing the results of each version of the test. Each version contains the test statistic (t-test or correlation), p-values, sample sizes, standard deviations (of both the brain data and the outcome variables), and details of the pooling and motion correction techniques. Thus, do_group_level creates a group-level results file for each study from each dataset. A few custom functions were created for fast statistical analysis, notably the Regression_faster_mass_univ_y function, which was based on the regression_fast toolbox.36
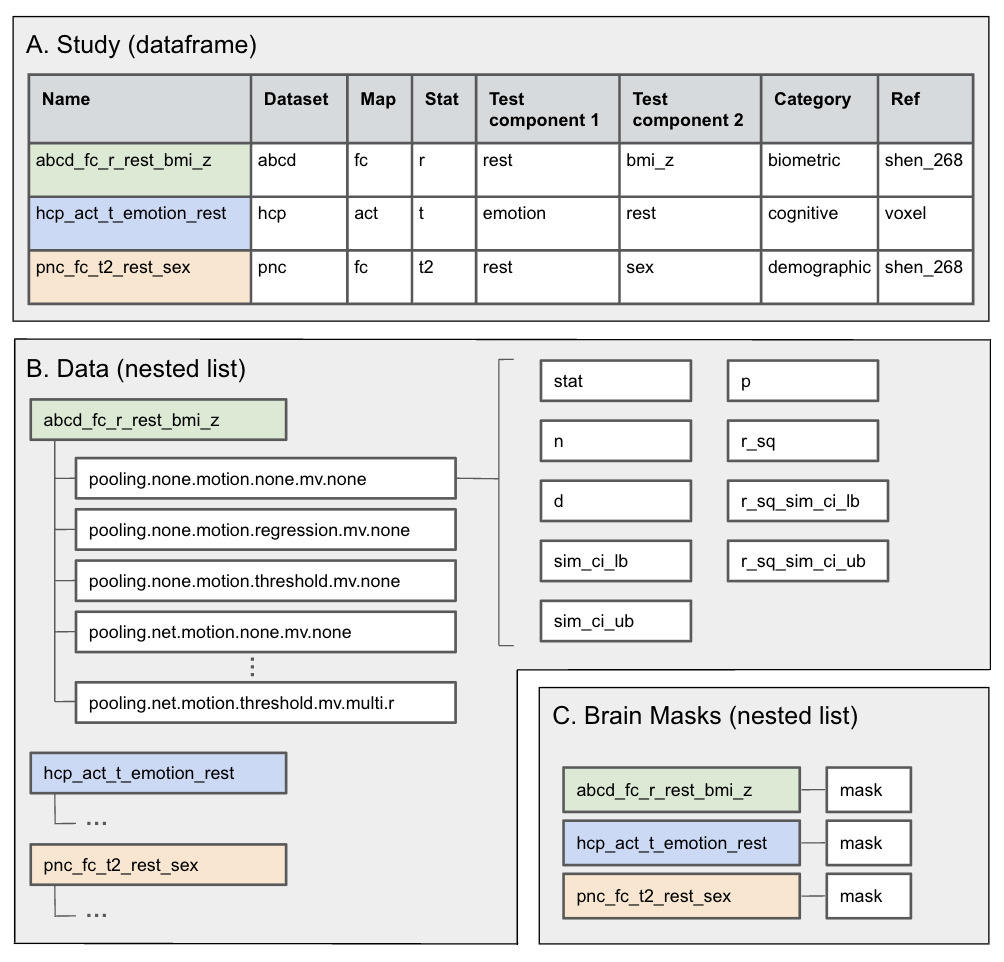
The second section of the pipeline, accessible at http://github.com/neuroprismlab/calculate_effeX/tree/main/effect_size/, takes these group-level study results and produces group-level effect maps and meta-analysis effect maps.37 The function master locates all group-level results and reads them into clean_data to combine the data into a list of statistical maps, a data frame containing study details, and a list of brain masks. This data is then fed into calc_d, which transforms the statistical maps to effect size maps and computes simultaneous confidence intervals for each effect size estimate. Details regarding the effect size conversions are discussed in Noble et al. (manuscript in preparation). The dimensions of the effect maps are checked with checker before computing meta-analyses with the meta_analysis function from BrainEffeX_utils. The final output is saved as an RData file at the end of master. The output file is organized as a list with the following components: a data frame that includes details of each study, a list of brain masks, and a list of effect maps (Figure 5). Meta-analysis results are saved in the same format as a list named meta_category.
Finally, all plots are created by the generate_figures function accessible at http://github.com/neuroprismlab/calculate_effeX/tree/main/create_figures/. Simultaneous confidence interval plots and spatial plots are created for each combination of parameters for each study, which are then loaded into BrainEffeX as necessary to match user selections.
Web app architecture
The BrainEffeX app was built with the R Shiny package.20 This framework facilitates the development of interactive web applications, with a specialized focus on data visualization and exploration.
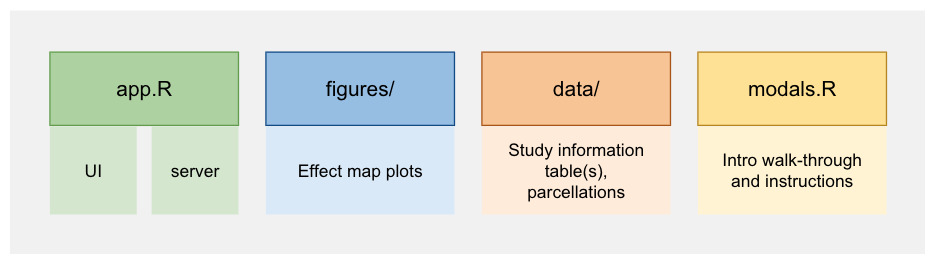
Essentially, the app requires an app.R file, a figures directory, a data directory, and a modals.R file. All code for the app is available at https://github.com/neuroprismlab/BrainEffeX. The app.R file sources a UI file called ui.R and a Server file called server.R. The UI file contains code that describes how the user interface of the app should appear (i.e., the layout of the app, the user inputs that will be available). The Server file contains code that creates the dynamic content that fills the UI components (i.e., filtering the data in response to user input, loading the relevant figures). The figures directory contains all plots for each study with every combination of analysis parameters. Initial versions of the app plotted the effect size data live as the user filtered the studies; however, as the number of studies (the amount of data) grew larger, this approach became prohibitively slow. Therefore, the current version of the app loads pre-plotted figures. Many helper functions created specifically for this project are available as an R package34 at https://github.com/neuroprismlab/BrainEffeX_utils.
User interface (UI)
The UI code creates elements of the app that are filled according to the server code. At the larger scale, the UI creates the overall layout of the app: the header with the name of the app and the link to instructions at the top of the page, the leftmost column of filtering options (Table 1), the middle column of simultaneous confidence interval plots, and the right column of spatial visualizations of effect maps. Finer-grained elements are also defined in the UI code, such as instructions and “Download Data” buttons.
The Shiny framework offers various preset elements that capture user input, such as the selectInput function that creates a drop-down element identified by a variable name (e.g., “dataset”). All user inputs are stored in a list variable called input that updates when user selections are made. For example, when a user selects the ABCD dataset, the value of the input$dataset variable becomes “ABCD”.
Server
The server code describes the way that the UI elements should be filled. Variables in the server code that must be altered in response to changing inputs are called reactive elements. For BrainEffeX, a list of available studies that match the current user inputs is stored as a reactive variable that is updated each time the user changes an input variable. For example, when the user selects a different dataset, the variable is filtered based on the new dataset selection.
This reactive list of matching studies is then used to fetch the figures to plot in the app (stored in the figures directory of the app). All possible figures are generated outside of the app with the generate_plots function and functions from the BrainEffeX_utils package (see Table 2) to improve the speed of the app. Simultaneous confidence interval plots are produced with plot_sim_ci, effect size matrices are produced with plot_mat and activation effect maps are produced with plot_brain. Activation effect maps utilize the create_nifti function, which combines a template NIfTI file (empty NIfTI with header information), the effect map, and the brain mask of the study, to create a NIfTI file for plotting.
A unique plotting step for data using the UKB atlas warrants further explanation. To facilitate spatial interpretation of the UKB ICA component maps, a mapping was estimated from the UKB to the Shen-10 network atlas19 as follows. The UKB spatial component maps14 were scraped from https://www.fmrib.ox.ac.uk/datasets/ukbiobank/group_means/rfMRI_ICA_d100_good_nodes.html. We calculated the similarity between each component and each network by computing the mean scores of each component within each network. In other words, for each component and each network, we averaged the values of the voxels of the component map that are in the network. Each component was ‘matched’ with the network with the highest resulting score. These network assignments were used to sort the 55 ICA components on the axes of the UKB effect size matrices. Within each network, components were sorted by the ratio of the value of the match to the value of the second-best match, representing how close the second most aligned network was for the component.
BrainEffeX_Utils R package
Functions developed for BrainEffeX have been made into an R package called BrainEffeX_utils,34 available at https://github.com/neuroprismlab/BrainEffeX_utils/. This package is used for Shiny plotting and may also be used as a standalone package (e.g., to batch create visualizations). The main plotting function is generate_plots, which utilizes key functions described in Table 2.
Hosting
The app is currently hosted on Shinyapps.io (by Posit), which largely facilitates the deployment of Shiny apps. However, as the number of studies in the app continues to grow, it may outgrow the affordable tiers of Shinyapps.io. In the future, we will migrate the app to a more permanent hosting solution, such as AWS (perhaps through the AWS Public Sector Cloud Credit for Research Program) or Google Cloud.
Limitations and Future Directions
While this tool is the first, to our knowledge, to enable users to interactively explore a wide range of “standard” effect sizes in functional neuroimaging, it is a growing resource that is far from comprehensive. We aim to continue to incorporate new data as they become available, but users may nevertheless struggle to find similar studies to their own planned design - especially when proposing particularly novel paradigms, analyses, or tasks. For these situations, the utility of our app can be more limited if similar phenotypes cannot be found in our available studies. Researchers may need to rely on traditional methods (e.g., literature reviews, meta-analyses) to obtain estimated effect sizes in these cases. However, given the paucity of existing resources, we believe this is a first step for many researchers for whom the study types in the present app are applicable.
Further limitations stem from the fact that the data in BrainEffeX is provided by contributors after preprocessing. Therefore, data are limited by the contributor’s preprocessing choices (e.g., parcellations, nuisance regression approach). While adapting a wider range of possible preprocessing choices would be optimal, it is overly demanding to request contributors to run their preprocessing in multiple ways. However, users may utilize the Network Correspondence Toolbox38 or CAROT39 to compare effect maps from BrainEffeX across different parcellations.
Additionally, each dataset may contain specific issues that may limit the generalizability of the findings. For example, the ABCD dataset has known scanner harmonization errors between vendors,40,41 model specification and timing inaccuracies in certain event files,42 and possible fieldmap errors.43,44 In HCP, the default task modeling strategies may produce construct contamination or differ substantially from typical approaches in the literature, particularly for tasks like the gambling paradigm.45 These represent only several known issues in the datasets that may bias effect size estimation in either direction, and there are likely a number of undocumented issues as well in these and other datasets (e.g., assessment strategies and limitations, acquisition issues, etc.). Overall, we strongly encourage users to consider limitations to the generalizability of these findings when interpreting their results. With that in mind, we still believe the results presented here represent a valuable starting place in benchmarking effect sizes in functional neuroimaging. They are expected to represent the best available estimates by using some of the largest and most comprehensive datasets currently available, and we anticipate effect estimates to be revised over time to become increasingly accurate.
It is also important to note that this tool does not fully address the immense need for an empirical power calculator tool for fMRI. BrainEffeX can provide estimates that may be utilized for power calculations, which serves as a necessary first step in developing an empirical fMRI power calculator.
To grow this resource, we will incorporate more data as they become available. This will enable sophisticated meta-analyses to provide insight into fMRI effect sizes beyond those that are provided by any individual study. In addition to datasets, future directions for this project also include the inclusion of additional metadata (such as cohort age, preprocessing choices, or sample size) for filtering and categorizing data.
Conclusion
In summary, BrainEffeX is an interactive web app that is designed to enable researchers to estimate typical effect sizes for fMRI studies and produce user-relevant summaries of effect size data. The architecture of the app facilitates flexible integration of contributor’s data, allowing this tool to grow and accommodate the evolution of analyses, data, and demands in the field of neuroimaging. Additionally, the open-source nature of this resource allows for community contributions to the functionality of BrainEffeX, while also providing a template and model for similar future endeavors that will undoubtedly emerge as large amounts of neuroimaging data continue to be shared openly. Finally, BrainEffeX will facilitate the ongoing development of an empirical power calculator for fMRI studies that will support more robust and reproducible neuroimaging research.
Author Contributions
HS: Methodology, software, formal analysis, data curation, writing - original draft, visualization; MR: Data curation, writing - Reviewing & Editing; JY: Data curation, writing - Review & Editing; RJ: Data curation, writing - Review & Editing; LT: Data curation; MF: Data curation, writing - Review & Editing; QL: Data curation; JD: Data curation; MLW: Data curation, writing - Review & Editing; IC: Data curation; AF: Writing - Review & Editing; AH: Software; MJR: Pre-processing; CaC: Software; HP: Data curation; BA: Data curation, writing - Review & Editing; SM: Data curation, writing - Review & Editing; CC: Data curation, writing - Review & Editing; TN: Guidance on analysis, Writing - Review & Editing; JC: Guidance on analysis; DS: Supervision; SN: Conceptualization, methodology, software, formal analysis, resources, data curation, writing - original draft, visualization, supervision, funding acquisition.
Data and Code Availability
All raw data used in the present study has been made publicly available by the contributing repositories and can therefore be accessed by following the protocols outlined by each dataset. All code for the app (https://github.com/neuroprismlab/BrainEffeX), the analyses (https://github.com/neuroprismlab/calculate_effeX), and the accompanying R package (https://github.com/neuroprismlab/BrainEffeX_utils), are available on GitHub. The current version (v1.6.1) of BrainEffeX has been archived with Zenodo at the following DOI: 10.5281/zenodo.16915132. The most recent version of BrainEffeX can be accessed long-term with the following concept DOI: 10.5281/zenodo.16882652.
AI Use Statement
All code in this project reflects the original work of the authors, with generative AI (Claude, Anthropic; GitHub Copilot; ChatGPT, OpenAI) used to help with light refactoring, debugging, and test development.
Funding Sources
This work was supported by funding from the National Institute of Mental Health (K99 MH130894; R00 MH130894 to SN).
Conflicts of Interest
The authors declare no conflicts of interest related to this work.