Introduction
Amyotrophic lateral sclerosis (ALS) is a fatal progressive motor neuron disease that affects both cortical and spinal motor neurons. The pathophysiology and origin of ALS are still not fully understood.1,2 Diagnostic delays between symptom onset and diagnosis are prolonged, with few biomarkers available to support early detection. This usually means patients are first diagnosed at widely varying stages of the disease.3 While loss of spinal motor neurons is often evident from clinical evaluation (loss of muscle force and atrophy), upper motor neuron dysfunction is more difficult to quantify clinically, as rating scales often rely on quantification of pathological reflexes. The current consensus criteria for ALS diagnosis (Gold Coast criteria4) allow for verification of lower motor neuron loss by electromyography (EMG) whereas upper motor neuron dysfunction is solely based on clinical evaluation, with only supportive evidence from magnetic resonance imaging (MRI), neurofilament levels and transcranial magnetic stimulation (TMS).
Cortical disinhibition, as measured by paired-pulse TMS, is an early feature of ALS5 and is known to depend in part on intracortical GABAergic activity.6 Cortical disinhibition is not unique to ALS, as it has been reported for numerous other neurodegenerative diseases7 as well as post-stroke.8 TMS techniques for investigating motor cortex excitability measure the size of the elicited motor-evoked potentials and are thus inevitably dependent on the integrity of the entire pathway from cortex to muscle. Consequently, paired-pulse TMS might not be ideal for investigating cortical changes in ALS as the disease affects neurons in both the brain and the spinal cord.
In the present study we use magnetoencephalography (MEG) as an alternative method to investigate cortical brain changes in ALS. MEG is a non-invasive and comfortable method for measuring cortical oscillations with high temporal precision (< 1 ms) and good spatial resolution (< 1 cm).9,10 Neural oscillations occurring in the beta band (14-30 Hz) of the sensorimotor cortex are of particular interest in ALS as the beta band is modulated by movement in a well-known manner with event-related desynchronization (ERD) before the movement followed by event-related synchronization (ERS) after the movement.11,12 Beta power at rest, and modulation with movement, are related to GABA concentrations in the brain.13,14 Thus, beta band activity measured with MEG has potential as a biomarker of upper motor neuron involvement in ALS without direct dependency on the integrity of lower motor neurons, a potential advantage compared to TMS.
Prior studies investigating movement-related beta oscillations in ALS are inconclusive,15 this could in part be due to variation in patient performance as the ability to perform the requested movement deteriorates as lower motor neuron burden and loss of muscle force increases. In line with this, Yoganathan et al. recently reported reduced corticomuscular coupling during movement in ALS, supporting the idea that measures tied to motor output may be sensitive to disease severity and performance.16 In the current study, we combine the active movement task with a passive finger movement, to explore beta modulation in a task independent of voluntary movement.
To our knowledge, no prior studies have investigated the afferent features of the motor system in a passive movement task in ALS. The response to a passive finger movement has been shown to mainly contain proprioceptive information.17 Proprioception is highly important for the execution of motor function, encoding the position of the limbs of the body in its movement range. Passive movement activates sensory areas of the brain18 and modulates beta band activity in motor areas as well.19 Although ALS is regarded as a disease primarily affecting the motor system, we were curious whether cortical beta modulation with passive movement would be abnormal due to the proprioceptive input to M1. As MEG is primarily sensitive to dendritic activity, input to M1 could elucidate pathological processes even in a passive movement task.
We hypothesized that patients with ALS would exhibit altered beta-band cortical modulation during active movements compared to healthy subjects, and that this alteration would appear only during active tasks if ALS selectively affected the pyramidal output cells in M1. Finally, we hypothesized that disease severity would correlate with the modulation of beta power.
By the end of patient enrollment, it was evident that the patient group could be split into two subgroups with respect to disease severity. Half of the patients had moderate to severe paralysis in hand and finger muscles as opposed to the other half in which strength was normal.
Methods
Participants
Eleven ALS patients were recruited from the ALS clinic at the Department of Neurology, Aarhus University Hospital, Denmark. All patients were diagnosed according to the latest revision of the El Escorial Criteria at the time.20,21 The healthy age- and gender-matched controls were excluded if they had a prior history of psychiatric disorder, neurological disease, or any limitation in hand or arm movement. All participants were given written and oral information before providing written informed consent. The study was approved by the Scientific Ethics Committee of Region Midtjylland, Denmark (ID number: 65059).
Thirteen healthy controls (HC) were recruited through an ad in the local newspaper and additionally from non-bloodline family and friends of the recruited patients. One healthy subject was excluded due to a history of multiple minor strokes, leaving 12 subjects in the HC group.
Patients: Clinical examination
Disease severity was evaluated by a neurological examination as well as a rating of function using the revised ALS Functional Rating Score22 (ALSFRS-R, range 0–48, lower scores indicate greater disability). Upper motor neuron (UMN) burden was evaluated using the Penn Upper Motor Neuron Score23 (PUMNS, 0-32 points, higher scores indicate greater UMN burden). In all patients, muscle strength was assessed across 36 muscles and rated according to the Medical Research Council scale24 (MRC, 0-5).
The clinical and functional data were collected within two weeks of the MEG session. The same medical doctor (author TSS), under supervision of an ALS expert neurologist (co-author JB), performed all clinical assessments.
Task design
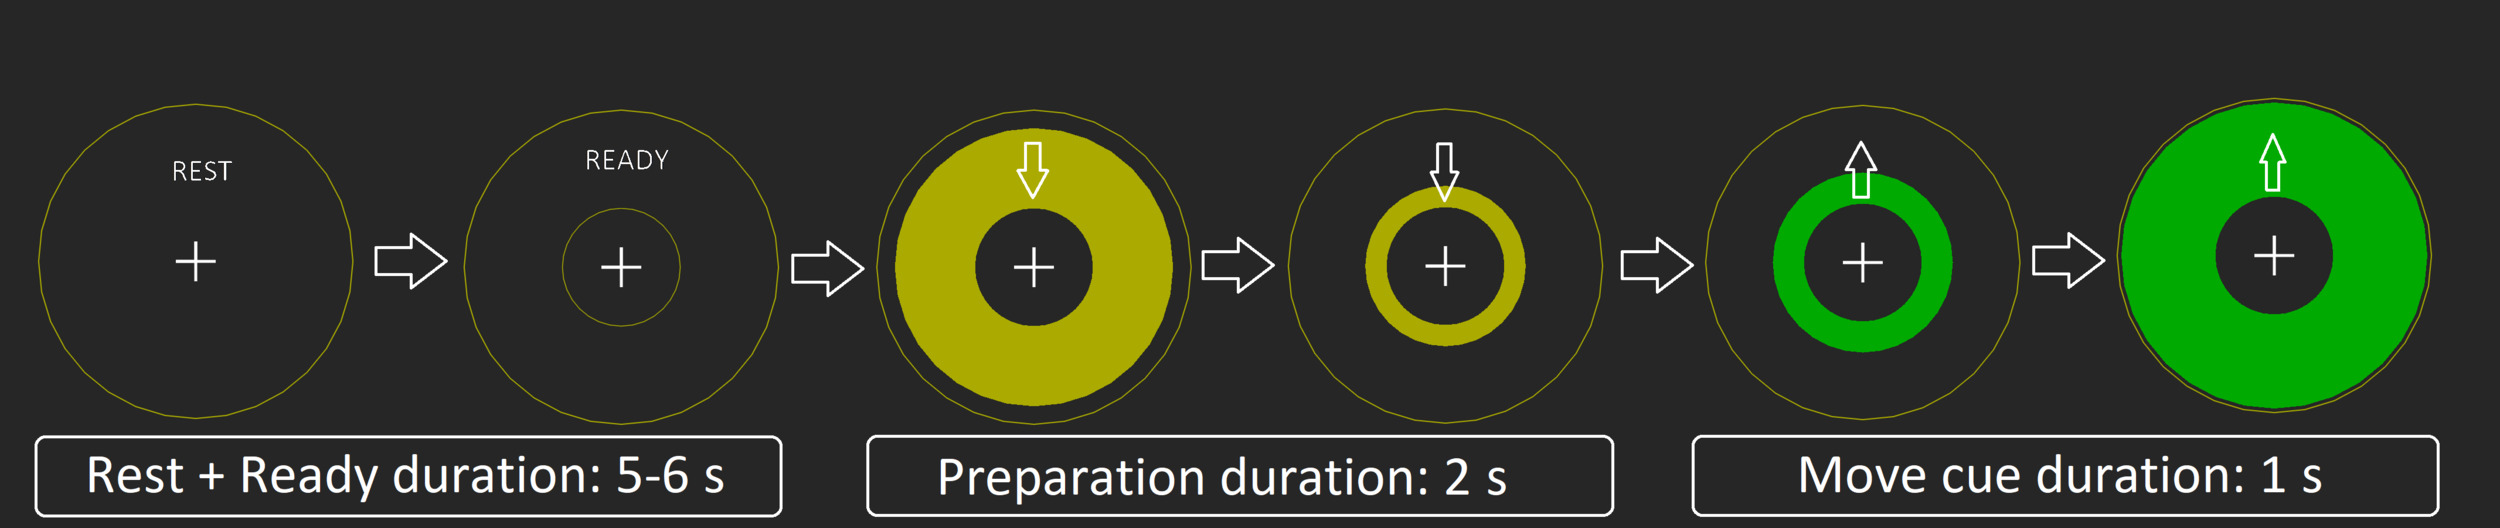
To elicit reliable ERD/ERS responses in both active and passive tasks, we used a simple visual paradigm: Rest (including ready) (5-6 s), preparation (yellow circle) = (2 s), action/move cue (green circle)(1 s), and back to rest, (see Figure 1). The visual stimuli were back projected using a PROPixx projector (VPixx Technologies, Saint-Bruno, Canada) onto a screen approximately 1 m in front of the subject. Recordings took place in a dimly lit, three-layer, magnetically shielded room (Vacuumschmelze GmbH & Co. KG, Hanau, Germany).

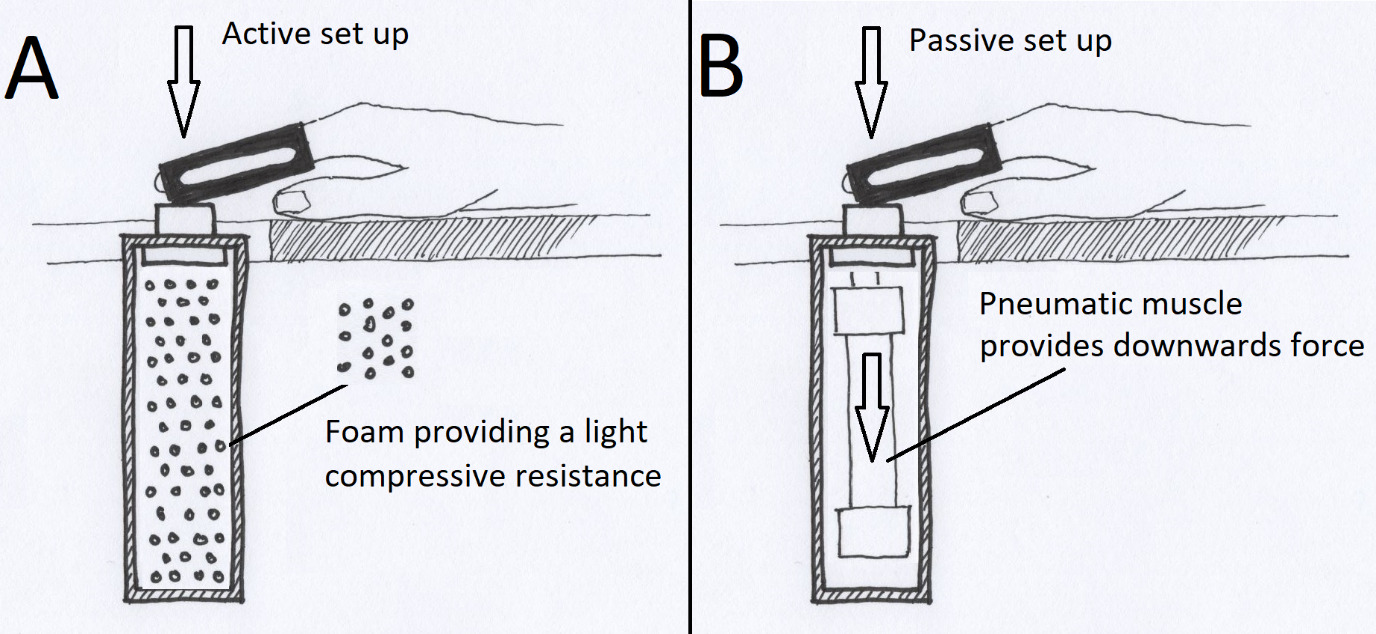
In the active condition, subjects were instructed to push a button against light resistant foam (Figure 2a), using their right index finger. A total of 100 movements were performed in five blocks of 20 button presses separated by four 30 second rest blocks. All subjects were instructed to time the press of the button to the intersection of the yellow moving circle and the inner stationary circle (Figure 1). Participants were told to press the button in a firm and decisive manner, “like a firm handshake”. If the patient had little or no finger movement, they were still given the same instructions, even if the attempt to move produced no actual movement.
The passive condition involved an identical setup and visual cue. A pneumatic muscle (Fluidic Muscle DMSP, Festo, Germany) pulled the subject’s index finger to mimic the movement of the active condition (5x20 pulls, 4x30s breaks) (Figure 2b). Subjects were instructed to keep attending the visual paradigm but relax their finger.
The passive setup was based on Piitulainen et al.25 Participants were seated in an MEG-compatible chair and rested their arms on a side table (similar to an armchair position). The pneumatic controls were provided by a pneumatic artificial muscle stimulator (Aalto NeuroImaging, Aalto University, Espoo, Finland).25 The active/passive button was mounted slightly above the table surface to place a slight extension on the subject’s index finger used for the experiment (see Figure 2).
In both conditions, the subject’s finger was placed in a hard plastic sheet to hinder the movement of the distal joints and thus restrict the movement to the metacarpophalangeal (MCP) joint.
Both active and passive devices had the same restricted range of motion of ~2cm vertical movement.
_active_task_setup._(b)_passive_task_setup__the_pneumatic_muscle_was_connected_to_a_con.png)
MEG acquisition
All subjects were scanned using a 306-channel TRIUX MEG system (Megin Oy, Finland). Simultaneous bipolar recordings of EMG from flexor digitorum profundus and extensor indicis as well as right eye vertical electro-oculogram, using disposable gel-filled electrodes (Neuroline 720; Ambu A/S, Denmark) were collected during the scan. Prior to the MEG recording, subjects had their head shape digitized using the Polhemus FASTRAK (Vermont, USA) system and 4 head position indicator coils were placed on the head to track movement. An accelerometer (ACC) (ADXL335, Analog Devices, Inc., USA) was mounted on the fingertip of the right index finger to record movement. The accelerometer is a non-magnetic sensor that uses low-amplitude voltage and phase differences to determine acceleration beyond a defined baseline. The control/measurement unit is positioned outside the magnetically shielded room and relays analog signals to additional MEG analog channels. Its use in MEG experiments is well documented26–28 and the device is MEG-compatible. The MEG data were recorded at a 1000 Hz sampling rate with online 0.1 Hz high-pass and 330 Hz low-pass filters.
Patient stratification
As the task primarily involved dominant-hand strength, clinical severity grading was based on the clinical evaluation of muscle force in the right hand, using the MRC scale. Five muscle groups were evaluated — finger flexion, finger extension, first dorsal interosseous, abductor digiti minimi, and abductor pollicis brevis — yielding a combined hand-strength score ranging from 0 to 25. Of the 11 patients, six had normal right-hand strength (“Unaffected-ALS”), whereas five had significant weakness (average total strength score of 12.2 MRC, range 8–16) and were categorized as “Affected-ALS”. The analysis addressing correlation with hand muscle impairment was based on these subgroups.
Data and statistical analysis
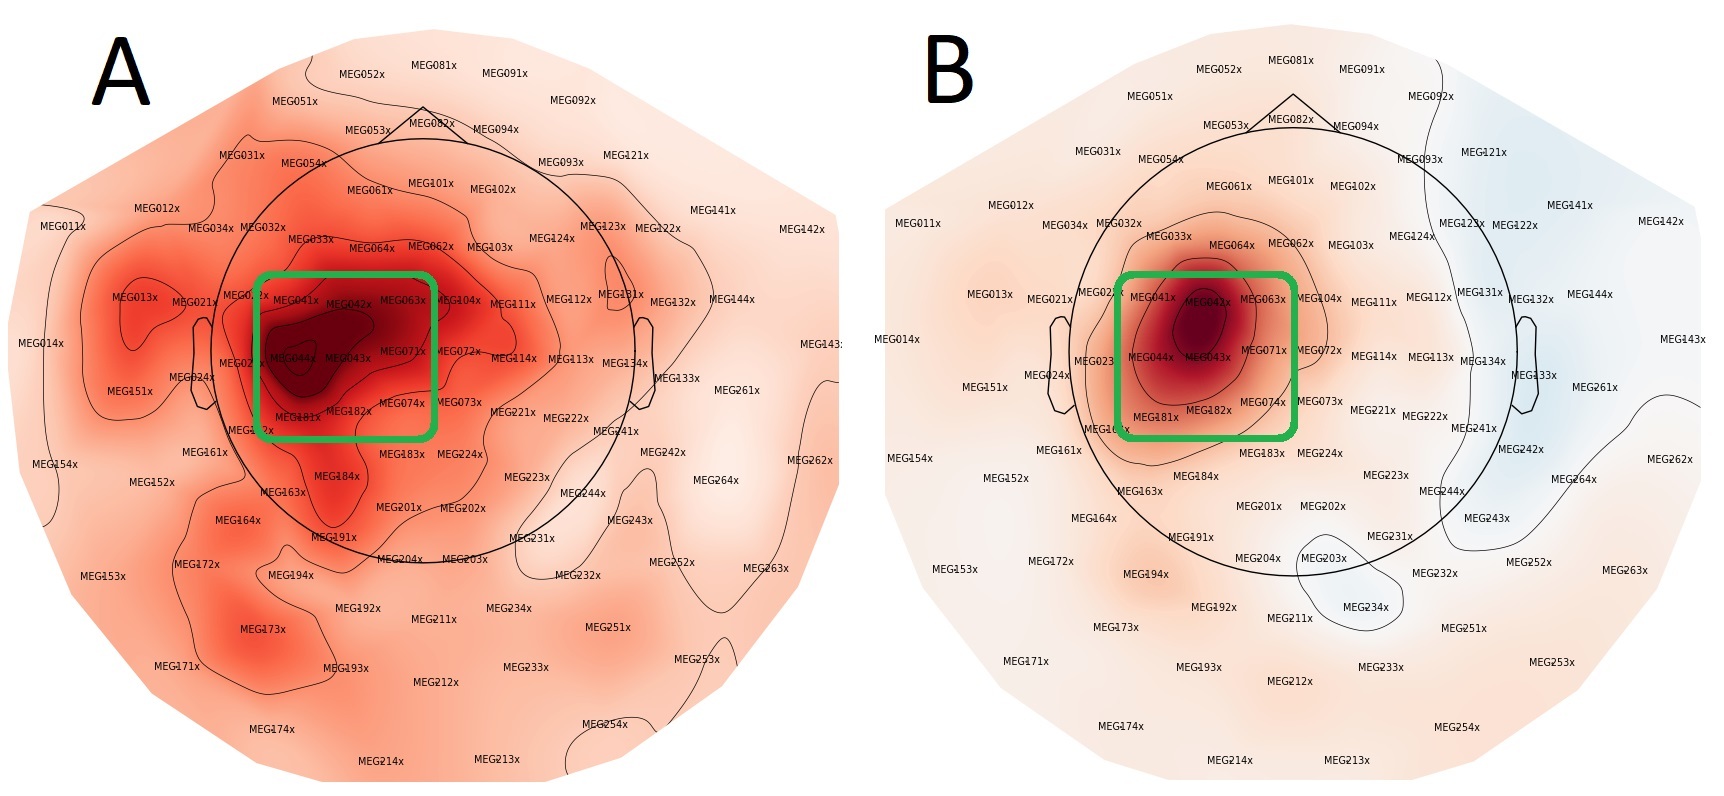
Head movement correction and noise suppression were performed using MaxFilter (Version v2.2.15; Elekta Oy, Helsinki, Finland), followed by processing in MNE-Python v0.23.429 in Python v 3.9.5. Nine gradiometer pairs (3×3 array) over the sensorimotor cortex of each hemisphere were selected (Figure 3). Any remaining ocular and cardiac artifacts were removed via automated MNE-Python functions “.find_bads_ecg” and “.find_bads_eog” based on independent components analysis (ICA) after visual confirmation. The MaxFiltered and ICA cleaned data were then epoched using MNE-Python.

For the active movement condition, movement onset was manually identified from the accelerometer trace and used as the trigger to align epochs and reduce reaction-time related variability. For the passive movement condition, the trigger that activated the pneumatic muscle was also used to align epochs.
The time-window of interest was set to -4 s to 5 s relative to the trigger for both conditions. Further processing included rejecting epochs with gradiometer peak-to-peak amplitudes >300 pT/m. This resulted in few epochs being rejected, typically less than 4%. Before time–frequency analysis, epochs were mean-centered per epoch and channel using MNE’s baseline setting baseline=(None, None) (i.e., subtracting the mean over the full epoch to remove DC offsets/slow drifts). This mean-centering is separate from the Rest-referenced baseline correction used to compute ΔZ (described below). The surviving epochs were then used to compute time-frequency representations (TFR) from 3-120 Hz using discrete prolate spheroidal sequences (DPSS) tapers.
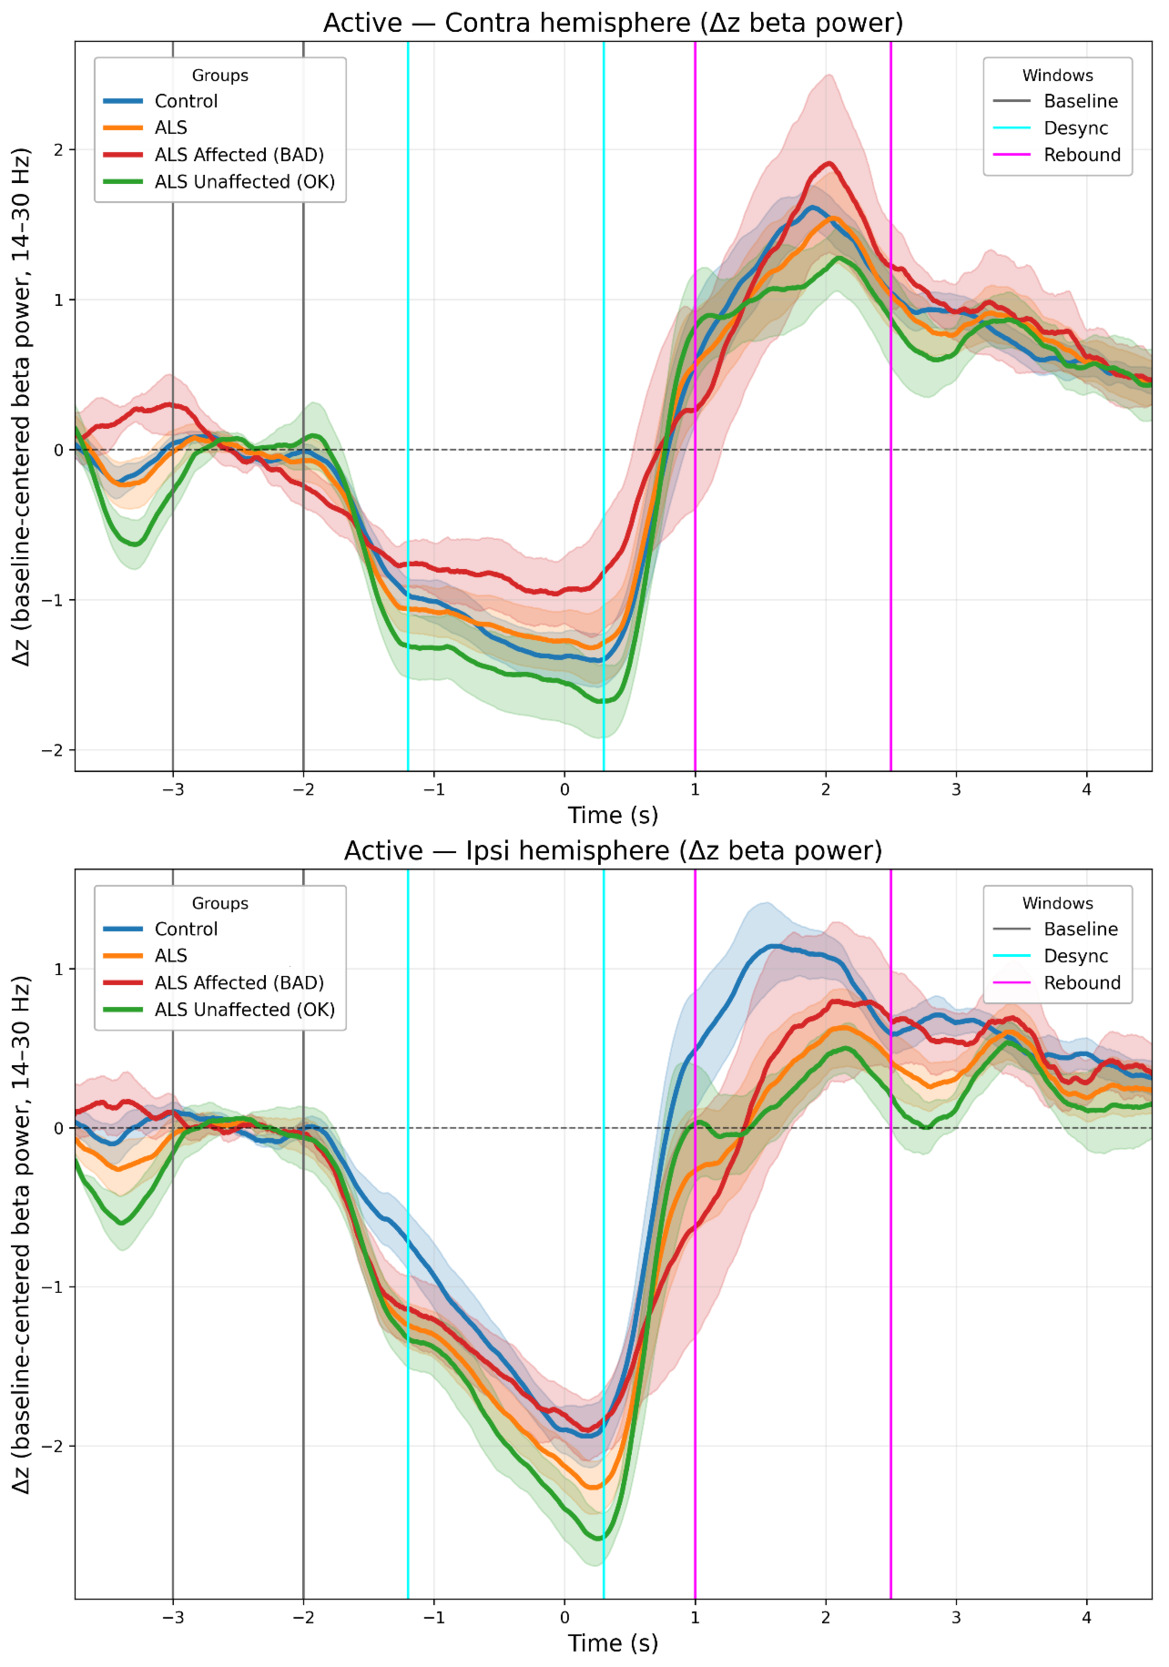
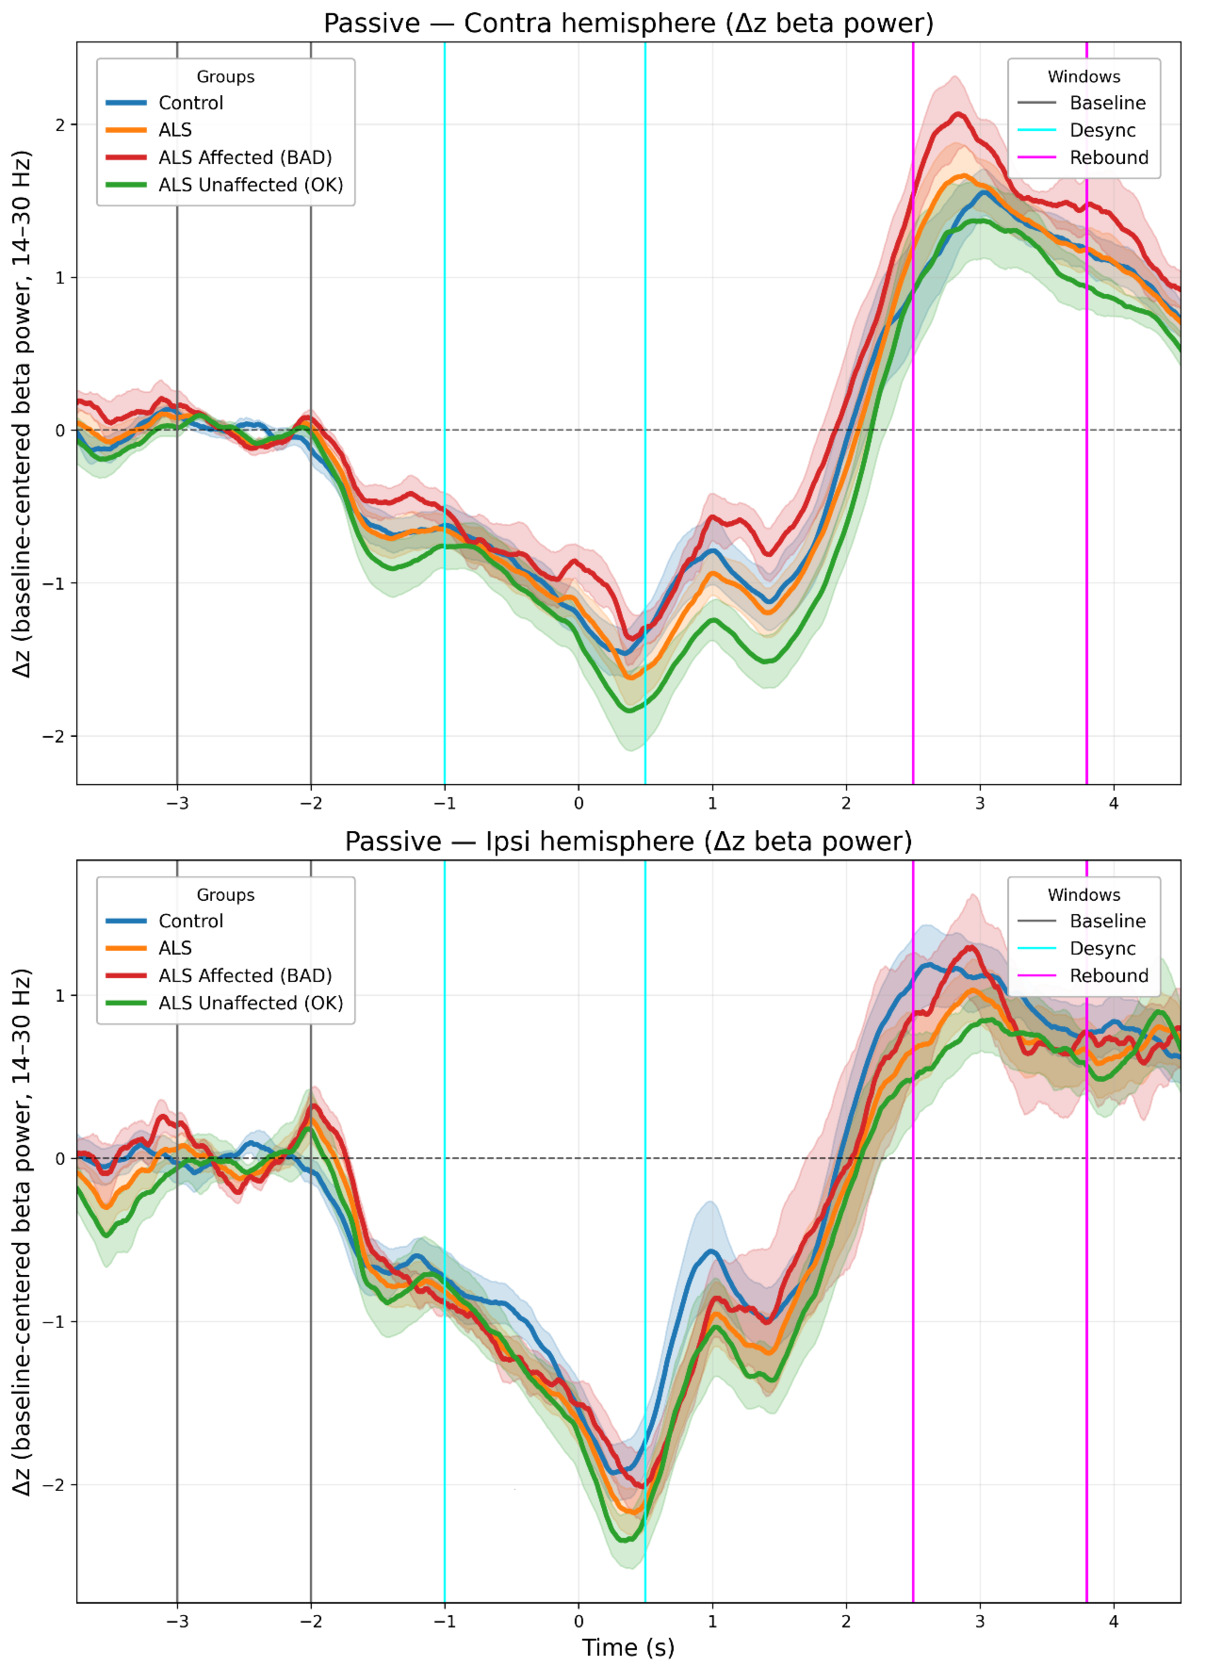
Three time-windows were selected to capture Rest, desynchronization (ERD), and rebound (ERS) respectively. Slightly different windows were used to capture peak ERD/ERS for the active condition (ERD: −1.2 to 0.3 s; ERS: 1.0 to 2.5 s) and passive condition (ERD: −1.0 to 0.5 s; ERS: 2.5 to 3.8 s). The “rest window” was identical in both conditions (-3.0 s to -2.0 s) (see Figures 4 and 5).
Within each subject, after selecting the contralateral/ipsilateral sensor set and averaging beta (14–30 Hz) power across sensors and frequencies, the resulting beta-power time course was standardized (z-scored) across the full analysis epoch (slightly cropped to avoid edge artifacts: −3.8 to 4.8 s), separately for condition (active/passive) and laterality. Window means (Rest, ERD, ERS) were then computed on these standardized time courses, and Rest-referenced (baseline-corrected) beta modulation was defined as ΔZ = z(window) − z(Rest), where ‘window’ denotes the ERD or ERS time window. This Rest-referenced ΔZ metric is distinct from the per-epoch mean-centering step described above. In the remainder of the manuscript, we refer to ΔZ as “baseline-corrected beta modulation” and to absolute beta power (without Rest referencing) as “baseline-uncorrected beta”.
We used a standardization pipeline similar to previous studies involving movement-related beta modulation from our group30 and others (e.g.,31). Baseline-corrected beta modulation (ΔZ) was computed for each subject for every combination of condition (active/passive), laterality (contralateral/ipsilateral), and window (ERD/ERS), yielding eight values per subject. Data were imported to R32 for further statistical analysis. In R we set up two factorial models using the analysis of variance (ANOVA). The significance threshold was α = 0.05.
The 4-way ANOVA model for the group level (ALS / HC):
The 4- way ANOVA model for stratification of patients based on hand muscle strength:
Shapiro–Wilk tests on the model residuals did not indicate meaningful departures from normality (Group model: W = 0.994, p = 0.639; Sub-type model: W = 0.989, p = 0.182). Visual inspection of QQ-plots (Supplementary Figure 3) revealed only mild deviations.
Levene’s test confirmed homogeneity of variance (Group: F = 1.105, p = 0.356; Type: F = 1.027, p = 0.435).
To further explore group and subtype differences at each time point (ERD and ERS), we performed post hoc analyses using one-way ANOVA models separately for each time window. For each time-specific model, Tukey’s Honest Significant Difference (Tukey HSD) test was applied to assess pairwise differences between groups (ALS vs HC) and types (HC, ALS-Unaffected, ALS-Affected). These analyses were only conducted when more than one level was present for the grouping variable. The baseline window was excluded because ΔZ is defined relative to the Rest window (i.e., Rest serves as the reference).
Baseline differences were assessed using Welch two-sample t-tests on (i) beta power without baseline correction and (ii) baseline z-scores (standardized baseline levels).
Because baseline beta power differed between subtypes a one-way ANOVA and Tukey’s HSD for baseline-uncorrected beta was run on the absolute mean beta power (without z-baseline standardization) of the ERD and ERS time windows.
For the three-level subtype comparison at baseline (HC, ALS-Unaffected, ALS-Affected), we additionally performed a one-way ANOVA on z-scores followed by pairwise Welch t-tests with Holm correction.
Additionally, within the ALS cohort, Pearson correlations related contralateral baseline-corrected beta modulation (ERD/ERS referenced to Rest, in standardized units) to clinical scores (ALSFRS-R and PUMNS), separately for ERD and ERS and for active and passive conditions. We report ρ with 95% CIs and p-values; p-values were Holm-adjusted within each Measure: Condition family (ERD, ERS). One ALS participant without a complete ALSFRS-R score was excluded from ALSFRS-R correlations.
Results
Group level
The four-way ANOVA (Time Window - Group - Condition - Laterality) on baseline-corrected beta modulation (ΔZ; ERD/ERS referenced to Rest, in standardized units) reproduced our expected main effects of Time Window (ERD - ERS; F = 706.03, p < 0.001), Laterality (hemisphere to the movement) (contralateral - ipsilateral; F = 24.58, p < 0.001) and Condition (active - passive; F = 5.66, p = 0.018).
The Group main effect did not reach significance (ALS vs HC; F = 3.47, p = 0.064), and no Time Window × Group interaction was observed (F = 0.26, p = 0.610).
Post-hoc Tukey’s HSD tests showed no ALS–HC difference at ERD (Diff=0.016, 95% CI [-0.049-0.081], p = 0.63) and no difference at ERS in ALS (Diff=-0.101, 95% CI [-0.207-0.006], p = 0.064).
Type level
When patients were stratified by right-hand strength, the subtype four-way ANOVA model (HC - ALS(Affected) - ALS(Unaffected)) yielded a significant Type (HC vs ALS(Unaffected) vs ALS(Affected)) main effect (F = 4.84, p = 0.009) and no Time Window - Type interaction (F = 0.18, p = 0.836). This model confirmed the prior results with significant main effects of Condition (active or passive) (F = 5.65, p = 0.019) and Laterality (ipsilateral or contralateral hemisphere) (F = 24.55, p < 0.001). (See Table 2 for details).
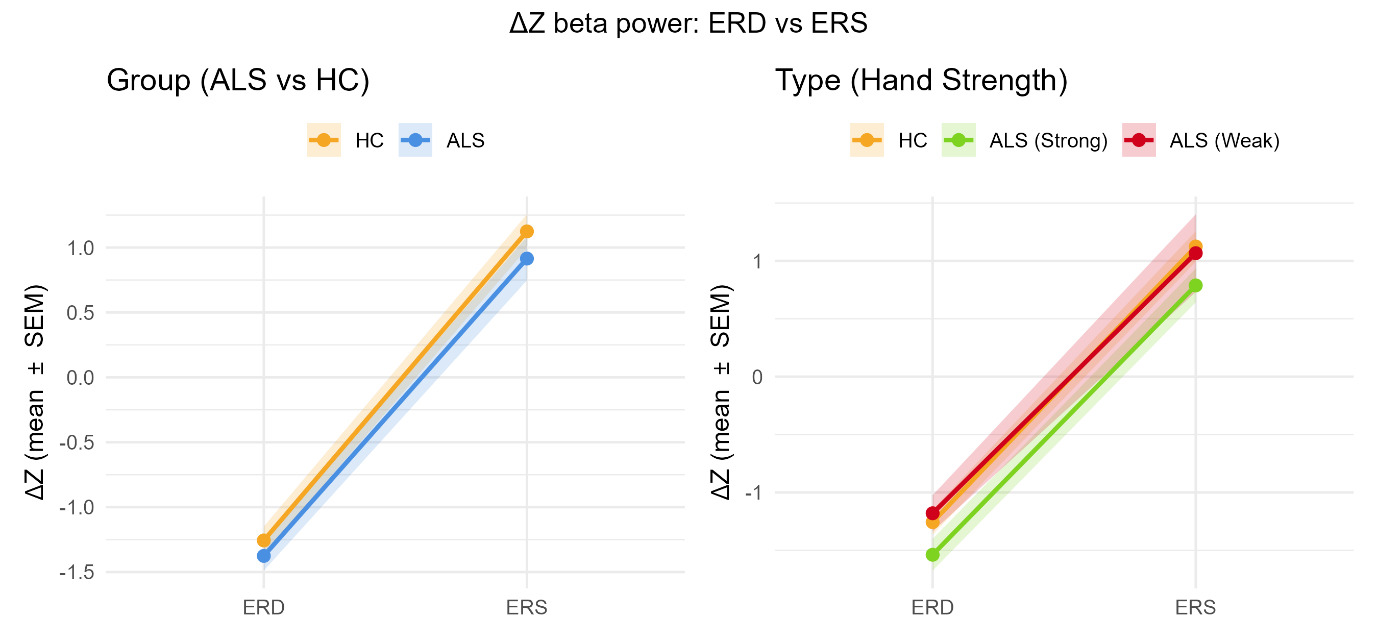
See Figure 4 (active) and Figure 5 (passive) for grand-mean ΔZ time-courses, Figure 6 summarizes window means (ERD/ERS) for the Group and Type models.
Tukey’s HSD contrasts at the ERD window showed that the ALS-Affected subgroup suppressed beta significantly less than ALS-Unaffected (Diff = 0.358, 95% CI [0.004, 0.713], p = 0.047). The ALS-Unaffected vs HC contrast showed a trend (Diff = −0.282, 95% CI [−0.574, 0.010], p = 0.061), while ALS-Affected vs HC was not significant (Diff = 0.077, 95% CI [−0.235, 0.388], p = 0.828) (See Table 3). No subtype differences reached significance during the ERS window (all p > 0.176), and the Time - Subtype - Condition three-way interaction was non-significant (F = 0.72, p = 0.488).
Thus, movement-related modulation of beta power differs across subtypes, driven by shallower ERD in ALS-Affected, and this pattern appears independent of movement condition.
Resting/Baseline observations
Raw baseline beta power did not differ between the overall ALS and HC groups (HC: 5.55 ± 2.75 × 10⁻²² (T m-1)2 Hz-1; ALS: 5.58 ± 4.04 × 10⁻²² (T m-1)2 Hz-1; p = 0.97). Within subtypes, baseline means were 7.36 ± 4.42 × 10⁻²² (T m-1)2 Hz-1 for ALS-Unaffected and 3.44 ± 2.11 × 10⁻²² (T m-1)2 Hz-1 for ALS-Affected.
Across subtypes, a one-way ANOVA showed a significant effect (F(2,89)=8.37, p<0.001). Holm-adjusted pairwise Welch tests indicated ALS-Affected < HC (p=0.0027) and ALS-Affected < ALS-Unaffected (p=0.0015), whereas ALS-Unaffected vs HC was not significant after adjustment (p=0.076); see Supplementary Table 4).
Baseline z-scores. Mean baseline z-scores did not differ between ALS and HC (HC: 0.044 ± 0.317; ALS: 0.160 ± 0.414; Welch’s t(80.36) = −1.50, p = 0.137). Across subtypes, a one-way ANOVA indicated a significant effect of Type on baseline z-scores (HC: 0.044 ± 0.317; ALS-Unaffected: 0.281 ± 0.347; ALS-Affected: 0.015 ± 0.449; F(2, 89) = 4.24, p = 0.017). Holm-adjusted pairwise tests showed ALS-Unaffected > HC (p = 0.022), insignificant ALS-Unaffected > ALS-Affected (p = 0.075) and ALS-Affected vs HC not significant (p = 0.799). Because the primary metric baseline-corrected beta modulation (ΔZ) is computed as a within-subject difference, these baseline offsets do not account for the effects reported above.
Post hoc testing: Baseline-uncorrected beta (ERD/ERS windows)
Because baseline beta power differed across subtypes, we additionally ran one-way ANOVAs and Tukey’s HSD on raw beta power in the ERD and ERS windows to assess whether baseline-corrected effects might reflect simple scaling by baseline. Both ERD (DF = 2, Residuals = 89; F = 3.78, p = 0.027) and ERS (DF = 2, Residuals = 89; F = 6.10, p = 0.003) showed significant subtype differences. Tukey HSD indicated that ALS-Affected had lower raw beta power than ALS-Unaffected in both ERD (p = 0.021) and ERS (p = 0.002), and lower ERS than HC (p = 0.035). Other pairwise contrasts were not significant (ERD: ALS-Affected vs HC p = 0.124; ALS-Unaffected vs HC p = 0.457; ERS: ALS-Unaffected vs HC p = 0.294).
_in_the_active_condition_for_the_contralater.png)
_in_the_passive_condition_for_the_contralate.png)
_and_rebound_(ers)._left_.png)
Movement verification between groups
Accelerometry data from the tip of the moved finger was further investigated to verify movement and acceleration agreement between groups, see Supplementary Figure 2 for active movement accelerometer plots.
The accelerometer data confirmed two key points. First, the overall movement pattern was very similar across all groups. Second, in the active sessions, the two ALS subgroups differed, but patients with no hand-muscle impairment showed no difference from healthy controls.
When comparing the groups in the acceleration peak period (0.05s - 0.25s), a t-test with Holm adjustment across the four planned comparisons showed no significant difference in average amplitude for the overall ALS group vs HC (p (Holm) = 0.224) or for ALS (unaffected hand) vs HC (p (Holm) = 0.387). However, ALS (affected hand) exhibited a significantly lower amplitude than HC (p (Holm) = 0.027), and the difference between ALS (affected hand) and ALS (unaffected hand) was also significant (p (Holm) = 0.024), again lower acceleration amplitude for affected ALS subjects.
Correlation with clinical measures
Within ALS, no correlations survived Holm adjustment between contralateral baseline-corrected beta modulation and ALSFRS-R (function) or PUMNS (UMN burden) in either ERD or ERS, for active or passive movement (Supplementary Table 3; Supplementary Figure 1). For ALSFRS-R, effects were small-to-moderate and non-significant (e.g., Active/ERS: ρ = −0.41, 95% CI [−0.83–0.29], p = 0.234; Passive/ERD: ρ = −0.59, 95% CI [−0.89–0.06], p = 0.072; Passive/ERS: ρ = −0.70, 95% CI [−0.92–0.12], p = 0.025, Holm-adjusted p = 0.051). For PUMNS, all correlations were small and non-significant after adjustment (e.g., Active/ERD: ρ = −0.31, 95% CI [−0.77–0.36], p = 0.359; Passive/ERS: ρ = 0.35, 95% CI [−0.32–0.78], p = 0.295; adjusted ps ≥ 0.59).
Discussion
In this study, we investigated the modulation of cortical beta power during active and passive movement tasks using MEG. The experiments elicit cortical, movement-related changes in line with previous studies: beta power modulation differs between active and passive movement tasks33 and between the ipsilateral and contralateral hemisphere relative to the hand movement.34–36 The general appearance of the beta modulation is also as expected.12,37 (See Figures 4–6 for representative time-courses and window means).
Using baseline-corrected beta modulation (ERD/ERS referenced to Rest, in standardized units) as our primary metric, we found that movement modulated beta power differently across ALS subtypes. In the Group model (ALS vs HC), the Group main effect did not reach significance (p = 0.064) and the Time Window - Group interaction was not significant, while robust main effects of Time window, Laterality, and Condition were replicated. When stratifying by hand strength, the Type main effect was significant (HC, ALS-Unaffected, ALS-Affected; p = 0.009), driven by a shallower ERD in ALS-Affected relative to ALS-Unaffected (Tukey, p = 0.047), whereas ERS differences remained modest and non-significant. Baseline z-scores did not differ between ALS and HC, and subtype offsets were small; because the primary metric is Rest-referenced within subject, such offsets are unlikely to explain the observed effects.
Baseline beta power
Dukic et al. recently published an EEG study and found resting-state beta power to be significantly lower in ALS and a negative correlation between beta band power and fine motor- and lower motor neuron scores.38 In our data, baseline-uncorrected beta at rest was lower in the clinically weak subgroup compared with the strength-preserved subgroup, broadly consistent with reduced resting beta in more affected patients. This could possibly be due to the different modalities (EEG versus MEG) or related to the global normalization procedure performed in Dukic et al.
Changes in beta have been explored in healthy subjects; GABA concentration modulates the beta frequencies and power in the sensorimotor areas of the brain.13,14 Modulating GABA activity by administration of benzodiazepines39 leads to a baseline increase in beta power and a larger ERD with movement. Thus, the decrease in ERD (less beta suppression) we find in clinically weaker ALS could be consistent with reduced inhibitory GABAergic activity.
Movement related beta-modulation and baseline dependency
Because baseline-corrected beta modulation is computed within subject (ERD/ERS referenced to Rest on a standardized time course), the main effects do not hinge on between-group baseline differences. Complementary analyses of baseline-uncorrected beta (Results; Supplementary) nevertheless showed lower absolute beta power in both ERD and ERS for ALS-Affected versus ALS-Unaffected. Together with the baseline-corrected finding of a shallower ERD in ALS-Affected, this supports a genuine reduction in movement-related beta modulation rather than a simple rescaling by baseline.
One alternative explanation is a floor effect in the measurements: lower baseline power could limit further desynchronization. This possibility is hinted at in Supplementary Figures 4–5, where the absolute minimum near the end of ERD appears similar across groups. However, the convergence of baseline-corrected beta modulation and baseline-uncorrected beta differences argues that the attenuation reflects impaired modulation rather than baseline alone.
Active versus passive movement
For both the combined ALS group and the stratification based on hand strength, we found no interaction between the groups and the type of movement performed (active versus passive). That is, ALS patients exhibit a comparable active > passive contrast to healthy subjects. The pathological signature therefore lies in the magnitude of the beta-modulation, chiefly the desynchronization in clinically weak patients — not in an additional task-specific abnormality. Thus, our results do not support our pre-study hypothesis that abnormalities in beta-modulation would be seen specifically in the active task in ALS.
These findings converge on a single theme: disease burden blunts the dynamic range of the sensorimotor beta rhythm, regardless of movement type. The underlying physiology explaining beta modulation with passive movement is much less studied than is active movement. Thus, it is more challenging to explain these findings fully.
Movement-related beta modulation in ALS
Consistent with previous ALS work, our findings align with reports of reduced beta-ERS40 and reduced beta-ERD41 and are compatible with reports of slowed beta-ERS.42 Because our analyses focused on amplitude, not latency, we cannot comment on ERD/ERS timing.
However, the only two prior MEG studies investigating movement-related beta modulation reported an increased ERD and reduced corticomuscular coherence in ALS,43 and thus it is hard to fully conclude on pathognomonic ERD/ERS changes in ALS. More recently, Yoganathan et al. reported reduced contralateral beta corticomuscular coherence and altered cortical beta burst dynamics during an isometric hand-contraction task in ALS, supporting abnormal motor-system beta physiology while also highlighting that the direction and expression of beta effects can vary across tasks and cohorts.16 Although our presented data of sub-group differences could explain the varied findings in prior studies.
Our results align with the study by Proudfoot et al.42 that interpret attenuation in ERD as potentially related to a loss of GABAergic inhibitory activity.
A loss of inhibition is in line with prior TMS studies revealing cortical hyperexcitability even at very early disease stages, as reviewed recently by Timmins et al.2 As well as evidence towards GABAergic pathogenesis in a recent resting-state MEG study.44 Results from TMS and MEG are not easily compared, as the former relies on a motor evoked response elicited from stimulation of the motor cortex, whereas beta-ERD observed with MEG likely arises from activity in the thalamocortical network. Thus, the techniques likely reflect different aspects of cortical excitability, but in general results indicate a disturbance in cortical excitability.
One potential confounding factor for ERD and ERS in the active task is the effective force participants can generate. Because ALS patients often experience reduced muscle strength, they may need to exert greater effort to accomplish the same movement. Although we did measure acceleration, we cannot rule out differences in effort between the groups as patients likely require more effort to produce the same acceleration. However, the lack of a condition interaction in baseline-corrected beta modulation suggests any effort-related confound is limited. Future studies that also look at imagined movement could possibly elaborate on this.
Disease severity did not appear to relate to motivation or the number of trials completed; all participants completed all trials. Finally, we did not control for Riluzole use, a drug commonly used in ALS patients, which can affect cortical function as a glutamatergic modulator.45
Beta modulation during passive movement may reflect the same M1 pathology observed in active movement. Disturbed beta power modulation in the passive task could be reflecting changes in primary motor cortex. Indeed, several fMRI studies have shown that primary motor cortex is activated during proprioceptive processing.46,47 A very recent study using laminar fMRI shows activation of M1 during both attempted and passive finger movement in a locked-in ALS patient.48 The finding further increases applicability of MEG for cortical measurements even in very late stages of ALS. Another possible explanation is that the modulation of beta power with passive movement reflects a spread of ALS pathology beyond primary motor cortex. To explore this further, future studies, if designed carefully, could combine MEG/MRI/TMS to possibly enable a more complete understanding of the beta change in ALS at rest and in movement.
Limitations and statistical power
The chief limitation of the present work is sample size. Although our total cohort (11 ALS, 12 HC) is typical for patient MEG studies, subclassification by hand-strength leaves only n = 6 “Unaffected” and n = 5 “Affected” patients giving ~55 % power to detect effects as large as those observed at ERD (Cohen’s d ≈ 0.8–1.3) but <35 % power for medium effects. Non-significant findings could therefore be false negatives, and the significant contrasts — even though large — require replication in a larger cohort. The sample size also limits the possibility for specific sub analysis as to the effects of ALS in separate hemispheres and movement conditions, since this reduction to effectively 1/4 in observations does not allow sufficient power.
We standardized beta-power time courses within subject (after sensor/frequency averaging) to improve comparability across subjects while keeping the analysis in the beta-power domain.
Another limitation of the current study is that we did not perform source localization, so we cannot elaborate on the direct sources for our data, as such confounding factors such as muscle fasciculations in the ALS group could remain in the data. However, these potential muscular artifacts would most likely manifest as broadband interference, rather than modulations exclusively in the beta band like we observed. We did not observe any differences in the overall location for the beta band change between groups and selected only a small number of gradiometers to investigate local (sensorimotor) changes (See Figure 3).
Beta modulation and disease severity
For both active and passive movement, we find that beta modulation is less pronounced in patients with more severe hand weakness, indicating a link to disease severity. We did not find correlations that survived Holm adjustment between contralateral baseline-corrected beta modulation and either ALSFRS-R or upper motor neuron burden (PUMNS), which is not surprising given the small cohort and the broad functional scope of ALSFRS-R.
Conclusion
ALS alters sensorimotor beta-modulation principally by blunting ERD in clinically weak patients, with no evidence for a task-specific (active vs passive) abnormality in beta modulation. Although baseline-uncorrected beta power at rest differs across subtypes, standardized baseline-corrected modulation — computed relative to each subject’s Rest — cannot be explained by baseline offsets alone. Abnormalities are present during both self-generated and passive movement. Passive-task beta-metrics thus provide an effort-independent window on upper-motor-neuron dysfunction that merits further study in larger and longitudinal samples. Further studies are needed to confirm the differences found between patients with and without loss of hand muscle force.
Data and code availability
Data are only available on request due to ethical and privacy limitations. Data is not available publicly as we do not have permission to share in our ethical approval. Sharing would require formal data sharing agreement and ethics approval. Code is available by contacting the corresponding author.
Author Contributions
Tobias Sevelsted Stærmose: Conceptualization, investigation, Writing – original draft, review and editing, formal analysis, software and methodology. Jakob Udby Blicher: Conceptualization, Investigation, writing – original draft, methodology, review and editing. Sarang S. Dalal: Conceptualization, resources, review and editing Christopher J. Bailey: Conceptualization, software, review and editing, resources and methodology. Lau Møller Andersen: Software, formal analysis, methodology, review and editing.
Ethical statement
All participants were given written and oral information before providing written informed consent. The study was approved by the scientific ethics committee of Region Midtjylland, Denmark (ID number: 65059).
Funding sources
This study was supported by the Innovation Fund Denmark with a grant for the REMAP project (Grand Solutions, Grant No. 6153-00010B) and by the Department of Clinical Medicine at Aarhus University.
Conflicts of interest
None of the authors has potential conflicts of interest to be disclosed.
Acknowledgements
Special thanks to the Plasticity and Disease group at CFIN, Aarhus University for discussions and practical help during the study. We also thank the artist Louise Sevelsted Stærmose for Figure 2.