
Introduction
The association of chronic pain (CP) to alterations in human brain structure and function has become a well-established fact.1 In-vivo magnetic resonance imaging studies have demonstrated CP related alterations to brain function and structure but have primarily focused on human grey matter.2,3 These findings have helped clinicians appreciate CP as a complex disease involving the central nervous system (CNS) and propose mechanisms of pain chronicization from observed brain alterations.4 Neuroimaging also shows promise as a biomarker, as it could identify functional and structural brain patterns compatible with a certain prognosis or treatment response in CP5–8 and therefore optimize clinical decisions at an individual level.9,10 Some examples of neuroimaging biomarker applications already appear in the literature, such as predicting chronicization of postsurgical pain,11 predicting response to a pharmacological pain treatment12 and using brain imaging marker for precision medicine application in low back pain.13
As understanding of CP has evolved, CP has been theorized to be more broadly considered a network disorder, warranting the study of the human brain’s white matter (WM) which encompasses the microstructural fibers that transfer information between disparate regions of the brain. Diffusion magnetic resonance imaging (dMRI) is a technique that measures the anisotropic movement of water molecules in-vivo and is sensitive to subtle changes to WM microstructure.14 Historically in CP literature, the most common approach of inferring microstructural alterations in human WM with dMRI data, is to fit a three-dimensional tensor and report parametric values extracted from the tensor such as fractional anisotropy (FA). Fractional anisotropy is a metric that reflects the variation of diffusion along the tensor’s primary axis relative to the perpendicular axes, and is related to the underlying microstructural organization/composition of tissue within a voxel. To date, studies using dMRI to examine human WM as it relates to chronic pain remain scarce and have produced inconclusive results.15 Results differ considerably between primary chronic pain conditions (e.g., chronic primary headache pain, chronic primary visceral pain, chronic primary musculoskeletal pain) with a multitude of dMRI acquisition and analysis methods implemented, leading to difficulty in comparing and interpreting differences between studies.
Even in studies where specific pain conditions were targeted (e.g., chronic low back pain (CLBP) and subacute back pain (SBP)), various analysis methodology was used and notable inconsistencies have been reported in the location and the degree of WM FA group differences with a more consistent finding of lower FA in CLBP patients relative to controls. Three studies have shown reduced baseline FA in CLBP compared to controls with varying sample sizes; 102 CLBP patients, 50 controls16; 24 CLBP patients, 22 controls17; 31 CLBP patients, 31 controls.6 Two studies have reported post-therapeutic effects measurable by dMRI in CLBP patients with FA increasing in WM regions after therapy.16,18 One study of patients with subacute back pain successfully predicted those who transitioned to a chronic pain state using measurements of FA along WM tracts,6 with a follow-up study more robustly predicting this transition using dMRI tractography derived measures of connectivity.19 While some agreement is found among reports of lower FA associated with CLBP, regions implicated in CLBP vary substantially between studies: left insular WM18; primary somatosensory cortex WM16; corpus callosum, bilateral anterior thalamic radiation, right posterior thalamic radiation, right superior longitudinal fasciculus, and the left anterior corona radiata17; the left superior longitudinal fasciculus, the left internal and external capsules, and anterior corona radiata.6
The problem of reproducible results is not confined to the field of chronic pain but is one of the fundamental challenges facing the neuroimaging field at large.20 Many studies have addressed repeatability in test-retest studies of dMRI measurements reporting generally reliable dMRI measures in healthy adult controls,21–23 across various age ranges24–26 and in patient cohorts27–29 with FA showing the highest reliability among diffusion tensor measurements in most cases. Repeatability has also been studied longitudinally, demonstrating that more advanced dMRI modelling produces metrics with high levels of repeatability over a 3 month interval.30 However, these studies only assess the repeatability of dMRI metrics within controls and patients separately. To reconcile the inconsistent findings in the CP neuroimaging literature and identify robust biomarkers that accurately represent the persistent changes of neural substrates in CP, it is important to identify regional WM differences between controls and CP patients that can be found repeatedly and at multiple clinically relevant time points. Also, while acquisition strategies such as repeated dMRI acquisition within a single session can improve signal-to-noise ratio and reduce within-session variability,31,32 they do not capture variability arising across independent imaging sessions. In contrast, multi-visit designs enable the assessment of between-session variability, including factors such as repositioning, physiological fluctuations, and scanner-related effects.33,34 Evaluating the reproducibility of imaging findings across separate visits therefore provides an additional level of robustness, allowing identification of spatial patterns that are stable over time rather than driven by session-specific noise. Such longitudinal consistency is particularly important for the development of reliable neuroimaging biomarkers and aligns with the broader objective of advancing toward precision medicine, where stability of individual-level measures across time is essential.
Here we present a method of experimental design and voxel-wise analysis that uses the stability of dMRI derived measurements of WM microstructure as a means to filter regional differences to only include group differences that are repeatable across three scans. The proposed repeatability analysis was applied to a pilot cohort of 25 controls and 27 CLBP patients with imaging acquired at 3 separate visits. As a comparison to the most commonly reported voxel-wise analysis method in the CP literature, we chose to use tract-based spatial statistics (TBSS), projecting adjacent FA values to a voxel-wise skeleton of a subject’s WM. Regions (clusters) that were found to have statistically significant between group differences were further filtered by image intra-class correlation coefficient (I2C2) values to remove regions that had non-repeatable measurements. In total, 11 regions were observed to have FA values that were stable across visits and were different between CLBP and control groups (7 higher in controls, 4 higher in CLBP). To compare our results to other more advanced methodology, an exploratory analysis was performed showing strong correspondence between the proposed repeatability analysis and tractometry, a method capable of segmenting and analyzing individual WM tracts from dMRI. The proposed repeatability analysis technique provides a method to incorporate reproducibility metrics into the analysis design and in the context of the CLBP pilot imaging study, detects regions with repeatable CLBP related group differences in FA, reducing the chance of spurious findings.
Methods
Participants
This study was approved by the ethics review board of the Centre intégré universitaire de santé et de services sociaux de l’Estrie – Centre hospitalier universitaire de Sherbrooke (CIUSSS de l’Estrie – CHUS), Sherbrooke, Canada (file number: 2021-3861). The study is also registered on the Open Science Framework (“Pilot project on brain and lower back imaging of chronic pain”, https://doi.org/10.17605/OSF.IO/P2Z6Y).
Control and CLBP participants were recruited and asked to visit the research center of the CHUS for cerebral and lumbar MRI scans for a total of three visits with a two-month interval. Saliva samples and questionnaires were also collected as a part of the larger study. Apart from their usual treatment, no therapeutic intervention was modified or administered to participants between visits. Participants were permitted to continue or initiate usual care during the study period (excluding treatments specified in the exclusion criteria) and were required to report any changes to their treatment regimen. All CLBP participants underwent pain intensity screening using the Brief Pain Inventory (BPI) short form35 to quantify their symptoms.
Exclusion and inclusion criteria for CLBP and HC with full details described in previous studies on behavior and grey matter density.36,37 In short, CLBP participants were included if they had low back pain for greater than 4 months, an average pain intensity of greater than or equal to 3/10 on the BPI within the 24-hour period before the initial visit and pain primarily localized to the low back. Control participants were excluded if they had a history of chronic pain, had pain at the time of testing or an outstanding painful episode within 3 months of enrollment.
In total, 27 CLBP (mean age 43 ± 16 years, 13 females) and 25 control participants (mean age 42 ± 14 years, 15 females) were recruited for this study, and had adequate imaging data for at least one of the 3 visits. Amongst these cohorts, 23 CLBP participants and 24 control participants completed all three visits or had adequate diffusion and anatomical imaging data acquired for the subsequent analysis. Study participants were selected to ensure no discrepancy in demographic, clinical or neuropsychological characteristics except for the pain inventory, as summarized in Table 1.
MRI acquisition
Imaging data was acquired on a Philips Ingenia 3.0T MRI located at the CHUS. For each subject and visit, whole brain T1-weighted structural imaging and diffusion weighted imaging (DWI) were acquired. Structural T1-weighted imaging (1.0 x 1.0 x 1.0 mm³) was acquired with TE = 3.5 ms, TR = 7.9 ms, flip angle = 8°, and a scan time of 4:19 min. DWI was acquired with a single-shot EPI spin-echo sequence (Multiband factor = 2, SENSE reduction factor = 1.9, Partial Fourier (Halfscan) factor = 0.6949152), TR = 4800 ms, TE = 92 ms, flip angle = 90°, 66 slices were acquired at a 2 mm thickness with no gap and 2.0 × 2.0 mm² in-plane. In total, 108 diffusion volumes acquired using 7 b = 0 s/mm², 8 b = 300 s/mm², 32 b = 1000 s/mm², 60 b = 2000 s/mm², and 1 = 0 s/mm², acquired in the reversed phase encode direction in a scan time of 9:19 min. All T1-weighted and diffusion-weighted images were visually inspected for motion artifacts, including ringing and blurring, and no scans were excluded on this basis. During the diffusion scan, no difference in motion was reported between CLBP and HC (Figure S1).
Preprocessing
Structural T1 and diffusion weighted images for each subject and visit were preprocessed using the Tractoflow pipeline.38 In short, the Tractoflow pipeline performs image denoising,39 magnetic field susceptibility correction,40 eddy current correction,41 non-linear registration from T1 imaging space to diffusion imaging space using ANTs,42 brain extraction and tissue segmentation on T1 images,43 image intensity normalization,44 spatial resolution resampling, outputting DTI parametric (e.g., fractional anisotropy (FA)) and fiber orientation distribution function (fODF) maps. T1-to-dMRI co-registration did not induce any significant group variations and stayed consistent across visits as shown in supplementary analysis (Figure S2).
Tract-based spatial statistics
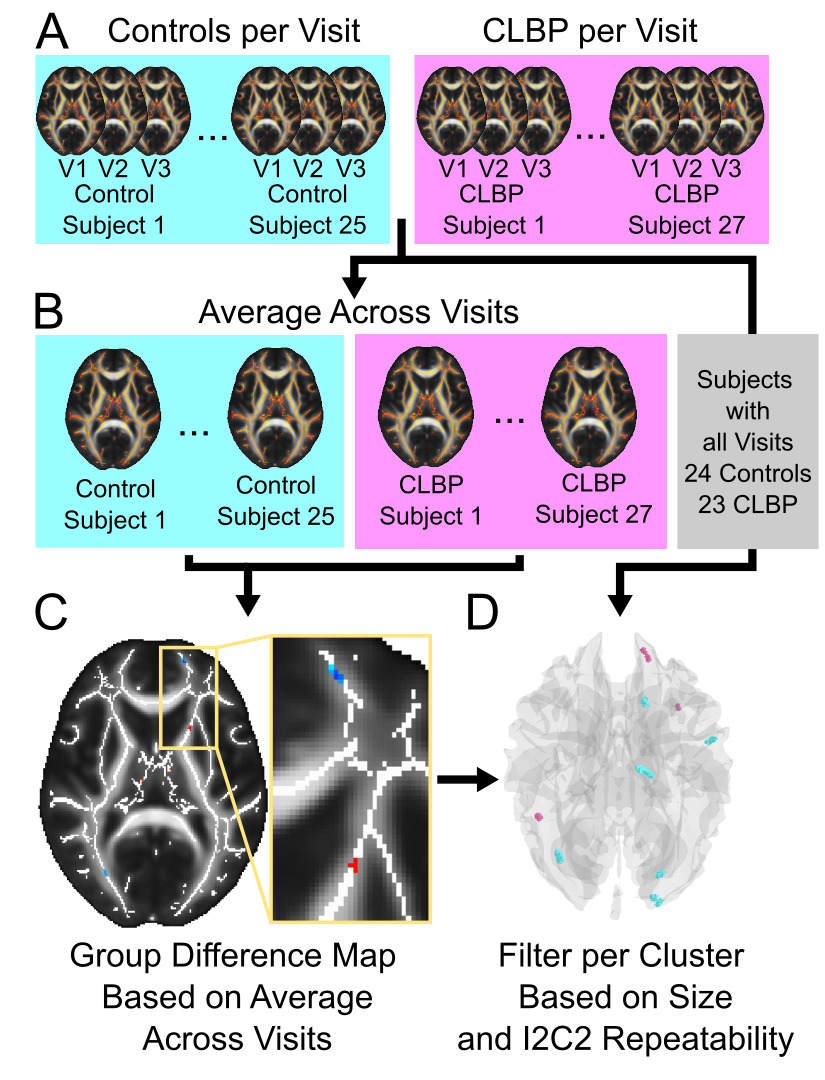
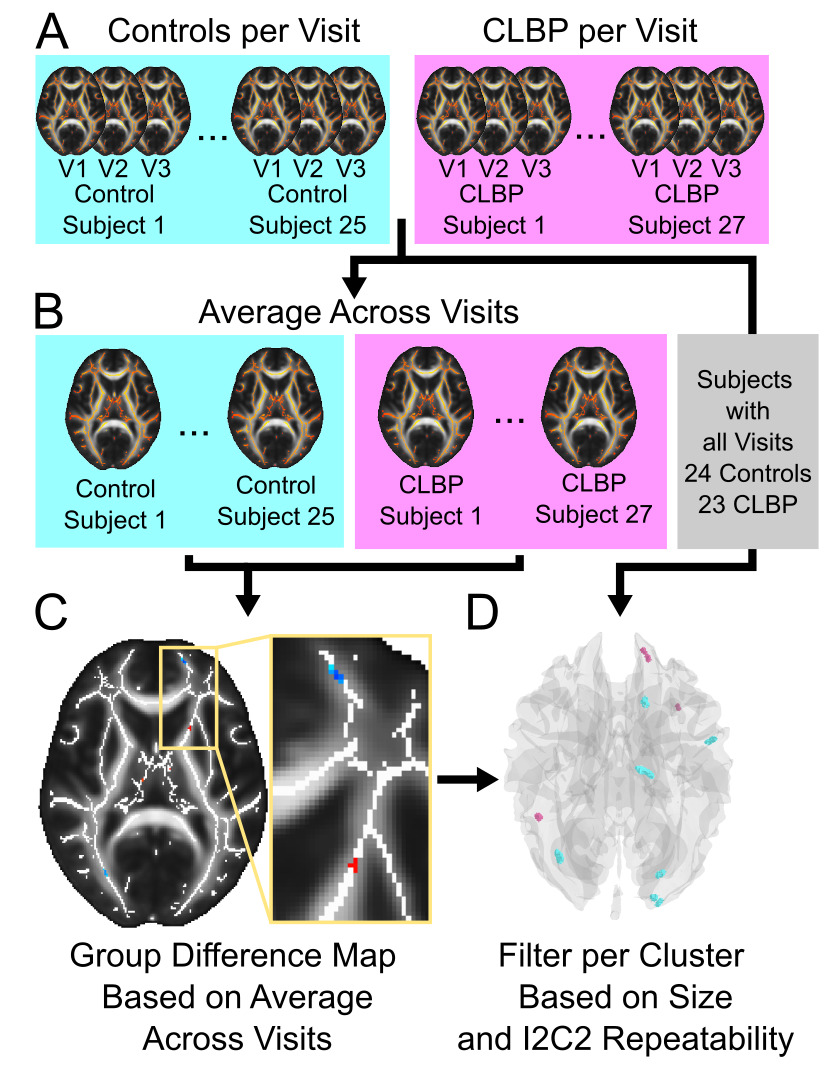
To leverage the longitudinal design of the dataset, a customized repeatability analysis pipeline was used to extract regions (clusters) that had a measurable group difference at all three visits. The custom pipeline is visualized in Figure 1. Using the preprocessed FA maps output from the previous steps, Tract-Based Spatial Statistics (TBSS),45 an automated voxel-wise diffusion analysis tool (FMRIB software suite), was performed using default parameters by first generating a WM skeleton, at a spatial resolution of 1 mm x 1 mm x 1 mm, for the entire cohort (all subjects and scans included) and then projecting FA values to this skeleton for each subject and scan.
Repeatability analysis
To improve the sensitivity to detect group differences, skeletonized FA maps were first averaged across visits for each subject generating a single FA map per subject. A two-sample t-test was then performed (FSL randomise) between groups using the subject FA maps averaged across visits outputting a single parametric t-statistic map along the skeleton. The parametric map was thresholded at a t-statistic value of |2.5| (p <0.01) and remaining clusters were excluded if they were less than 10 voxels in size (i.e,. a volume of 10 mm3, on 1mm3 WM skeleton). Finally, to remove clusters that had unreliable FA values across visits, the image intra-class correlation (I2C2)46 was calculated for each remaining cluster using only the subjects that had adequate imaging acquired at all 3 visits. Clusters with I2C2 values less than 0.75 (good to excellent reliability,46,47) were removed leaving clusters with a measurable group difference and had repeatable values across visits. All code to perform this portion of the analysis has been made openly available (https://github.com/Tetreault-Pain-Imaging-Lab/tpil_i2c2_filter/releases/tag/v1.0.0-beta).
Comparison to single visits
As a comparison to standard cross-sectional designs, the same group difference analysis, parameter map thresholding (t-statistics greater than |2.5|) and cluster size thresholding (clusters containing greater than 10 voxels) were performed separately for each visit. Resulting clusters were then separated into those where controls had greater FA compared to the CLBP group (t-statistics greater than 2.5) and those where CLBP had greater FA compared to the control group (t-statistics less than 2.5). Clusters retained from the three analyses performed for each visit separately were compared to those retained from the proposed repeatability analysis as follows. First, the total number of clusters retained after statistical/voxel size thresholding at each visit were totaled. Then the clusters retained at each visit were compared to those retained after the proposed repeatability analysis to identify the number of clusters that spatially overlap in both analyses. For example, for the visit 1 analysis, both the total number of clusters retained and the total number of clusters that overlap the proposed repeatability analysis are calculated.
Comparison to alternative methodology: Tractometry analysis
To compare results from the proposed repeatability analysis with alternative methodology, a supplementary automated tractometry analysis was performed. Whole brain tractograms were generated using the previously used Tractoflow pipeline38 with default analysis parameters. Whole brain tractograms were then segmented into separate bundles using BundleSeg48 with a whole brain WM tract atlas (Rheault, 2023), outputting 51 WM tracts per subject. Six clusters (4 control FA > CLBP FA in the occipital lobe and 2 CLBP FA > control FA located in the superior frontal lobe) were selected for further investigation from the TBSS repeatability analysis because they were located in adjacent regions. Tracts overlapping TBSS clusters were identified by computing the spatial overlap between the thresholded TBSS cluster masks and binary voxel masks derived from a population-average WM tract atlas. Each atlas tract was converted to a binary voxel mask using DIPY’s density mapping, and the voxel-wise intersection with each cluster was calculated. Tracts were considered overlapping if any streamline voxels intersected the cluster mask and were retained for tractometry analysis. To further localize where along each tract the group differences occurred, overlapping bundles were subdivided into 50 equidistant segments using centroid-based label mapping (scil_bundle_label_map) and average FA was calculated for each segment.28 To test for segments with different FA values between controls and CLBP, two-sample t-tests (p < 0.05, uncorrected) were performed per segment per visit. For comparison to the repeatability analysis, tract segments that overlapped clusters output from the proposed analysis were identified.
Results
Group average regional differences in fractional anisotropy
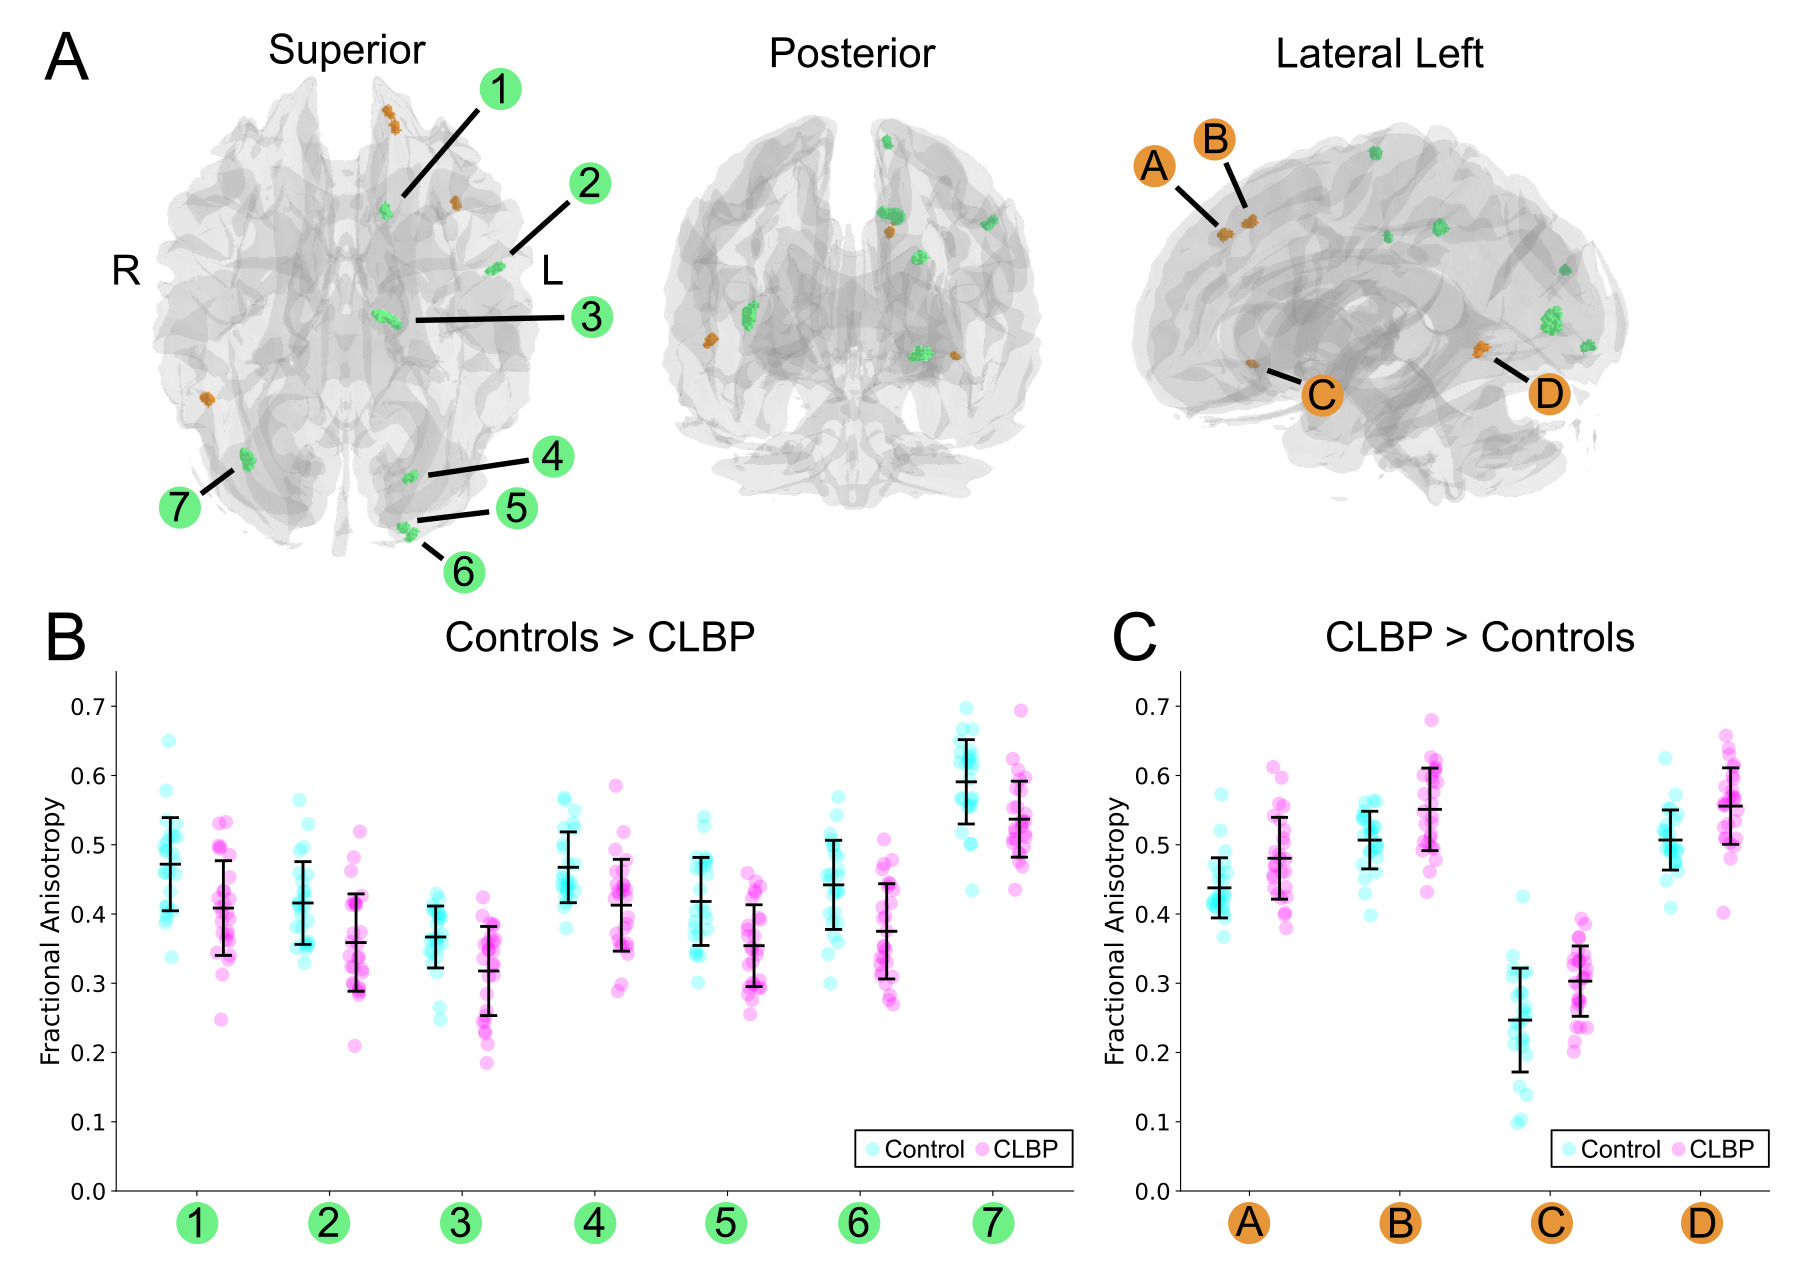
The repeatability analysis pipeline identified 11 WM clusters with stable group differences in fractional anisotropy (FA) across all three visits. The 11 clusters are visualized in Figure 2, along with average FA values extracted for each cluster. Seven of these clusters showed significantly higher FA in the control group compared to the CLBP group, while four clusters showed higher FA in the CLBP group. The distribution of these FA values for each participant, averaged across the three visits, is plotted in Figure 2B (Controls > CLBP) and Figure 2C (CLBP > Controls), illustrating a clear separation between the groups.
_visualization_of_clusters_with_different_fractional_anisotropy_values_between_groups_(t.png)
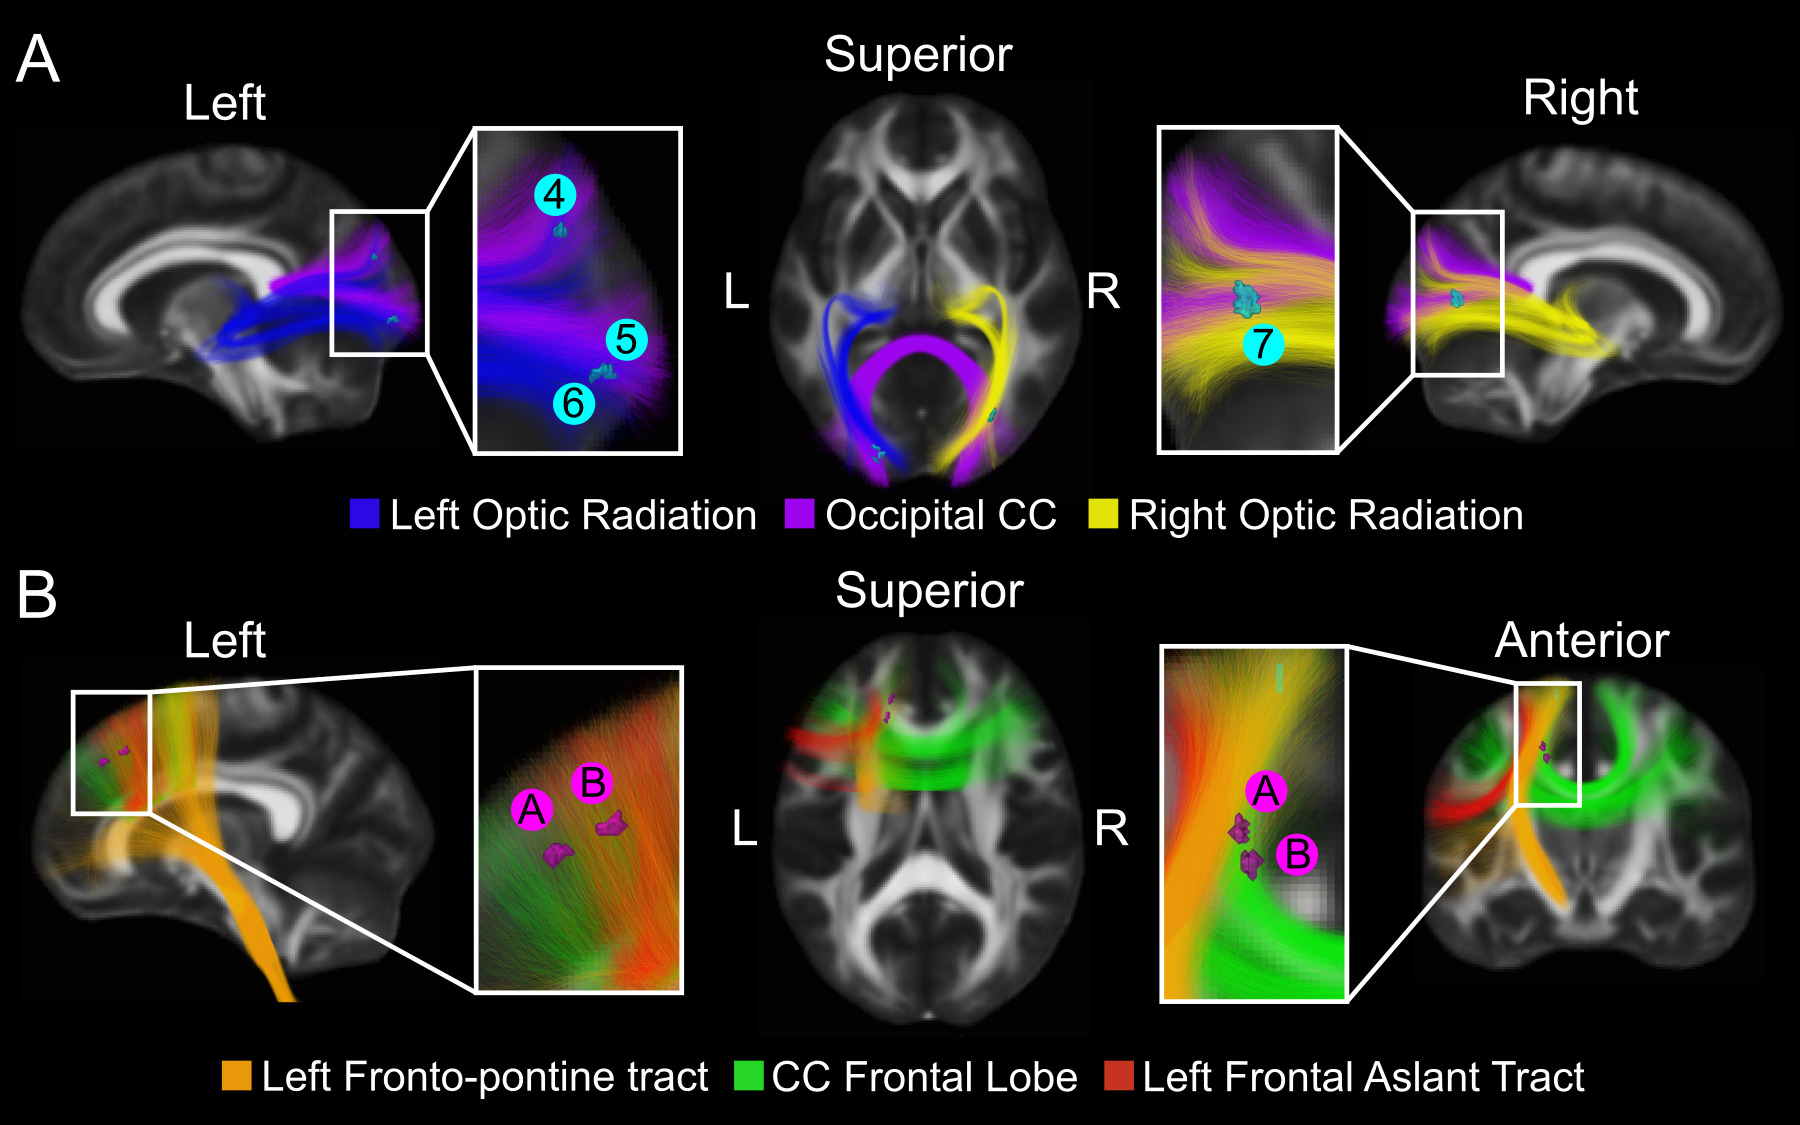
Among the 7 clusters showing higher FA in the relative to the CLBP group, 4 were located in the occipital lobe (left hemisphere: clusters 4,5,6; right hemisphere; cluster 7), 2 were located in the left parietal lobe and 1 was located in the left frontal lobe. Among the 4 clusters showing higher FA in the CLBP group relative to controls, 3 were located in the left frontal lobe (clusters A, B, C) and cluster D located in the posterior portion of the right temporal lobe.
Detailed statistics for each of the 11 clusters are presented in Table 2. The clusters ranged in size from 10 mm³ to 48 mm³. Effect sizes were moderate to large, with Cohen’s D values ranging from 0.818 to 1.043 for clusters where controls had higher FA, and from -0.818 to -0.982 for clusters where CLBP patients had higher FA. All group differences were statistically significant (p < 0.005, uncorrected for multiple comparisons). All 11 clusters demonstrated good to excellent repeatability, with Image Intra-class Correlation Coefficient (I2C2) values for the entire cohort ranging from 0.7685 to 0.8821 (good to excellent46,47). We also performed exploratory analyses searching for correlation between the identified clusters and some of the pain and behavioural measures collected. We observed a stable relationship between cluster 1 (located in the left Fronto-Pontine Tract) and two pain measures (severity component of the Brief Pain Inventory and reported pain at time of sampling from the PainDetect) as well as the State and Trait Anxiety Inventory (for both the State and Trait scales) (Figure S3).
Stability of findings across visits
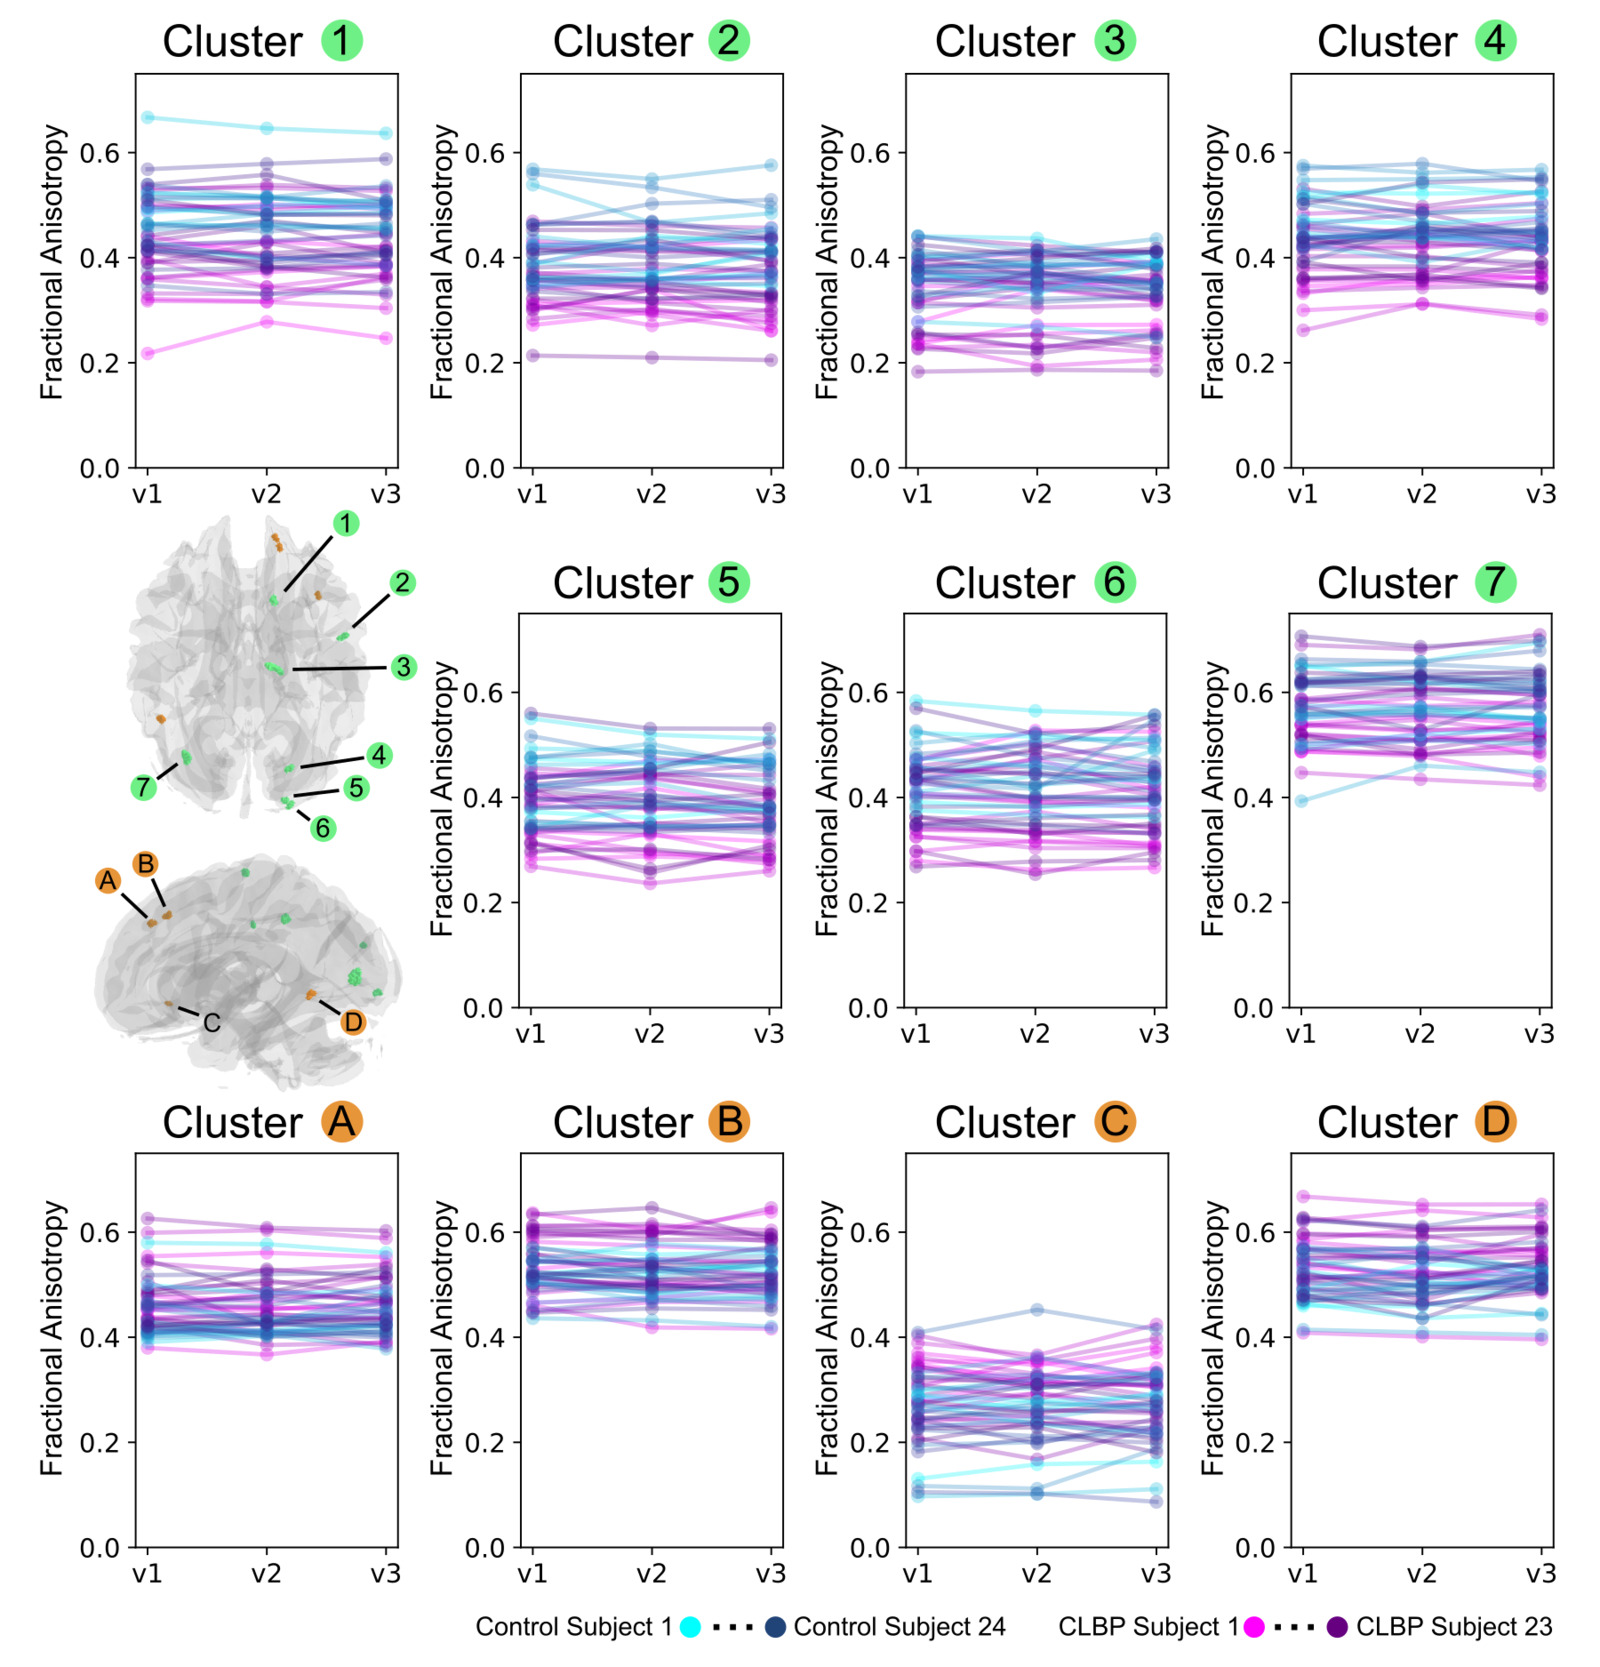
To confirm the stability of these findings, the group differences within the 11 identified clusters were examined at each visit independently. The mean FA values are shown for all 11 clusters for each subject and visit in Figure 3. The mean FA values for individual subjects remained consistent throughout the three visits, with minimal intra-subject variance for both control and CLBP participants.
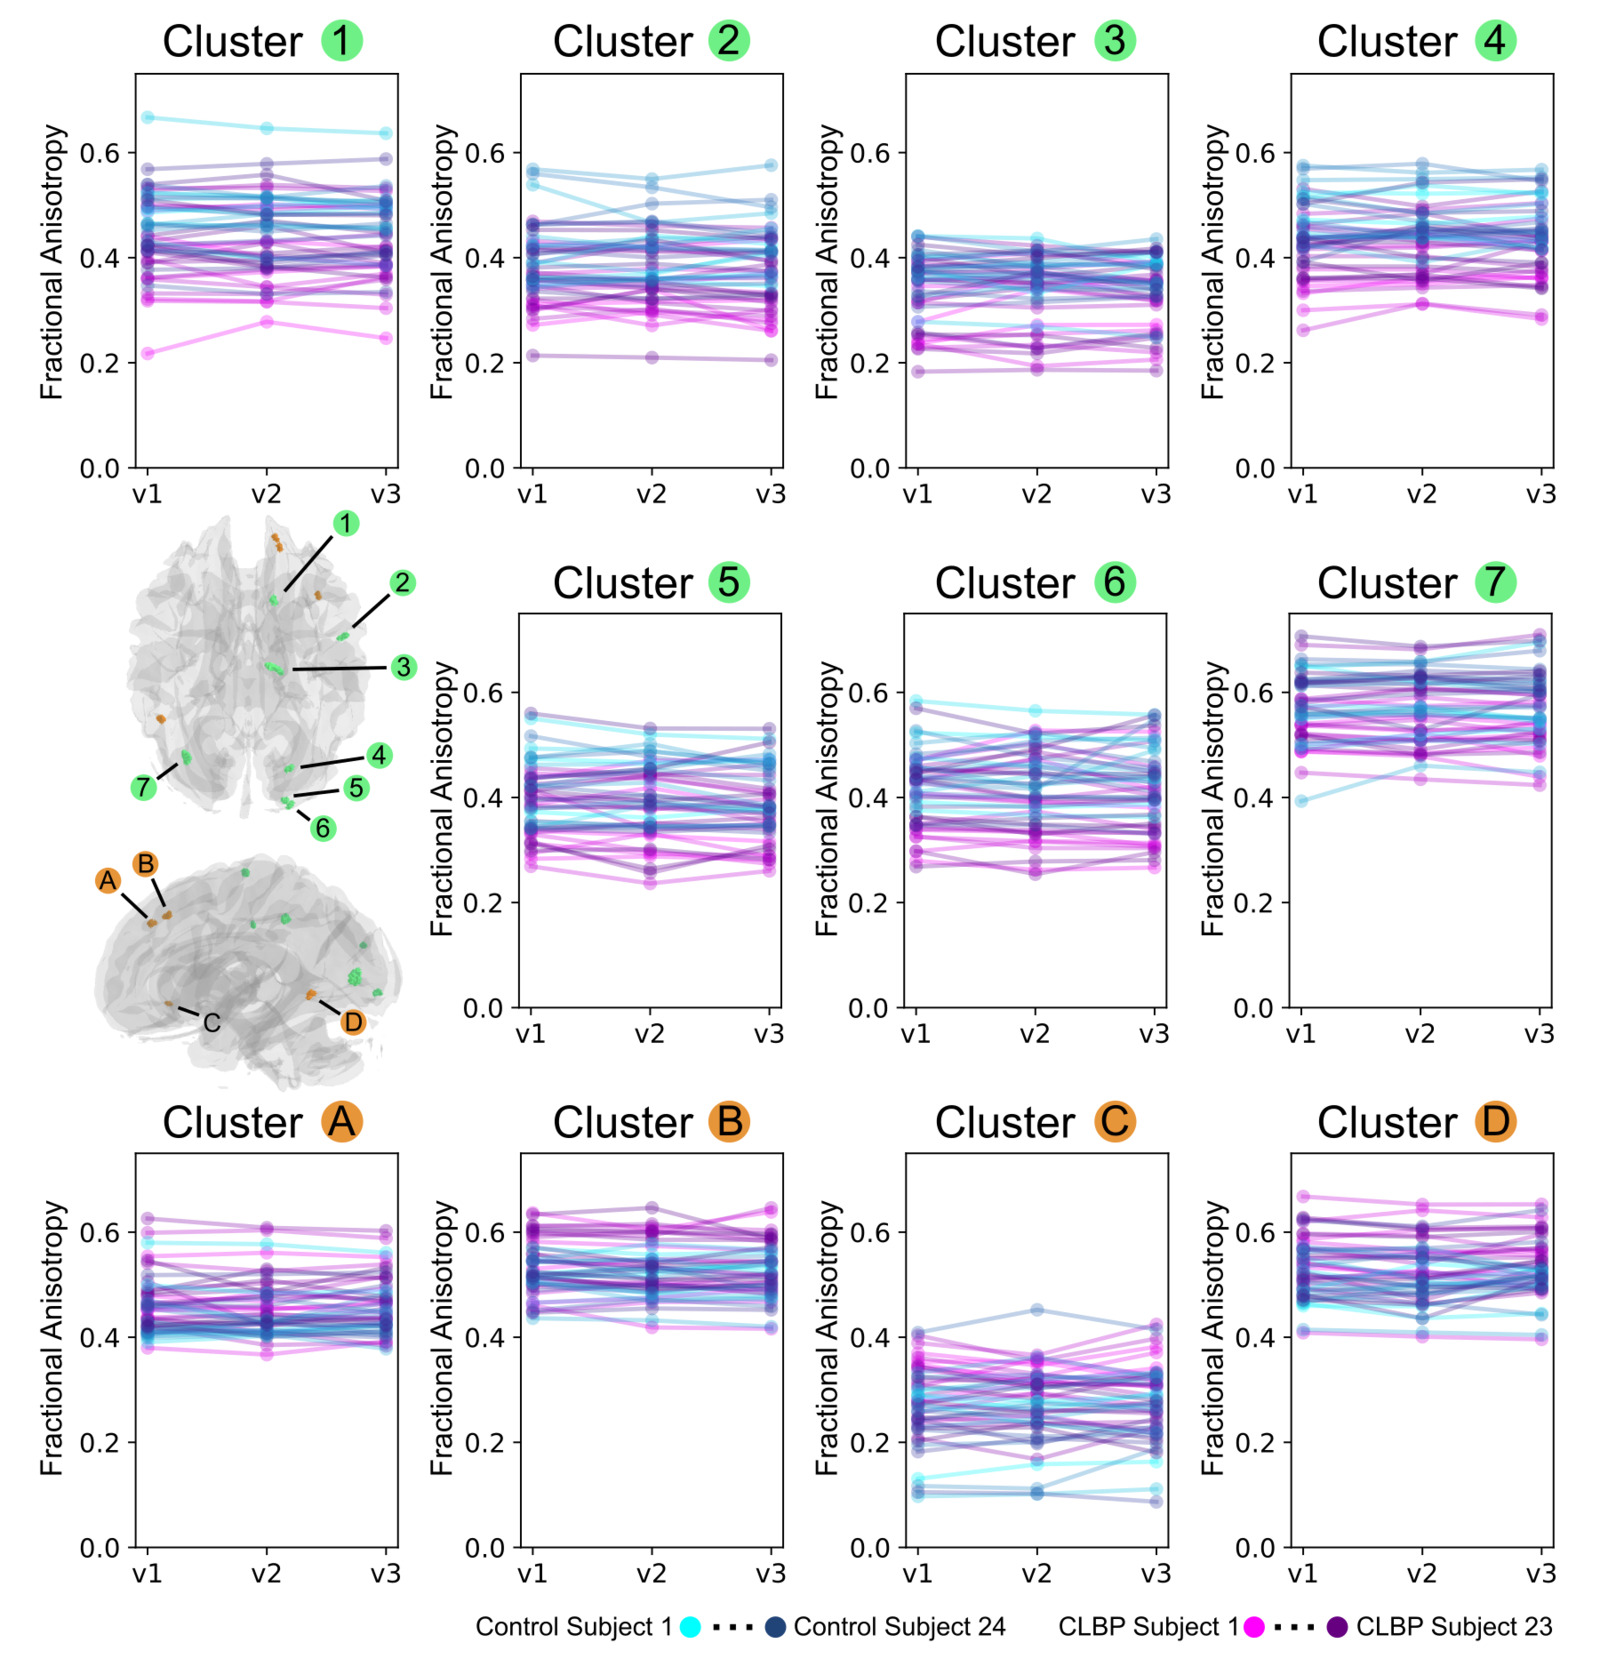
Table 3 provides a quantitative analysis of the stability of fractional anisotropy group differences, reporting the mean FA, Cohen’s D, and p-values for each cluster at each of the three visits. As intended by the design of the repeatability analysis, the direction of the group difference (e.g., Controls > CLBP) and the statistical significance were highly consistent for all 11 clusters across each time point. For example, Cluster 7 (FA Controls > FA CLBP) had p-values of 0.002, 0.003, and 0.004 (uncorrected for multiple comparisons) for visits 1, 2, and 3, respectively along with high I2C2 (Table 2. I2C2: 0.8534) which was used for thresholding clusters. This demonstrates that the repeatability pipeline is correctly identifying regions with consistent group differences at each visit along with the previously stated minimal intra-subject variance.
Reduced chance findings relative to a single-visit design
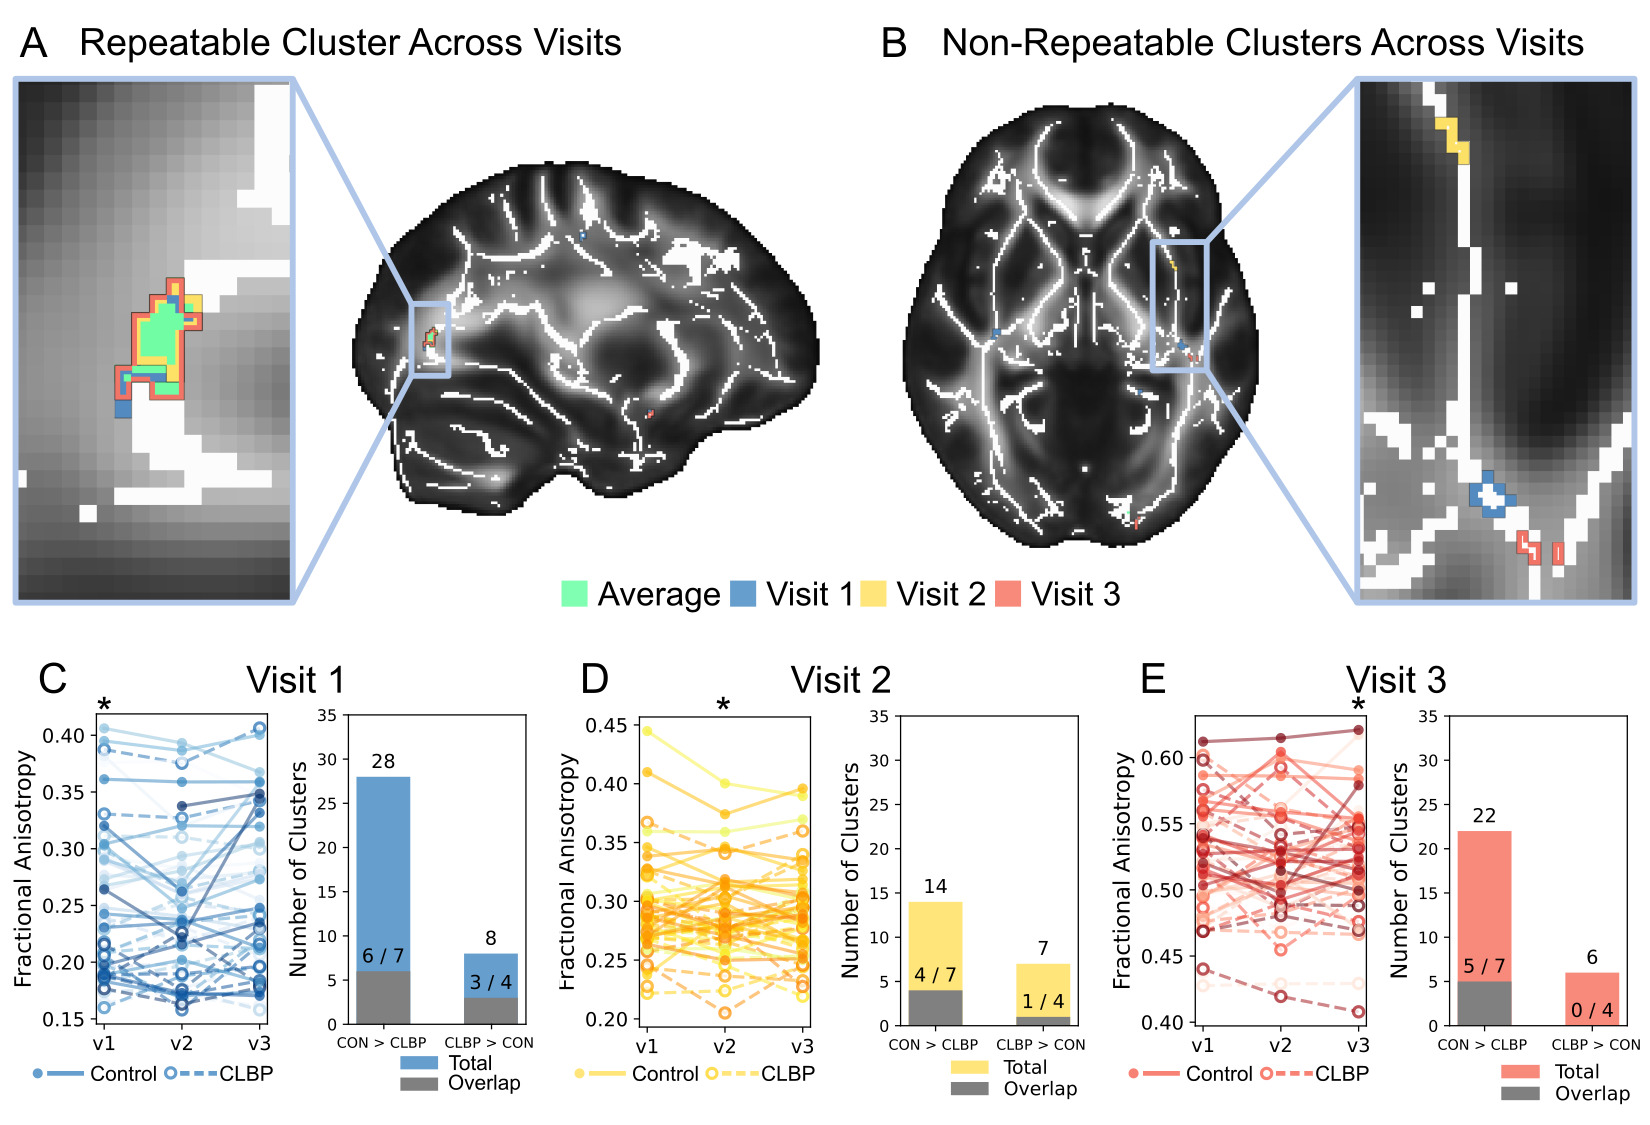
A key advantage of the proposed repeatability analysis is its ability to filter out spurious or non-repeatable findings that may arise in standard cross-sectional studies. As illustrated in Figure 4, analyzing each visit separately identified a large number of significant clusters, the majority of which were not consistent across visits. Figure 4A shows an example of a repeatable cluster, where the significant regions from each visit substantially overlap with the final cluster identified by the repeatability analysis. In contrast, Figure 4B provides an example of unreliable findings, where clusters were identified at single visits but showed no spatial agreement across time.
_an_example_region_where_fractional_anisotropy_was_observed_to_be_higher_in_controls_com.png)
The bar charts in Figures 4C, 4D, and 4E quantify this effect. At Visit 1, a standard analysis yielded 36 clusters (28 for Controls > CLBP, 8 for CLBP > Controls), but only 9 of these (6/7 and 3/4) overlapped with the 11 final repeatable clusters. Similarly, at Visit 2, 21 clusters were found, with only 5 overlapping the final results. At Visit 3, 28 clusters were found, with only 5 overlapping. These results strongly suggest that most clusters identified in a single-visit analysis are chance findings that are not stable over time, highlighting the value of the proposed repeatability-based filtering approach. Further examinations revealed that clusters identified in the proposed repeatability analysis but absent in individual-visit analyses did not exceed the minimum voxel size threshold when assessed at single visits.
Anatomical localization of repeatable findings
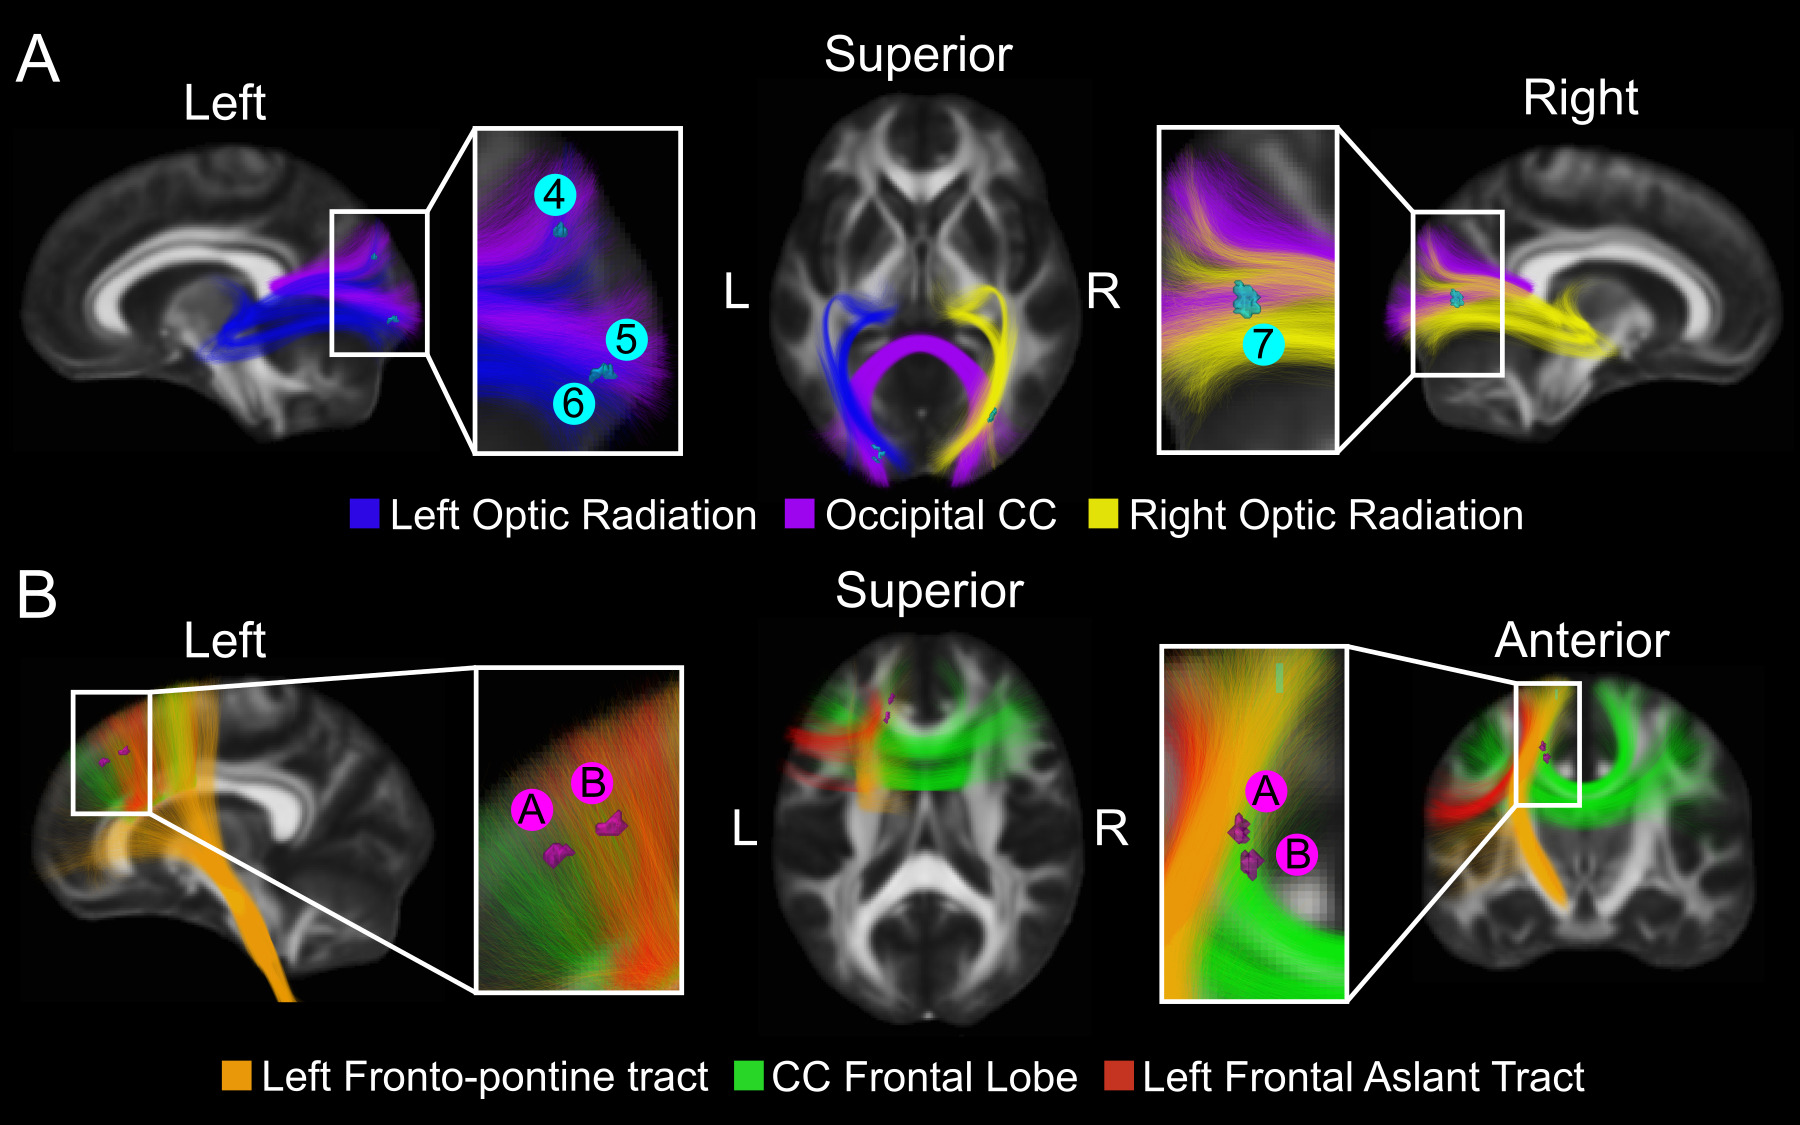
To place the identified clusters into anatomical context, a select subset of clusters was overlaid on major WM tracts, as shown in Figure 5. The 4 clusters residing in the occipital lobe with higher FA in controls were situated near known sensory and visual pathways. Specifically, clusters 4, 5, and 6 are adjacent to the left optic radiation and the occipital portion of the corpus callosum, while cluster 7 is near the right optic radiation. The two selected clusters with higher FA in the CLBP group were located near frontal tracts. As shown in Figure 5B, clusters A and B are adjacent to the left fronto-pontine tract, the frontal portion of the corpus callosum, and the left frontal aslant tract. It is important to note, however, that the proximity of these clusters to regions of crossing fibers impedes their definitive localization to a single WM tract.
Comparison of proposed method with alternative tractometry methodology
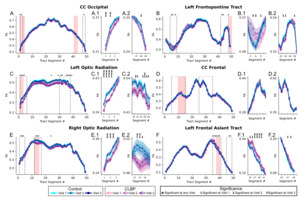
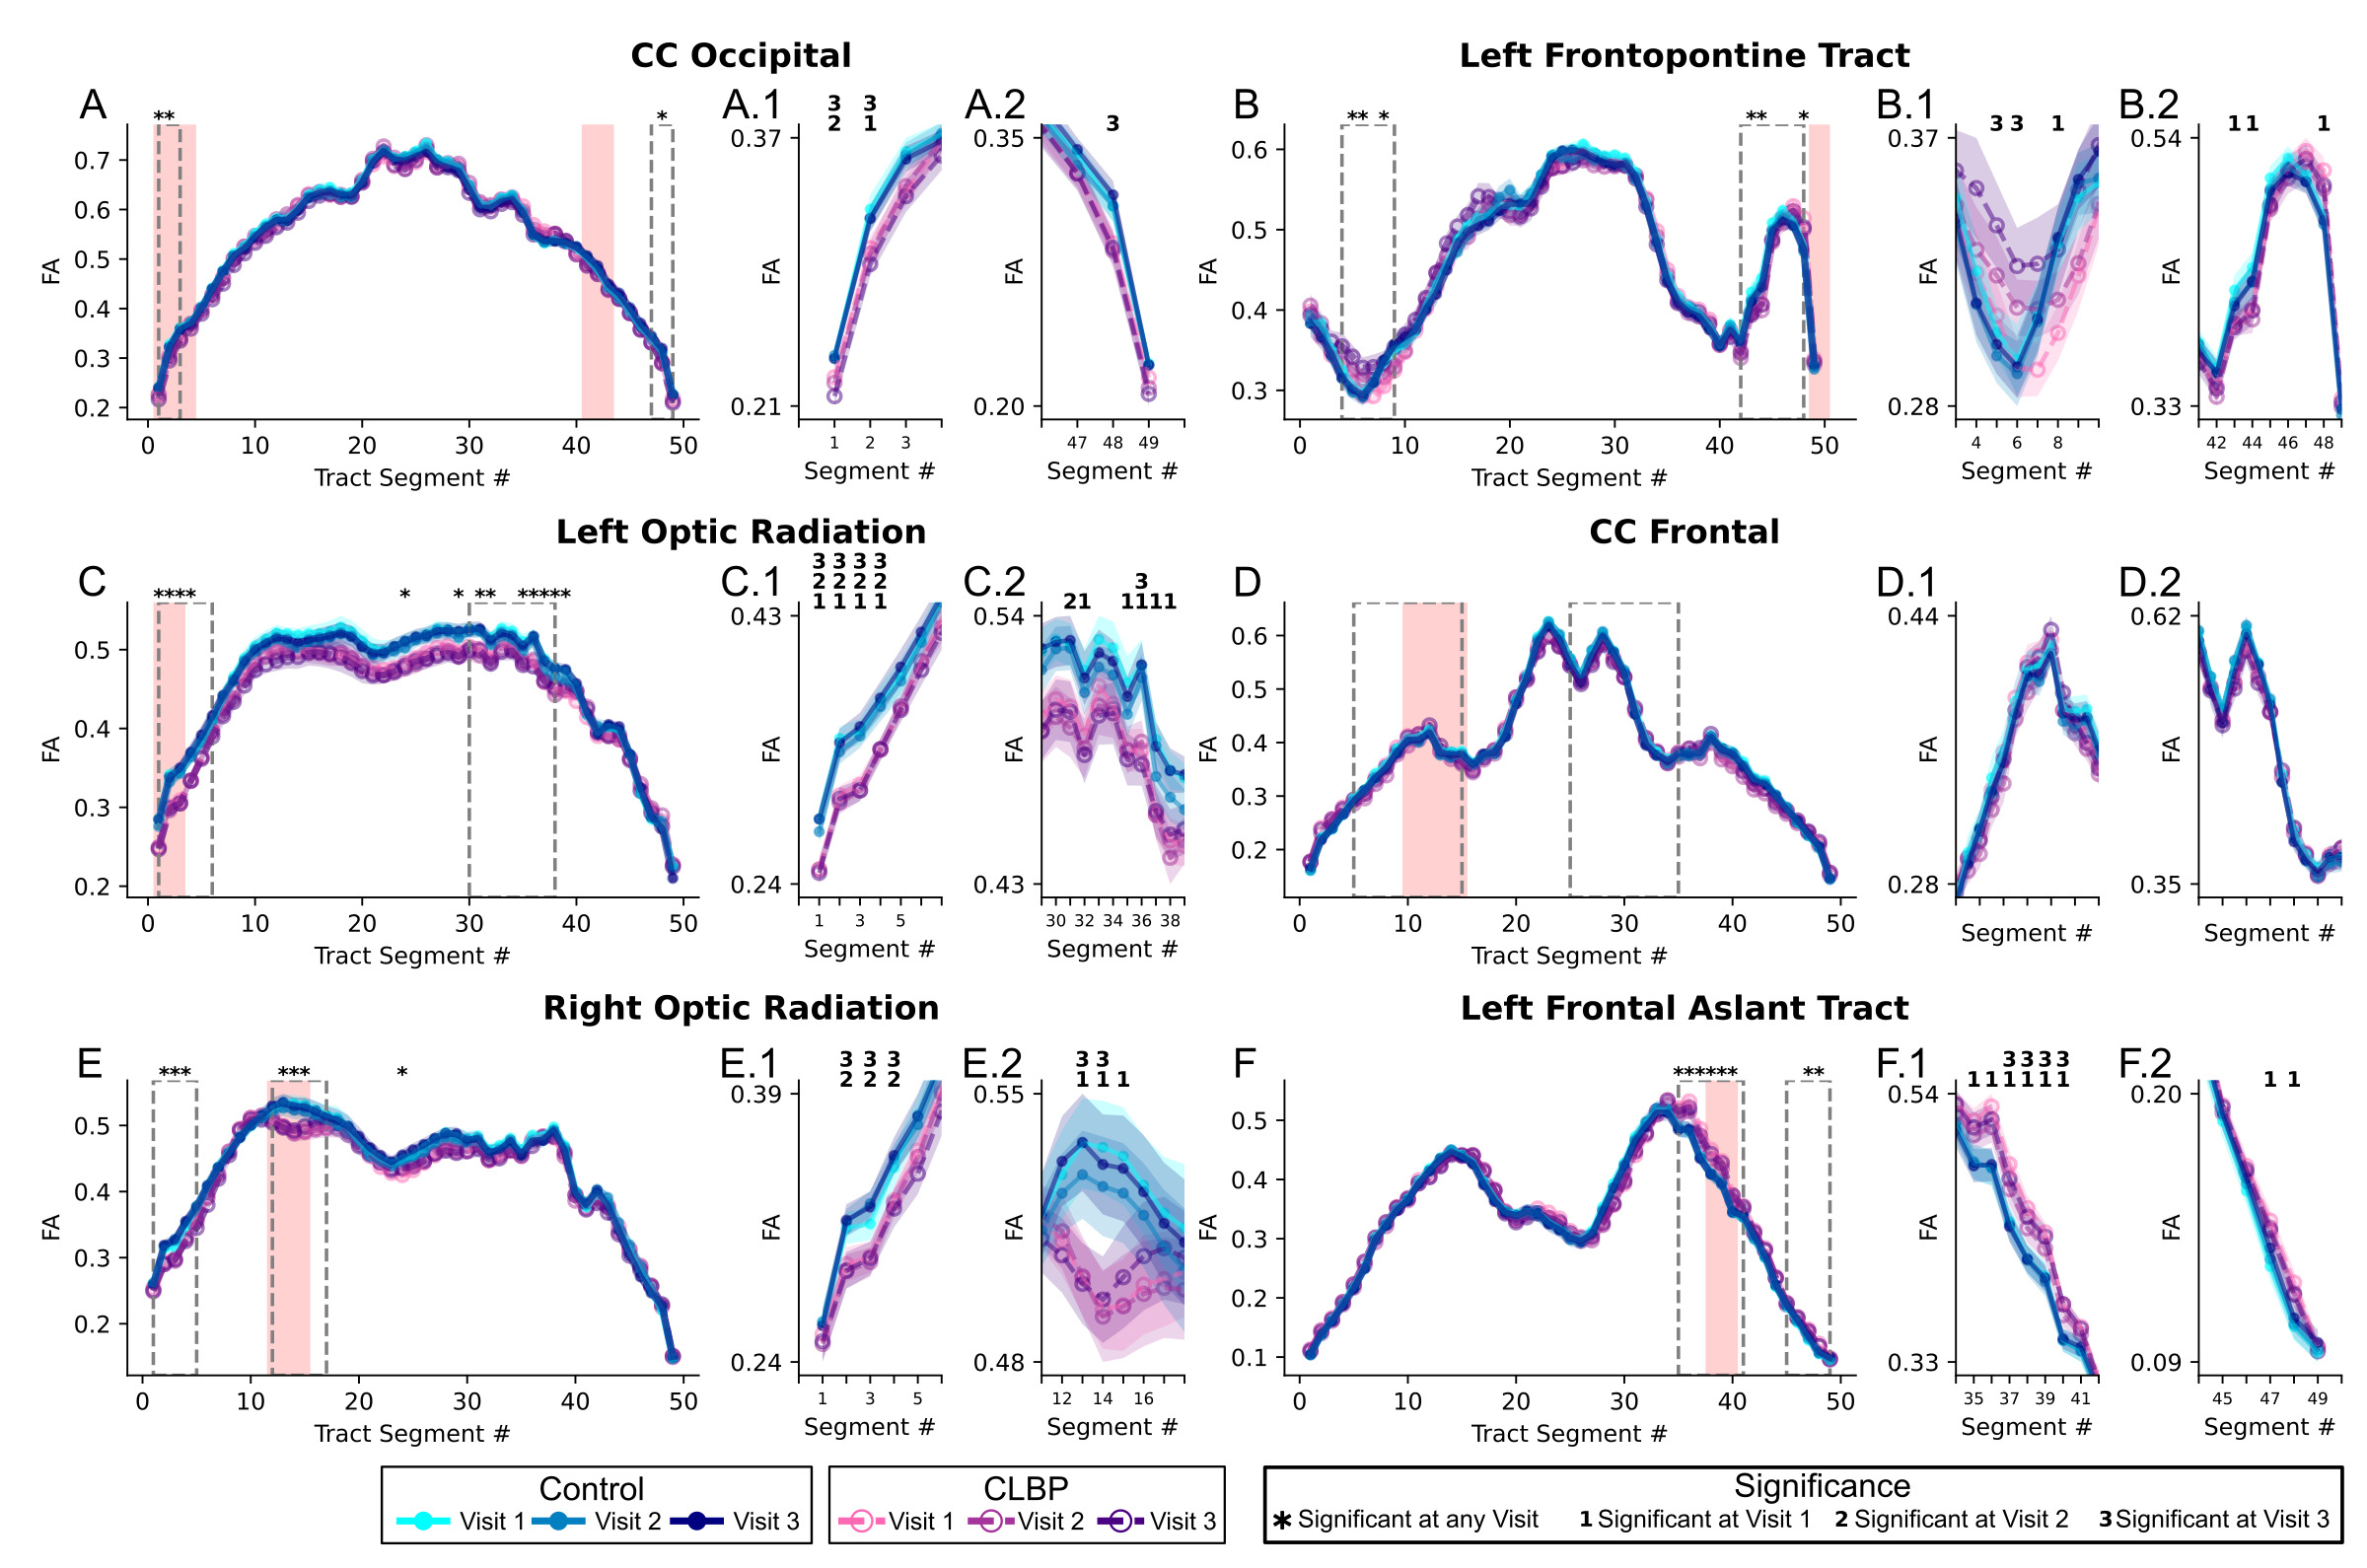
Six WM tracts overlapped the six selected clusters from the primary analysis (four where control FA > CLBP FA and two where CLBP FA > control FA). Tract profiles for each of these six tracts are visualized per group averaged for each visit in Figure 6. Of the six tracts investigated, only the Left Optic Radiation had segments that showed statistically significant differences in FA between the control and CLBP groups across all three visits (p<0.05, uncorrected). While other tracts displayed segments with significant group differences, these findings were less consistent across the three time points. In regions where statistically significant differences were observed for two or less visits, all three visits still had mean differences between groups larger than standard deviations (See zoomed in regions for the right optic radiation in Figure 6 panels E.1 and E.2) reflecting the small statistical power related to the small sample size but consistent trend level group differences across all visits. There was a strong spatial correspondence between the two methodologies in regions where the TBSS repeatability analysis yielded a statistically different group difference (highlighted 7 light red regions Figure 6). Among the tracts investigated, 7 regions overlapped retained TBSS repeatability analysis clusters, of which 5 had adjacent segments with statistically significant tractometry group differences. For study robustness, a supplementary tractometry analysis was conducted investigating the remaining 5 clusters that were more sparsely distributed across the brain, overlapping 9 tracts from the WM bundle template (Figure S4). For these clusters and compared to the tractometry analysis of the first 6 clusters, the spatial correspondence between TBSS and tractometry group differences was less consistent, with only 3 tract segments having consistent TBSS and tractometry group differences among the 20 tract segments that overlapped the TBSS clusters.
Discussion
Consistent regional alterations in white matter DTI metrics in chronic low back pain
The lower FA associated with CLBP and observed in 7 regions in the current study is in agreement with previous dMRI studies reporting similarly lower FA in CLBP relative to controls.6,16,17 Four regions were found to have higher FA in CLBP relative to controls; higher FA may also be associated with CLBP. In specific contexts, lower FA may indicate demyelination as in multiple sclerosis49 but altered FA values and dMRI derived metrics should be interpreted in the context of specific diseases and could have many underlying microstructural explanations.50 Thus, given the current state of the neuroimaging CP field, it is unclear the specific microstructural explanations for such alterations of FA in CLBP. Findings from one predictive study has suggested that lower FA may indicate a transition from an acute to a chronic pain condition, suggesting the alterations in WM may exist prior to the onset of chronic pain symptomatology and with these differences measurable up to at least one year later.6 Here, the WM microstructural alterations associated with CLBP were measurable at all three visits spanning 4 months, with patients presenting pain symptoms for at least 4 months prior to their first visit, supporting the finding that microstructural changes to WM are present across a long time frame after the chronification of pain symptoms.
Anatomical localization of white matter alterations in CLBP
Repeatable decreases in FA associated with CLBP were found primarily in the occipital lobe (4 of 7 clusters) which has not been typically reported in CLBP but found in other chronic pain conditions such as in cluster headaches.51,52 The two lower FA clusters found in the current study in the superior parietal regions were located adjacent to motor regions agreeing with lower FA found in the primary somatosensory cortex WM16 and supports the literature suggesting alterations to primary motor networks in these conditions.53 While no differences were found within the internal and external capsule WM regions as in other studies,6,18 higher and lower FA associated with CLBP were found in multiple regions along tracts that traverse these regions.
Isolating voxel-wise differences to singular WM tracts was difficult because regional differences were found in areas adjacent to the cortex where multiple tracts traverse. For example, in Figure 5, the regions with lower FA in CLBP were located along the corpus callosum and left/right optic radiations, demonstrating the difficulty in interpreting these regional differences as microstructural alterations along specific tracts, as others have reported when using TBSS analysis.6,17 Importantly, the 6 regions located in the occipital lobe (4 clusters control > CLBP) and frontal lobe (2 clusters CLBP < control) with altered FA reported from TBSS analysis in the current study agreed substantially with tract segments found with altered FA extracted from tractometry, albeit often without agreement between all 3 visits. This is an encouraging finding given the differences between how FA is measured between the two methods; TBSS projects the maximum FA value from adjacent voxels to the skeleton; tractometry averages across all voxel values overlapping a segment. A likely explanation for the small discrepancies between methods is that tractometry is an average over large WM regions, whereas TBSS is a more isolated WM measurement, and highlights the importance when interpreting results extracted from differential methodology between studies. In supplementary analysis (Figure S4) the remaining TBSS clusters were examined for consistent findings via tractometry, with these clusters being notably smaller and more sparsely distributed throughout the brain. In this case, the agreement between TBSS and tractometry were markedly less consistent than the previously analyzed regions suggesting that the likelihood of between method agreement is increased when more densely located clusters or larger regions are observed with TBSS.
Proposed repeatability analysis
Repeatability in neuroimaging literature is typically reported as intra-class correlation (ICC) values and are analogous to the I2C2 values (an extension of ICC for data acquired via imaging) reported in the current study. In previous works, ICC for FA values have been reported in the good-excellent range when assessing test-retest,23,26,27 cross-scanner data with denoising having a positive effect on repeatability.21 This current study specifically aimed to find regions that had repeatable measurements in both controls and CLBP patients, having I2C2 values in line with previous work (I2C2 values of 0.7685 - 0.8821) in the current study. This enabled the removal of regions where CLBP vs control group differences were observed at a singular visit but not at all three time points. For example, at visit 1, 26 regions surpassed cluster size and statistics thresholds with FA values lower in CLBP patients compared to controls; however, while using the proposed repeatability analysis only 7 such regions were retained. While it is notable that these repeated measures design comes with the added cost, effort and time needed to repeat the entire imaging acquisition, the technique has a substantial benefit to reduce the reporting of chance findings that can arise solely by measurement fluctuations when only single time points are considered.
Limitations and future directions
Even though the results are extremely repeatable, the study is still limited by a small sample size (25 controls, 27 CLBP) making it difficult to generalize these results to the entire CLBP population at large. This is a common limitation observed in the chronic pain dMRI literature with similar sized cohorts being used previously.6,15,17,18 The small sample size also likely impeded full inter-method agreement between the TBSS and tractometry analyses; while clear, trend-level group differences were often observed across all visits in the same regions for both methods, only a subset of these differences reached statistical significance, likely reflecting low statistical power.
Whole-brain neuroimaging analyses involve testing thousands of voxels simultaneously, requiring correction for multiple comparisons to control false positives. Many of these correction frameworks (e.g., Gaussian random field theory and cluster-based inference) were originally developed and extensively validated in the context of task-based fMRI, where assumptions regarding spatial smoothness, signal distribution, and temporal modelling are relatively well characterized.54–56 Structural MRI modalities such as diffusion imaging present different statistical properties, including non-Gaussian signal distributions,57 modality-specific spatial covariance,58 and dependence on preprocessing steps such as tensor fitting or skeletonization,32 which may challenge some of these assumptions.
In addition, when sample sizes are modest, stringent voxel-wise corrections can substantially reduce statistical power, reflecting the well-described trade-off between sensitivity and control of false positives in mass-univariate neuroimaging analyses,55 a limitation that is particularly relevant in whole-brain analyses. In the present study, each group included approximately 25 participants, but each participant was scanned at three time points across four months. In this context, applying highly conservative correction thresholds may obscure biologically meaningful effects. Therefore, in addition to conventional statistical testing, we examined spatial patterns of effects using uncorrected maps and evaluated whether these patterns were consistently observed across all three visits. While this approach does not replace formal multiple-comparisons correction, the replication of spatially consistent effects across independent time points provides complementary evidence supporting the robustness of the findings, as reproducibility across repeated measurements is known to improve the reliability of neuroimaging metrics.59–61 Importantly, such within-cohort reproducibility is aligned with the broader objective of advancing neuroimaging toward precision medicine, where identifying stable and biologically meaningful signals at the individual or small-cohort level is challenging, but essential for the development of clinically relevant biomarkers.10,62,63
A further limitation, inherent to the resolution of dMRI and tensor-based analysis, is the difficulty in definitively localizing observed effects to a single WM tract, especially in regions with complex fiber crossings. Future work could address this by applying more complex modelling techniques that consider fiber crossings, such as fixel-based analysis,64 to disentangle the contributions of individual fiber populations within a voxel and pinpoint the specific tracts driving the observed diffusion differences. We acknowledge that the repeated-measures design involving three separate time points is costly and difficult to implement. However, now that highly repeatable clusters have been identified, a future direction could be to use these locations as a priori regions of interest. Validating these specific regions in a new, larger cohort may only require one or two scans, leveraging the knowledge gained from this longitudinal design to create more efficient and targeted studies moving forward.
Conclusion
In this study, we introduce a longitudinal dMRI study design and analysis that prioritizes the repeatability of findings to investigate WM microstructural alterations in CLBP. Here, 11 regions were identified with differences in FA between CLBP patients and healthy controls that were consistent across 3 imaging sessions spanning four months. Lower FA in CLBP was found in 7 regions whereas higher FA was found in 4 regions. The primary contribution of this work is the demonstration that incorporating repeatability metrics directly into the analysis framework can substantially increase the reliability of results. Standard single-visit analyses revealed many significant clusters that were not stable across time, suggesting a high rate of chance findings. Our method effectively filters these spurious results by retaining only those regions that show both a significant group difference and high test-retest reliability. In future work, this cohort will be expanded to a larger, more representative sample, which will allow for more robust statistical testing and better generalization of these findings to the broader CLBP population. By leveraging longitudinal data to filter for repeatability, this methodology offers a path toward reliable and clinically meaningful biomarkers in chronic pain and other neurological conditions facing similar challenges of reproducibility.
Data and code availability
Data will be made accessible on openpain.org in 2026.
Ethical statement
This study was approved by the ethics review board of the Centre intégré universitaire de santé et de services sociaux de l’Estrie – Centre hospitalier universitaire de Sherbrooke (CIUSSS de l’Estrie – CHUS), Sherbrooke, Canada (file number: 2021-3861).
Funding sources
The authors declare the following funding sources: Fonds de recherche du Québec (#311042; 10.13039/501100020951); Arthritis Society (#21-0000000041; 10.13039/501100000142), Réseau québécois de recherche sur la douleur (10.13039/501100017033), and Réseau de Bio-Imagerie du Quebec (10.13039/100010571) to Pascal Tétreault; Canadian Institutes of Health Research (10.13039/501100000024) to Marc-Antoine Fortier and Fonds de recherche du Québec (10.13039/501100020951) to Graham Little.
AI use disclosure
Large language models were used to assist in the software development for this study (GitHub Autopilot, Chat GPT 4.1) with all output reviewed by an expert analyst (GL).
Conflicts of interest
The authors declare that they have no competing interests.