
Introduction
Adolescence, a period involving considerable neurodevelopment changes, is a stage of life when a number of major psychiatric disorders can emerge.1 Disorders such as depression, generalized anxiety, psychotic, eating, and substance use disorders are not uncommonly present during adolescence.1–5 While numerous neuroimaging studies have captured the neurobiological characteristics of these psychiatric disorders, there remains a considerable gap in our understanding of the pre-illness characteristics of the brain. Most studies recruit patients who are either prodromal, or those who have already developed their illness. Studies assessing the pre-illness characteristics of the brain are rare and yet are critical to understand early differences in neurodevelopmental trajectories and the interplay between brain and behavior over time.
One approach to assess the neurodevelopmental trajectories of emerging psychopathology is using large, longitudinal studies that recruit participants prior to the expected age-of-onset of the disorders.6 Examples of large pediatric datasets are provided in Table 1, including those datasets that are accessible for data sharing. Several of these studies now have up to four waves of neuroimaging data collection.7 The goal of these large studies is to capture a large, population-based sample of children and to study these children in multiple waves of data collection into adolescence and adulthood. The goals of these studies is to not only map typical neurodevelopment, but to assess deviations from typical neurodevelopment as a result of adverse exposures or psychiatric illnesses. Studying these individuals well past the median age of onset for major psychiatric disorders offers the opportunity to map the temporal characteristics of emerging psychiatric disorders. These studies are critical for enhancing our understanding of whether the neurobiological features are causal or predictive of the psychopathology, or alternatively, are downstream features of having the disorder.8,9
These existing and ongoing studies can be used to apply a wide array of longitudinal models to test brain/behavior relationships during development.27 Such models offer the opportunity to test both linear and nonlinear deviations of developmental trajectories, delays in development, and time-variant relationships between brain, behavior, and other variables.27 In fact, since there are multiple statistical models that can be applied to assess brain/behavior relationships over time, one of the challenges is knowing whether the selected model has internal validity to detect specific brain/behavior relationships. As an example, we now have several studies that utilize cross-lagged panel models to assess the bidirectional relationship between brain and behavior.8,9,28,29 Interestingly, rather than demonstrating that brain predicts downstream behavior, which was our original hypothesis, we found that behavior predicts downstream brain changes. However, had we used linear mixed models with the hypothesis that brain predicts behavior, we would have missed the alternative hypothesis. Simulated datasets, where the true direction of the brain-behavior relationship is known, will allow researchers to test whether cross-lagged panel models or linear mixed models more accurately recover the ground truth under different conditions.
Neuroimaging studies have at times been challenging due to small sample sizes, small effect sizes, and the considerable noise, variability, and heterogeneity of the study results. These factors contribute to the mixed findings in the literature.30,31 However, even with the availability of large samples for neuroimaging studies, we often lack the ‘ground truth’ involving the longitudinal interplay between brain and behavior in neurodevelopmental disorders. While pre-clinical and replication studies can help clarify the internal validity of specific neurodevelopmental models, factors such as the extension of animal models to humans, the limited number of large longitudinal datasets of child development, the differences in variables that have been collected, and questions surrounding generalizability between study populations can limit the interpretation. Within this framework, one additional approach to assess brain/behavior relationships is through the creation of simulated datasets that offers the opportunity to test data generated under different assumptions and to model which approach best reflects real-world data.
Simulated datasets have, by definition, a known ‘ground truth’ and can be modeled to include both causal and predictive relationships. Even though simulated datasets have a priori assumptions that may or may not accurately reflect the actual brain/behavior relationships, they are an underused approach to assess whether longitudinal models can accurately measure different longitudinal trajectories of the interplay between brain and behavior. Furthermore, when actual longitudinal datasets with multiple waves become available, the different variables that are entered into the models, including the characteristics of missing data, demographic features, and clinical measures can be tweaked until they reflect the actual data, and can then be tested to predict outcomes in independent datasets.
To enhance our knowledge of longitudinal modelling of large studies of child development, we recently created a consortium of five sites across three continents to independently simulate and share 15 large longitudinal datasets.32 Each of the five sites created three datasets, each containing 10,000 individuals. The age range of each dataset spanned the ages of 7 to 20 years with two-year intervals and a total of 7 waves per dataset. The instructions provided to each site was that they were to create the simulated datasets based on how they believe brain development, behavior, and the interplay between brain and behavior occurs over time.32 The brain measures consisted of five regions that are typically derived from structural MRI (total gray matter volume, total white matter volume, intracranial volume, and volumes of the hippocampus and amygdala). In addition, we also included frontal lobe cortical thickness. Measures of behavior consisted of three subscales from the Child Behavior Checklist (CBCL) (internalizing, externalizing, and attention problems scale) and a discrete measure of a diagnosis of autism spectrum disorder (ASD) (see Table 2). With the exception of the ASD diagnosis, brain and behavior measures were time varying, offering the opportunity for earlier datapoints to influence later datapoints, both within and between the brain and behavior domains.
The simulated datasets were independently created, without discussion between the groups regarding the assumptions built into their simulated datasets. Many of the studies modelled specific baseline characteristics from existing longitudinal studies, including the Adolescent Brain and Cognitive Development (ABCD) Study,10 the “Hjernens Udvikling hos Børn og Unge” (Brain Maturation in Children and Adolescents, HUBU) study,33 or using brain growth data combined from many existing studies.34,35 The data and code to generate the datasets are freely available at https://github.com/SoCoDeN/Simulation. An advantage of having multiple groups independently simulate large datasets is to limit inherent biases based on underlying assumptions within the different groups. If a single group both simulates datasets and subsequently uses these datasets to test different models, there is the possibility for circularity in the design and analyses. This is limited by multiple independent groups being blinded to how other groups creates the simulated datasets. However, there is a balance to the a priori creation of boundary conditions for the simulated variables, versus allowing the groups to have flexibility in their modeling approach.
The primary goal of this paper is to assess the epidemiological, demographic, and brain and behavior trajectories of these 15 simulated datasets and to assess how well each dataset meshes with actual human-subjects data. In addition, we determined how each dataset dealt with missing variables. Missing data can be clustered into categories of missing completely at random (MCAR), missing at random (MAR), or missing not at random (MNAR).36 An additional goal was to generate and compare developmental trajectories of internalizing, externalizing, attention problems, and each of the six brain measures (Table 2) from 7 to 20 years-of-age. The neuroimaging datasets were compared to actual neuroimaging data published by the ENIGMA Lifespan data project34,35 to assess how well each simulated neuroimaging dataset reflected actual longitudinal trajectories. Finally, an additional goal was to assess sex-based differences in neurodevelopmental trajectories.
Methods
Simulated Subjects
The data for this study encompasses simulated demographic, behavioral, and neuroimaging variables from a multi-site study of brain development.32 In this study, five different groups across three continents independently simulated datasets based on their hypotheses of the longitudinal interplay between brain and behavior. Each group created three longitudinal datasets, with each dataset containing 10,000 individuals and seven waves of data beginning at age 7 years up to 20 years-of-age in two-year increments. The simulated datasets contained up to 20% missing data. In total, the dataset includes 150,000 individuals and seven waves of data and is freely available through the Open Science Foundation (OSF) via the following link: https://osf.io/yjt9p/ . We analyzed each of the 15 datasets individually.
Variables
All fifteen datasets contain the same select group of variables as described in Sadeghi et al.32 The demographic variables include age, sex and parental education, with the latter having four categories (Table 2). Cognitive and behavioral measures include IQ, a binary classification of autism spectrum disorder (ASD), and three measures from the child behavior checklist (CBCL),37,38 namely raw scores for the internalizing, externalizing, and attention problems subscales. While the CBCL has been designed for ages 4 to 18 years of age,37 The CBCL was also used for the seventh wave (19 to 20 years-of-age) to enhance continuity. Extending the age limits slightly around transition zones has been used in other studies to enhance continuity.39 Six neuroimaging measures were defined, including the global measures of intracranial volume (ICV), total gray matter volume (GMtot), total white matter volume (WMtot) and subcortical regions, including the hippocampus and amygdala. Finally, longitudinal measures of cortical thickness of the frontal lobe was provided for each individual. A description of the demographic variables, percent missing data, and the prevalence of ASD for each dataset are shown in Table 3.
Statistical Analyses
Missingness: Although some of the groups provided information regarding how missingness was modeled within each of the datasets, we utilized a consistent approach for all datasets. This involved first assessing the total number and pattern of missing data; using Little’s MCAR test40 to assess whether the datasets fitted a pattern of missing completely at random (MCAR); and for those datasets which did not fit the pattern of MCAR, further assessments were performed to see if the data was missing at random (MAR) versus missing not at random (MNAR). These further assessments were performed by using multiple linear regression to assess whether missingness was associated with sex, parental education, CBCL score, using the highest CBCL externalizing score for each individual across all seven waves. In addition, assessment of attrition or dropouts were evaluated. In the Supplementary Figures 1 through 9, four of the subfigures (B,C,E, and F) were created using the python package ‘missingno’ (https://360digitmg.com/blog/missingno).
Behavioral and Neurodevelopmental Trajectories: Longitudinal trajectories for the three continuous behavioral measures (CBCL internalizing, externalizing, and attention problems scores) and the six brain measures were created using R version 4.3.1 (‘Beagle Scouts’). Linear mixed models were performed using the python package ‘mixedlm’ with subject ID as the random variable and sex, educational status, and IQ as fixed variables. A sex by age interaction model was also included. Finally, to illustrate the trajectories of sex differences, a sliding window analyses was performed across the age spectrum assessing effect size measures of the behavior and brain measures between males and females. The sliding window analyses had one month incremental steps and averaged over a window of ± 12 months.
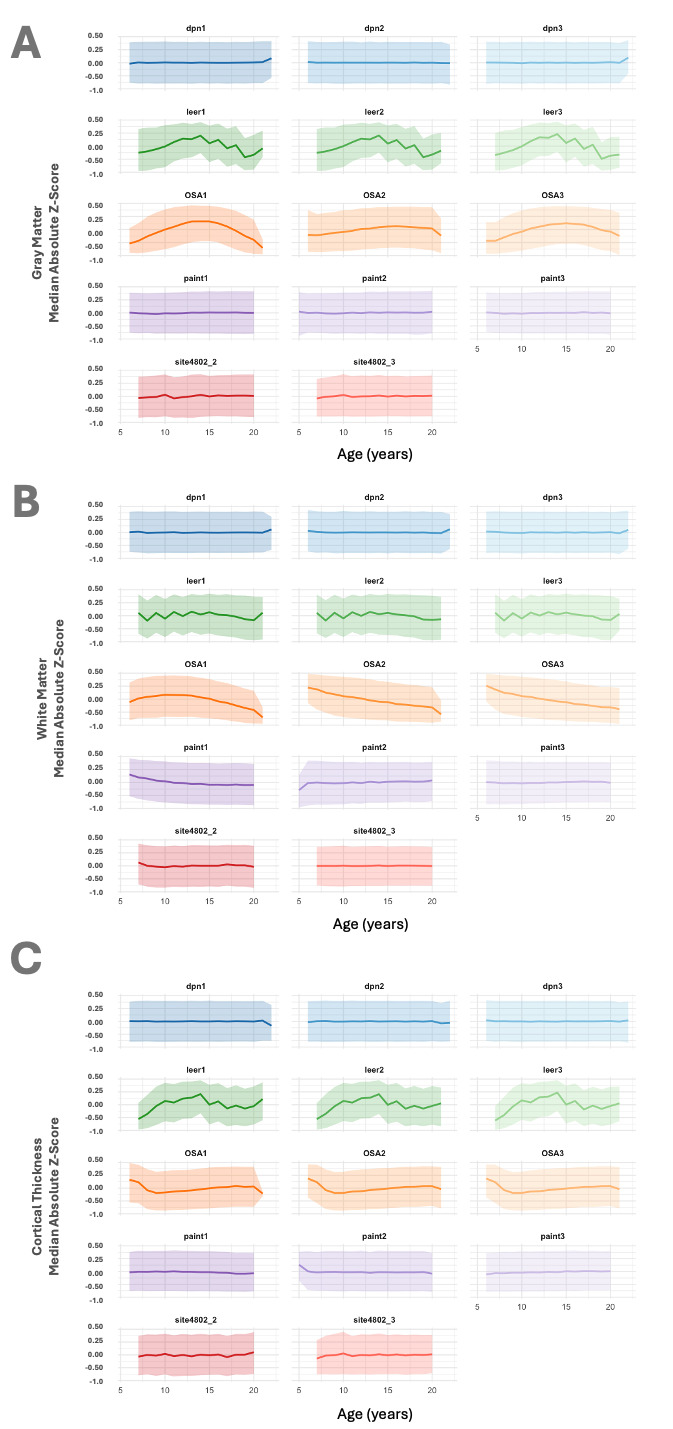
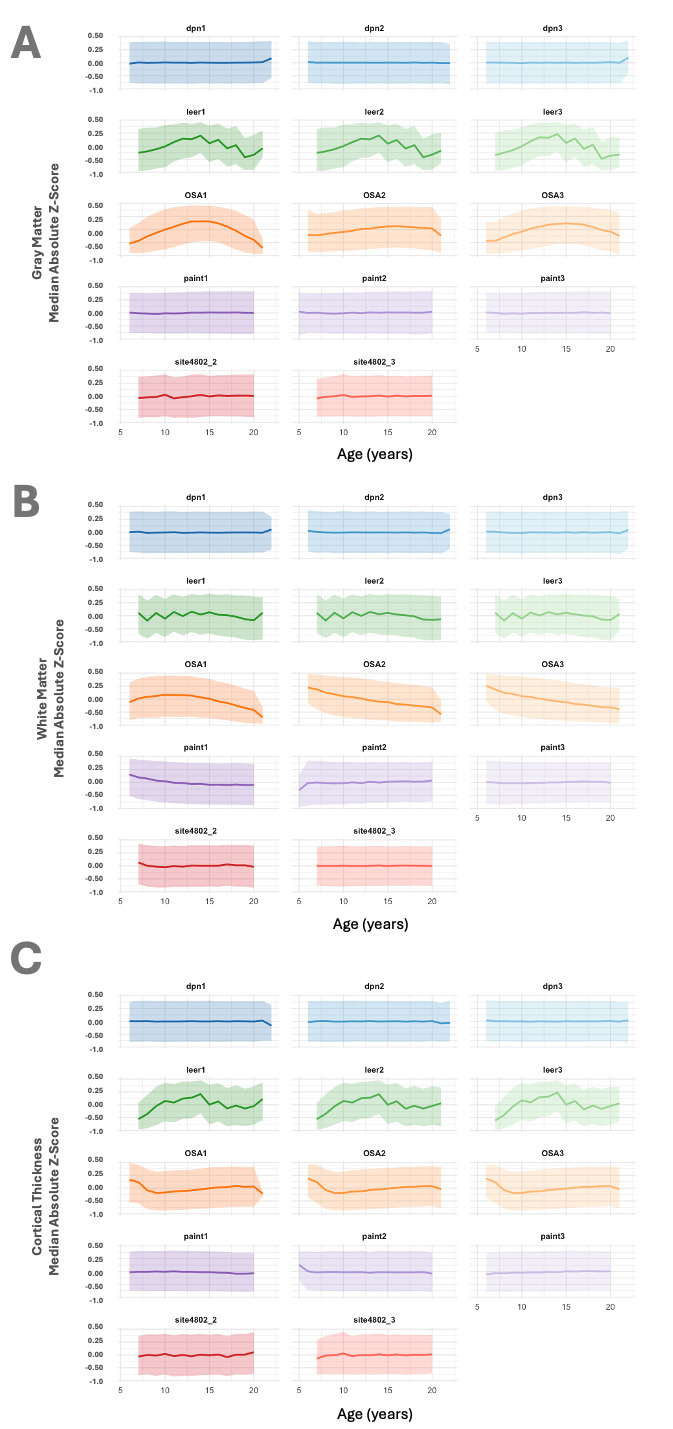
To assess how the datasets meshed with actual human-subjects MRI data, each of the datasets were compared with the ENIGMA Lifespan dataset.34,35 Several steps were followed in order to perform this comparison. First, the simulated datasets were restructured to a format compatible with the BrainChart App, which is a web based shiny app (https://brainchart.shinyapps.io/brainchart/). Second, the simulation data for each site was uploaded to the BrainChart App. Since BrainChart has data from both clinical and population-based studies, we compared our data in the BrainChart App with typically developing or population-based studies or participants. The App calculates an age-normalized percentage for each individual. Third, the age-normalized percentages were downloaded for each individual from the BrainChart site. Fourth, we performed a z-transform on each individuals percentile score and calculated the median value and converted this median into a z-score. We then calculated the absolute value of the z-score. This score, one for each dataset, reflects the median distance away from the 50th percentile line from the ENIGMA lifespan trajectory. A score of zero would reflect identical medians across all ages for the simulated and the ENIGMA dataset. A score of 1.0 would reflect that over half of the age-related datapoints have a standard deviation of 1.0 away from the ENIGMA dataset. Note, this does not reflect the direction of the deviation away from the ENIGMA lifespan dataset.
There were a total number of 270 statistical tests performed (18 per dataset), including main effects for sex and interaction effects. Multiple testing correction was performed for all 270 tests using both the conservative Bonferroni approach as well as the false discovery rate (FDR) using the Benjamini-Hochberg41 method. All analyses were performed using either python version 3.11.4 or R version 4.3.1 (‘Beagle Scouts’) and the code to perform all analyses are freely available on GitHub, https://github.com/SoCoDeN/Simulation.
Results
Based on the primary aims of the study, we evaluated demographic and clinical characteristics, missing data, the distributions of the CBCL domains, and how well the neuroimaging trajectories meshed with actual neuroimaging data.
Demographic and Clinical Characteristics
The characteristics for sex, parental education, and IQ are shown in Table 3. In most clinical populations, diagnoses of ASD are three to four times higher in boys compared to girls.42 Two of the sites reflected this ratio; the male to female ratio from the three datasets at the dpn site ranged from 3.3:1 to 4.2:1. The male to female ratio from the three datasets at the OSA site was 4.6:1. Two sites, paint and site4802 had male to female ratios of ASD that ranged between 1:1 and 1.2:1. The leer site was oversampled for females with autism, having ratios ranging from 1:30 to 1:50 males to females. Finally, site4802 had three datasets with nearly equal numbers of males and females with ASD (Table 3). Thus, all three datasets from site4802 are clinic datasets rather than population-based datasets, which can have a dramatic influence on the trajectories.6,13
Missingness
The frequency and type of missingness for each dataset is presented in Supplemental Table 1. In addition, the characteristics of missing for each dataset are provided in Supplementary Figures 1-9. Except for one dataset (paint_data3), the amount of missing data for both the CBCL and the neuroimaging data remained relatively constant over the nine data collection waves (Supplementary Figure 10). Six of the datasets had no missing data, three datasets had data that were missing completely at random; six of the datasets failed Little’s MCAR test and were thus either MAR or MNAR. Linear regression analyses comparing individuals with missing data based on sex and parental education resulted in no significant associations (Supplemental Table 1). Two datasets (OSA_data2 and OSA_data3) had data that were considered MAR, since higher rates of missingness were significantly associated with greater externalizing (β=-0.032, t=-17.8, p<0.0001), internalizing (β=-0.033, t=-17.2, p<0.0001), and attention problem scores (β=-0.09, t=-17.5, p<0.0001). The other three datasets were labeled MNAR (Supplemental Table 1). There were few complete dropouts until the 5th wave, when there was increasing numbers of attrition in the datasets containing missing data (Supplementary Table 2).
Supplementary Figures 1 through 9 provide information regarding missing data and dropouts for each of the nine datasets with missing data. Each of these 9 Figures contain five subfigures that provide an overview of the characteristics of missing data for that specific dataset. The first subfigure (A) in each figure is a histogram providing the number of missing data per individual. The second subfigure (B) demonstrates the number of missing data per variable. Subfigure C shows a correlational heatmap indicating the relationship between missing variables; Subfigure D provides a matrix with participants and waves along the y-axis and the variables along the x-axis, which demonstrates patterns of missingness. Finally, subfigure E is a dendrogram demonstrating the hierarchy of the missing values for each dataset.
Behavioral Trajectories and Sex Differences
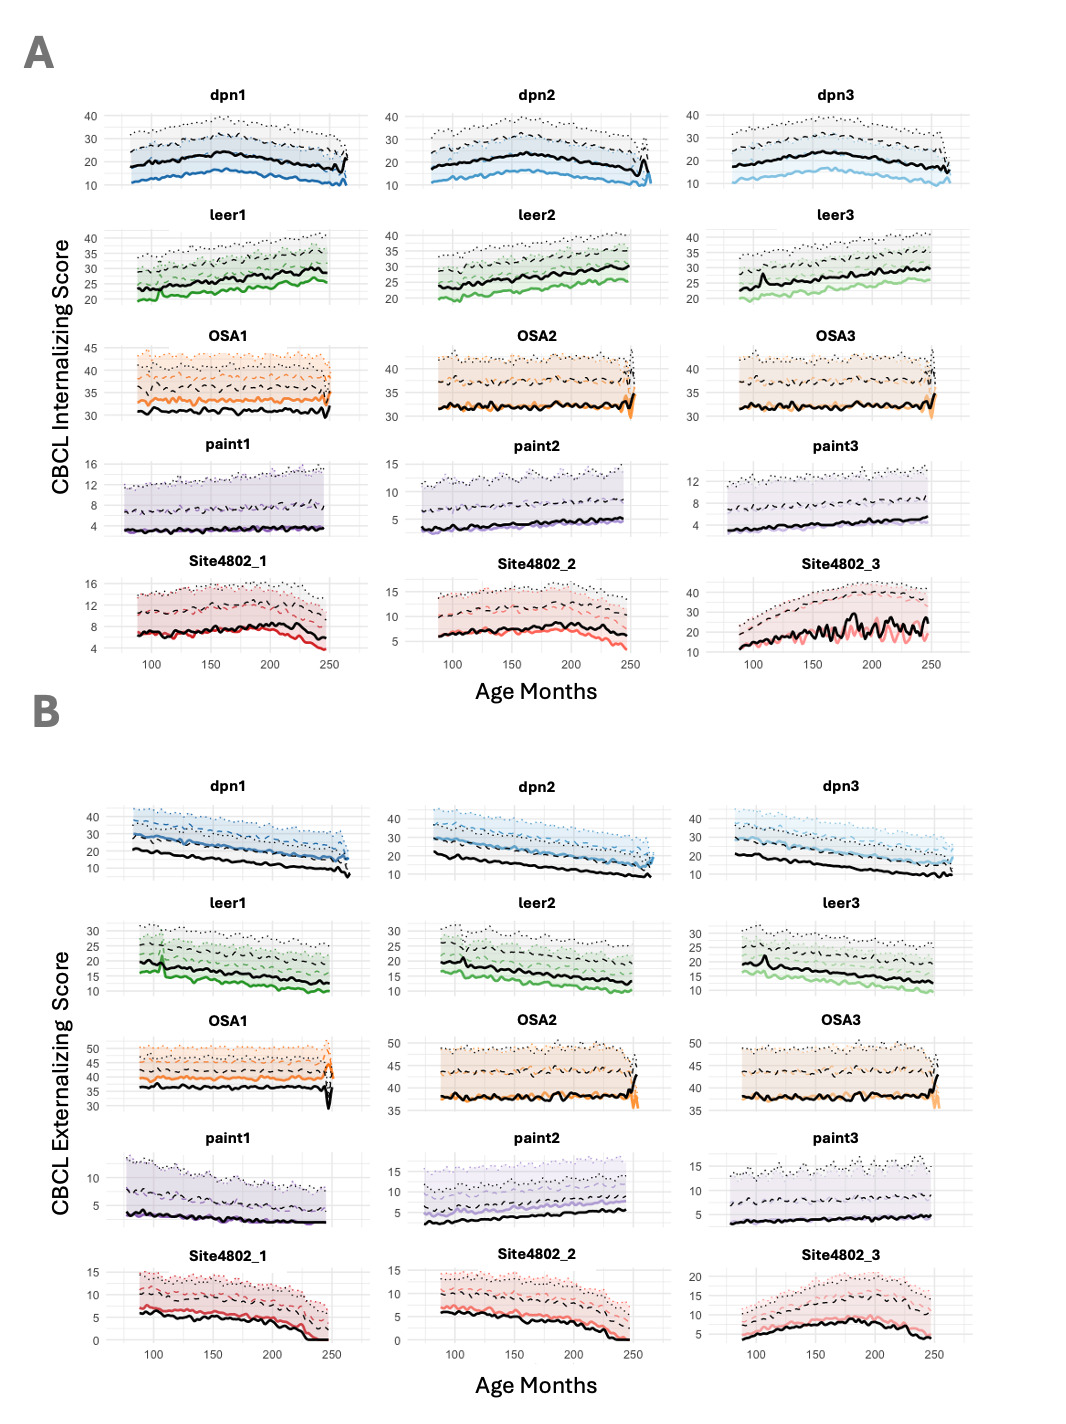
The CBCL measures for internalizing, externalizing, and attention problems demonstrated different developmental trajectories and distributions (Figure 1). The internalizing scores either remained relatively constant over the age range from 7 to 20 years-of-age or consisted of inverted U-shaped trajectories. The CBCL externalizing and attention problems scores showed a different pattern in contrast to the internalizing domain, being either relatively constant or showing on-average decreasing problems over time.
_median_in.png)
Results of the linear mixed models for main and interaction effects of behavioral measures with sex for each dataset are shown in Tables 4 and 5, respectively. Most datasets modeled females as having significantly greater internalizing symptoms (dpn, leer, and paint datasets 2 & 3), whereas the other showed either no difference (OSA datasets 2 & 3 and Paint dataset 1) or greater internalizing symptoms in males (site4802 and OSA dataset 1). The datasets from two sites, paint and site4802 modeled sex by age interactions with internalizing symptoms, with all but paint_data1 showing females having greater internalizing symptoms with age (Table 5).
Externalizing symptoms were significantly greater in males for the dpn and site4802 datasets, as well as paint_data2. Leer had greater externalizing symptoms in females, and the remaining (OSA datasets 2 & 3 and paint datasets 1 & 3) showed no sex differences (Table 4). The interaction effects were more subtle, with greater symptoms over time in males in the leer datasets, and less in the dpn datasets, and in the paint_data3 and site4802_data1 datasets. Finally, main effects related to the attention problems score tended to parallel the externalizing symptoms scores (Table 5). The interaction effects of sex with age show no effects at the dpn site and OSA data 1 & 2, increasing attention problems in males at with the leer and paint_data1 datasets, and decreasing over time in paint data2 and data3 and site4802 1 & 3 (Table 5).
Brain Growth Trajectories and Sex Differences
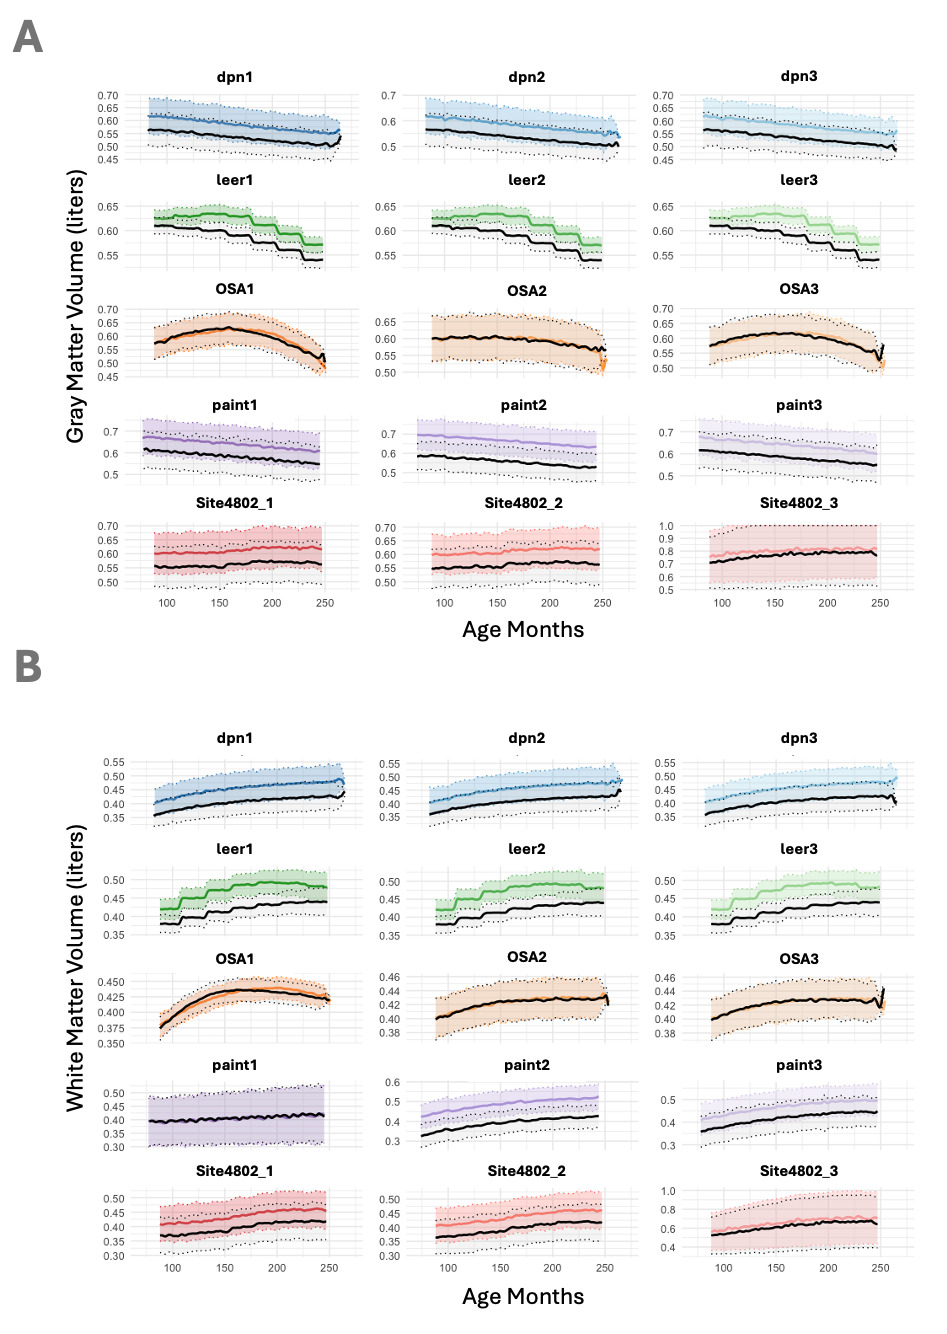
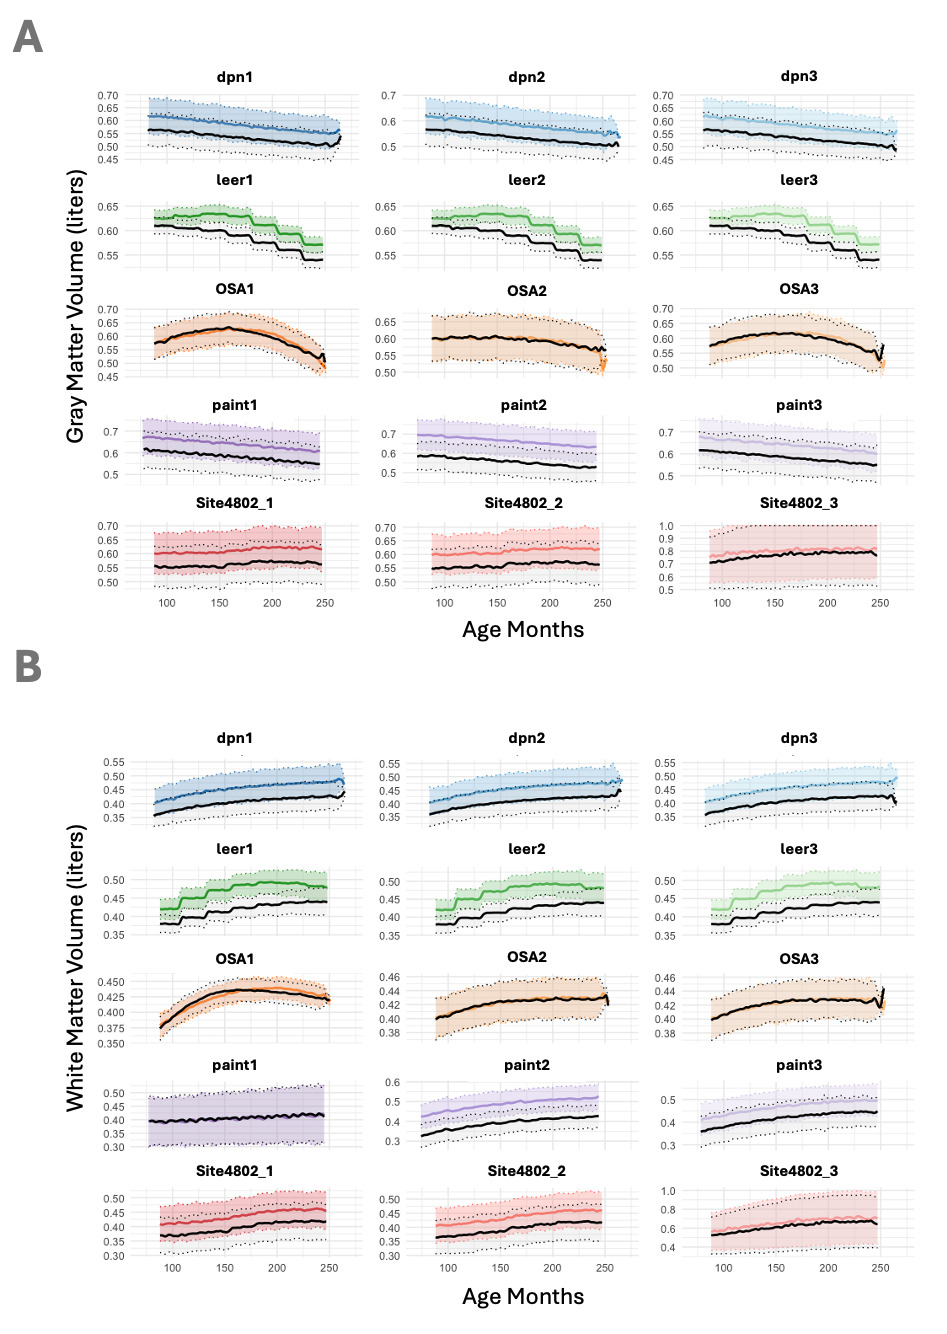
Different model assumptions were used to generate the neurodevelopmental trajectories for behavior over time (Figure 2). The most consistent pattern across all datasets was seen in total white matter volume, which demonstrated non-linear increases with several datasets reaching a plateau before the age of 20 years (Figure 2-B). Total gray matter volume (Figure 2-A) and frontal lobe cortical thickness (Figure 2-E) decreased with age in most datasets, although gray matter volume also showed inverted-U and non-linear increases. In most datasets, volumes of the two subcortical structures, the hippocampus and amygdala increased to approximately 17 years, whereafter they show differing levels of decreasing volume (Figure 2-C & D).
The fit metrics for gray matter, white matter, and cortical thickness for each of the datasets are presented in Table 6 and demonstrated visually per year in Figure 3. Three sites (dpn, paint, and site4802) showed excellent correspondence to the lifespan growth curves. The other two sites, while having reasonably good fit metrics (Table 6), demonstrated non-linear fits at the lower and upper ages.
Nearly all datasets had highly significant main and interaction effects with sex (Table 4). Regions that were significantly larger in males at all sites included the ICV, hippocampus, and the amygdala (see Supplemental Table 3 for main effects and Supplemental Table 4 for age/sex interaction effects). Gray and white matter volumes were larger in males in all sites except the OSA site (Supplemental Table 3 & Figure 3-A). One approach to assess longitudinal trajectories of sex differences is comparing effect size differences of brain regions across age.43 This approach was performed for all imaging features in each of the datasets and are shown in Supplementary Figure 11. Within the OSA site, females had significantly larger volumes in datasets 1 & 3 and no difference in dataset 2 (Supplementary Figure 11). The greatest main effects for sex were seen in frontal lobe cortical thickness measures, with no sex differences in either the dpn site and paint datasets 1 and 3; smaller cortical thickness in females in the OSA datasets, and larger cortical thickness in females in site4802 and paint 2 datasets (Supplementary Figure 11 & Supplemental Table 3).
Discussion
Considering that the simulation data contained only six structural neuroimaging measures, four behavioral measures, age, sex, parental education, and IQ, these 14 variables are orders of magnitude smaller than the vast number of variables collected in typical longitudinal population-based studies.10,13 Yet even with this small number of variables, we found both similarities and differences in how groups modeled the brain and behavior trajectories. These differences translated into mixed results between studies, such as the differences for main and interaction effects of sex with brain and behavior. In addition, each group applied different models for missing data and utilized different distributions for the behavioral measures. Understanding how the different groups modeled the data can help determine the underlying assumptions related to neurodevelopmental processes, especially since these assumptions likely will influence how groups analyze real-world data.
Neuroimaging Measures
While there was also some variability in the trajectories of brain morphology, many of the curves did approximate those found in the literature.34,44,45 Cerebral gray matter volumes typically demonstrate an inverted ‘u’ shape curve, with a gradual increase in volume up to early adolescence, followed by a gradual decrease.34,46 Two of the groups (leer & OSA) modeled trajectories with a u-shaped curve, whereas the other three tended to have a linear decline (Figure 2-A). Studies have shown that during childhood and adolescence, total white matter volume tends to demonstrate a gradual increase and hippocampal and amygdala volumes tend to increase into adolescence and reach a plateau.22,34 These patterns were overall reflected in the simulated datasets (Figure 2-B,C,D). Frontal lobe cortical thickness demonstrated a gradual decrease with age in all datasets (Figure 2-F), which is consistent with the literature.45,47 Finally, many datasets showed trajectories that were very consistent with the ENIGMA Lifespan trajectories, even at sites that did not model their data using the lifespan data. The dataset that most diverged from the ENIGMA lifespan study was the case/control dataset with 50% of the population having ASD. Not surprisingly, datasets that modeled their curves using data that overlapped with the ENIGMA consortium datasets tended to show the best fit. One approach to create greater harmonization in simulated datasets would be for the different sites to agree a priori not only on the actual datasets used for the simulations, but also to have consensus regarding the study population (i.e., population-based versus case/control designs), and the prevalence of clinical diagnoses.
The sex-based differences in volumes did show considerable variability between the different datasets (Supplementary Figure 11). Longitudinal measures of effect sizes between males and females between 7 and 20 years-of-age were relatively constant in nine of the datasets, with males showing greater volumes and effect sizes varying from small to very large between the studies. While both constant and age-dependent differences in brain volumes between males and females have been reported,35,48–50 a recent meta-analysis found that global effect size differences to be on the order of 2.1.50 Six datasets showed non-linear changes of effect sizes, with the leer datasets, showing inverted-u shaped curves for effect sizes for both total gray and total white matter volumes. These measures showed an increase in volumes in boys up to mid-adolescence, followed by a decline. The hippocampus showed an increase up to 180 months after which there was a plateau (Supplementary Figure 11-C). The amygdala volume was considerably larger in boys up to 140 months, where it decreased thereafter. Frontal lobe cortical thickness was not different across the age range in 12 of the 15 datasets, with the leer datasets showing females have a greater than one standard deviation larger cortical thickness (Supplementary Figure 11-F).
While numerous neuroimaging studies have captured the changes and differences in those who develop psychiatric disorders, there remains a gap related to the pre-illness characteristics of the brain. Behavior is inherently driven by the brain, but using our existing neuroimaging approaches does not immediately translate into our ability to detect the underlying neural processes and the location of these processes using our existing neuroimaging tools. For example, evidence from several studies has shown that whereas cross-sectional baseline brain/behavior relationships were not present, it was the presence of the behavior at baseline that predicted downstream brain changes, rather than the opposite.8,9,28,51 Thus, the presence or persistence of certain behaviors at an earlier timepoint, even those that are problematic, could result in downstream brain changes. These changes could be due to Hebbian processes or other factors inherent in neuroplasticity. It’s not that the brain-based differences at baseline were not present, but rather, they were not able to be detected using the current neuroimaging technology.
Behavioral Measures
Trajectories of the mean levels of internalizing, externalizing, and attention problem behavior and the distribution of scores for each of the datasets are shown in Figure 1. These curves demonstrate the age-related median trajectories for each dataset. Studies have shown that internalizing symptom scores tend to be low to moderate leading into mid-adolescence, followed by an increase during mid-to-late adolescence, especially in girls, with a decline or plateau in late adolescence.37,52–55 We found this pattern to be reflected in several datasets (Figure 1-A1). Externalizing symptoms can be high during childhood in boys, followed by a peak in mid-adolescence for a subset of children, with an overall decline following childhood.37,54 Most of the datasets in our study reflected a gradual increase in internalizing symptoms with age and a gradual decline in externalizing and attention problems symptoms. Studies have found that attention problems tend to show an overall slow decline into late-adolescence in most, but not all children.56 Nine of the datasets showed patterns consistent with this trajectory (Figure 1-C1). While several datasets matched the overall mean pattern of behavioral traits, very few datasets modelled what would be considered expected sex differences in behavioral trajectories (Supplemental Figure 11 & Table 4). Finally, the CBCL tends to be highly skewed in population-based studies, however, only two groups (paint & site4802) modeled the distributions to fit a general pediatric population-based sample.
Missing Data
Missing data in longitudinal studies is common36 and in fact, a complete dataset is extremely rare, and nearly impossible in large longitudinal studies. Types of missingness have been classified into three different categories: missing completely at random (MCAR), missing at random (MAR), and missing not at random (MNAR).36,57 One advantage of simulating large datasets is the ability to titrate the type and amount of missing data to test different underlying assumptions. In our study, six of the simulated datasets had no missing data, and thus these datasets could be used to explore brain/behavior relationships without potential bias due to missing data. Little’s test40 categorized three datasets to be MCAR. Of the remaining datasets, two were defined to be MAR and four were MNAR (Supplemental Table 1). When comparing our findings to the description of how missingness was modeled in these datasets from Sadeghi et al.,32 the site4802_data1 dataset accurately matched the description of being generated completely at random (Supplemental Figure 9). However, three of the leer datasets were described as MAR, but were found using standard approaches to be MNAR. While Little’s test is commonly used to assess for MCAR, the test has been described as being both underpowered to detect differences for small numbers of variables and when applied to variables have a lower covariance structure,58,59 which may have mislabeled these datasets. Since approaches to account for missing data, i.e., imputation, do not greatly influence the primary predictors of interest,58 we accounted for missing data to assess the differences in trajectories between sex using and behavior and brain trajectories listwise deletion.
Supplementary Figures 1 through 9 provide a graphic overview for the nine datasets with missing data and could be used to assess longitudinal population-based studies. When a complete wave for a subject is missing, for example when a participant does not show up for the visit, then all behavior and imaging data will be missing for that wave. This would result in high correlations within and between all imaging and behavioral variables in the correlation heat map of missing, horizontal lines in the matrix pattern of missingness, and a collapsed dendogram (Supplementary Figures 1-3). When there is a combination of both missing waves and participants deciding not to take part in the neuroimaging component, there is a drop in the correlation between the brain and behavior measures, less horizontal structure in the matrix pattern of missingness, and clusters within behavior and imaging in the dendogram (Supplementary Figures 4-6). Finally, data missing completely at random results in zero correlation in the heatmap of missingness, random structure of the matrix pattern of missingness, and little clustering within the dendogram of missing values (Supplementary Figure 9).
Strengths and Limitations
While the considerable variability on some measures between the groups is a weakness of the study, this could also be considered a strength. One of the challenges of simulation is circularity, meaning the same site that creates a simulated dataset uses a specific statistical framework and subsequently the same model to test the predefined assumptions. Having five different sites generating data independently from the other sites offers the opportunity to test different assumptions related to the data models used and reduces the chance for circularity. However, it also increases variability between the datasets, which is what we found. With 15 simulated datasets, there are a vast array of relationships that could be assessed, which is one of the challenges. Approaches using multiverse-model interactions to simulate data, or data driven approaches such as deep learning models that try to learn the underlying structure of the data (e.g., Neural ODEs) could provide evidence for the number of false positives and the power necessary to achieve robust findings across different models.
An additional weakness of our study is that we assessed mean behavioral problems and did not parse clinical or subclinical scales within the internalizing, externalizing, and attention problem scores. Longitudinal analyses of behavior changes are typically much more extensive. For example, clustering algorithms, such as latent profile analyses or latent transition analyses can parse individuals into different groups and to assess changes within these groups, respectively.60 Using these approaches, most children are clustered into a ‘no problems’ group, whereas smaller groups of children fall into a problem behavior group, which is often also associated with cognitive deficits.61,62 However, as an example of the challenge, single publications have been written about sex effects of just the internalizing scale in one study with much smaller sample sizes and fewer waves.
Real-life studies have multiple variables that were not included with the simulation data. First, in real-life studies, harmonizing the different demographic, neuroimaging, cognitive, and behavioral data is not always straightforward. Many of these variables found in other studies were not included as additional variables in our simulated dataset. Second, many of these datasets have limited waves of data collection, different sampling techniques (i.e., longer periods between follow-up periods), and different study designs. Third, there can be varying levels of data quality and, especially in children, neuroimaging data is inherently noisy. Fourth, the simulation dataset did not specify a specific source for generating the data (i.e., FreeSurfer, FSL, SPM, etc.), which could infuse variability between the datasets. Fifth, whereas four of the sites assumed a population-based study, one site simulated a case/control study, making comparisons with this study more difficult. This may be the reason why this site, site4802 was least similar to the ENIGMA lifespan trajectories. Finally, whereas some large longitudinal neuroimaging studies have data sharing policies that easily allow researchers access to the data,10,18,23 whereas other datasets are more restrictive.63 Approaches to overcome these challenges is important, since high-quality replication studies are one key element to foster convergence on ‘ground truth’ relationships between brain and behavior. In parallel to acquiring and harmonizing longitudinal data, simulated datasets can be very valuable to lay the foundation for the selection of the best models to determine specific relationships are present between different variables.
Future Directions & Recommendations
There are a number of possibilities for future directions that can be taken to utilize simulated datasets to augment our understanding of neurodevelopmental trajectories, especially related to the interaction between brain and behavior over time. First, simulations performed iteratively, with each subsequent version tested as new waves of data become available from ongoing studies, such as the ABCD Study , would offer the opportunity to adapt the simulated models such that they can better reflect the actual data. This also offers the opportunity for researchers to evaluate their biases and assumptions, which are embedded into the simulated models which may or may not mesh with existing data. Having the independent groups meet to discuss their assumptions as a part of the iterative feedback loop could be very valuable. Meeting would be especially important to help determine the underlying assumptions within and between the groups, which can be both implicit and explicit assumptions.
While site-related differences in behavioral and neuroimaging trajectories support differences in the underlying assumptions, it does not necessarily extract exactly what those assumptions are, especially implicit assumptions. Thus, discussions among the group members regarding theories in modeling neurodevelopmental data can be beneficial to better understand the differing assumptions.64 To best understand the different assumptions, an iterative approach in developing simulation models from independent sites is recommended. Such an iterative approach would involve the creation of initial models, which is then followed by meetings and discussions among team members at the different sites to discuss the underlying assumptions and to then test those models that most represent the actual data. Additional variables could also be added to assess how the addition of these variables alters the predictive qualities of the models. One example is that the 3rd and part of the 4th wave of the ABCD Study has recently been released and an interesting question is whether simulated models, including implementing machine and deep learning algorithms, could be used predict subsequent waves.
One important future direction is to test different longitudinal statistical models using the simulated datasets to study longitudinal brain/behavior relationships of neurodevelopment.27 Simulated datasets offer the opportunity to modify or eliminate variables to assess changes to effect size estimates based on these changes. Since each of the longitudinal models have specific assumptions related to the underlying structure of the data, simulated datasets that are based on the neuroscience literature provide a controlled structure to help define and test different assumptions, such as the number of recruitment waves necessary to demonstrate changes using different longitudinal modeling approaches or if different longitudinal models should be combined in order to assess different elements of the brain/behavior interplay. The site differences identified in our study reflect different assumptions related to neurodevelopmental trajectories. Whereas our study focused on the realism of independently generated neurodevelopmental growth trajectories, we did not perform formal statistical analyses to test causal or predictive models of brain/behavior relationships. It is optimal to first demonstrate realistic simulations of neurodevelopmental trajectories prior to testing causal models. Further, while we compared the growth curves to large-scale ENIGMA lifespan trajectories, direct comparisons with other studies (i.e., the ABCD10 or Generation R Study13) may have slightly different results. Finally, simulation studies can help quantify the number of false positives and negatives, and to assess the influence of missing data.
Improvements in algorithms that assess and predict missingness, including the relationship between missing data and demographic and clinical variables would also be beneficial. Six datasets in our study had no missing data and thus missing data could be added to these datasets to assess how they alter the outcome. While having no missing data is beneficial to test models and is easily done in simulated datasets, it does not mesh well with actual longitudinal studies of child development. The limit of 20% missing data was likely an optimistic value in relation to actual longitudinal studies.58 That said some studies have very low attrition rates in some countries whereas other studies tend to have larger rates of attrition and it would be helpful to compare different studies on the rates of missingness and further to test how the missingness can interfere with outcome measures.
Finally testing and adapting to best approximate real data will provide better insight into the interplay between brain and behavior over time. The ultimate ‘ground truth’ test would be to alter some aspects of the temporal relationship within specific variables within the longitudinal simulated model while subsequently performing an interventional study in humans to show that the model can predict the outcome in actual human subjects studies.
Conclusions
The simulation of longitudinal datasets that embed assumptions regarding the interplay between brain and behavior is a valuable but underused approach to better understand neurodevelopment. It can help parse the incredible complexity inherent within neurodevelopment, although even with limited variables, it is humbling to consider the level of complexity that must be navigated. Consider additional variables in developmental studies that were not included in this study, such as adverse life experiences, parenting characteristics, school and peer relationships, bullying, and a myriad of additional behavioral and emotional problems and genetic susceptibilities. Simulation has many advantages, even for datasets with limited variables. Not only do simulated datasets provide the ground truth relationships between brain and behavior, where the causal relationship is known, they also offer the opportunity to test specific statistical models to determine best suited to identify specific relationships. We found that it is challenging for independent groups to create simulated datasets that have considerable overlap, even with a small number of variables. An optimal approach would first involve groups independently creating datasets, as was done in this study, but followed by the groups meeting to discuss the assumptions they used in modeling the data. This would be followed by an iterative approach with closed loop feedback, until the simulated data approximates real-world data. Finally, once simulated data approximates real-world data, variables in the simulated datasets could be altered to assess how downstream brain and behavior is changed. Using this information, it may then be possible to predict and test interventions.
Acknowledgements
This project was supported by the Intramural Research Program of the National Institute of Mental Health (ZIA MH002986).