
1. Introduction
The visual inspection of neuroimaging data is a standard component of modern neuroscience research. It is required at multiple stages of the research process,1 from initial quality control2 to the final interpretation of results,3 and must handle a wide range of data types, including volumetric images, surface meshes, and functional data. Many of these formats are unique to the domain. Likewise, there are many domain-specific visualization functions such as evaluating coregistration between images4 and statistical thresholding.3 Historically, many neuroimaging visualization tasks have been performed using general-purpose standalone desktop applications such as AFNI/SUMA,5,6 FSL/FSLeyes,7,8 FreeSurfer/Freeview,9 MRIcroGL/Surfice,10,11 MRtrix/MRView,12 and 3D Slicer.13 While these tools are widely used, they have notable limitations. First, because they rely on desktop graphics libraries (e.g., OpenGL), they cannot be embedded into browser-based environments such as cloud platforms, notebooks, or modern development environments. Second, complex, low-level dependencies often complicate their installation within various environments and limit usages in contexts requiring lightweight deployment processes, such as for teaching. Third, their general-purpose design often results in complex user interfaces that can be difficult to learn and make switching between tools cumbersome.
Our recent visualization package, NiiVue, addresses these challenges by leveraging web technologies14 and providing a modular and portable visualization component. This design allows the module to be embedded within user interfaces that are tailored to specific usage contexts, exposing only the controls required for a given task. We demonstrate how to integrate NiiVue into web applications and describe wrappers that enable NiiVue to be embedded directly into computational notebooks, desktop applications, and file browsers that are increasingly central to modern neuroimaging workflows.
Modularity is a long-standing strategy in software engineering for building a stable core that is decoupled from the context-specific components and parts likely to change.15 To fully benefit from a modular, web-based visualization component, it is essential to support deployment across the diverse environments in which neuroimaging researchers work. Modern workflows increasingly span integrated development environments, interactive notebooks, web applications, and desktop tools, each of which imposes distinct technical constraints and user interaction patterns and typically provides their own palette of user interface controls (e.g., buttons, sliders, drop-down menus). Rather than prescribing a single interface or workflow, NiiVue is designed to be wrapped and embedded in ways that allow it to integrate naturally into these contexts, while reusing a common, well-tested visualization core.
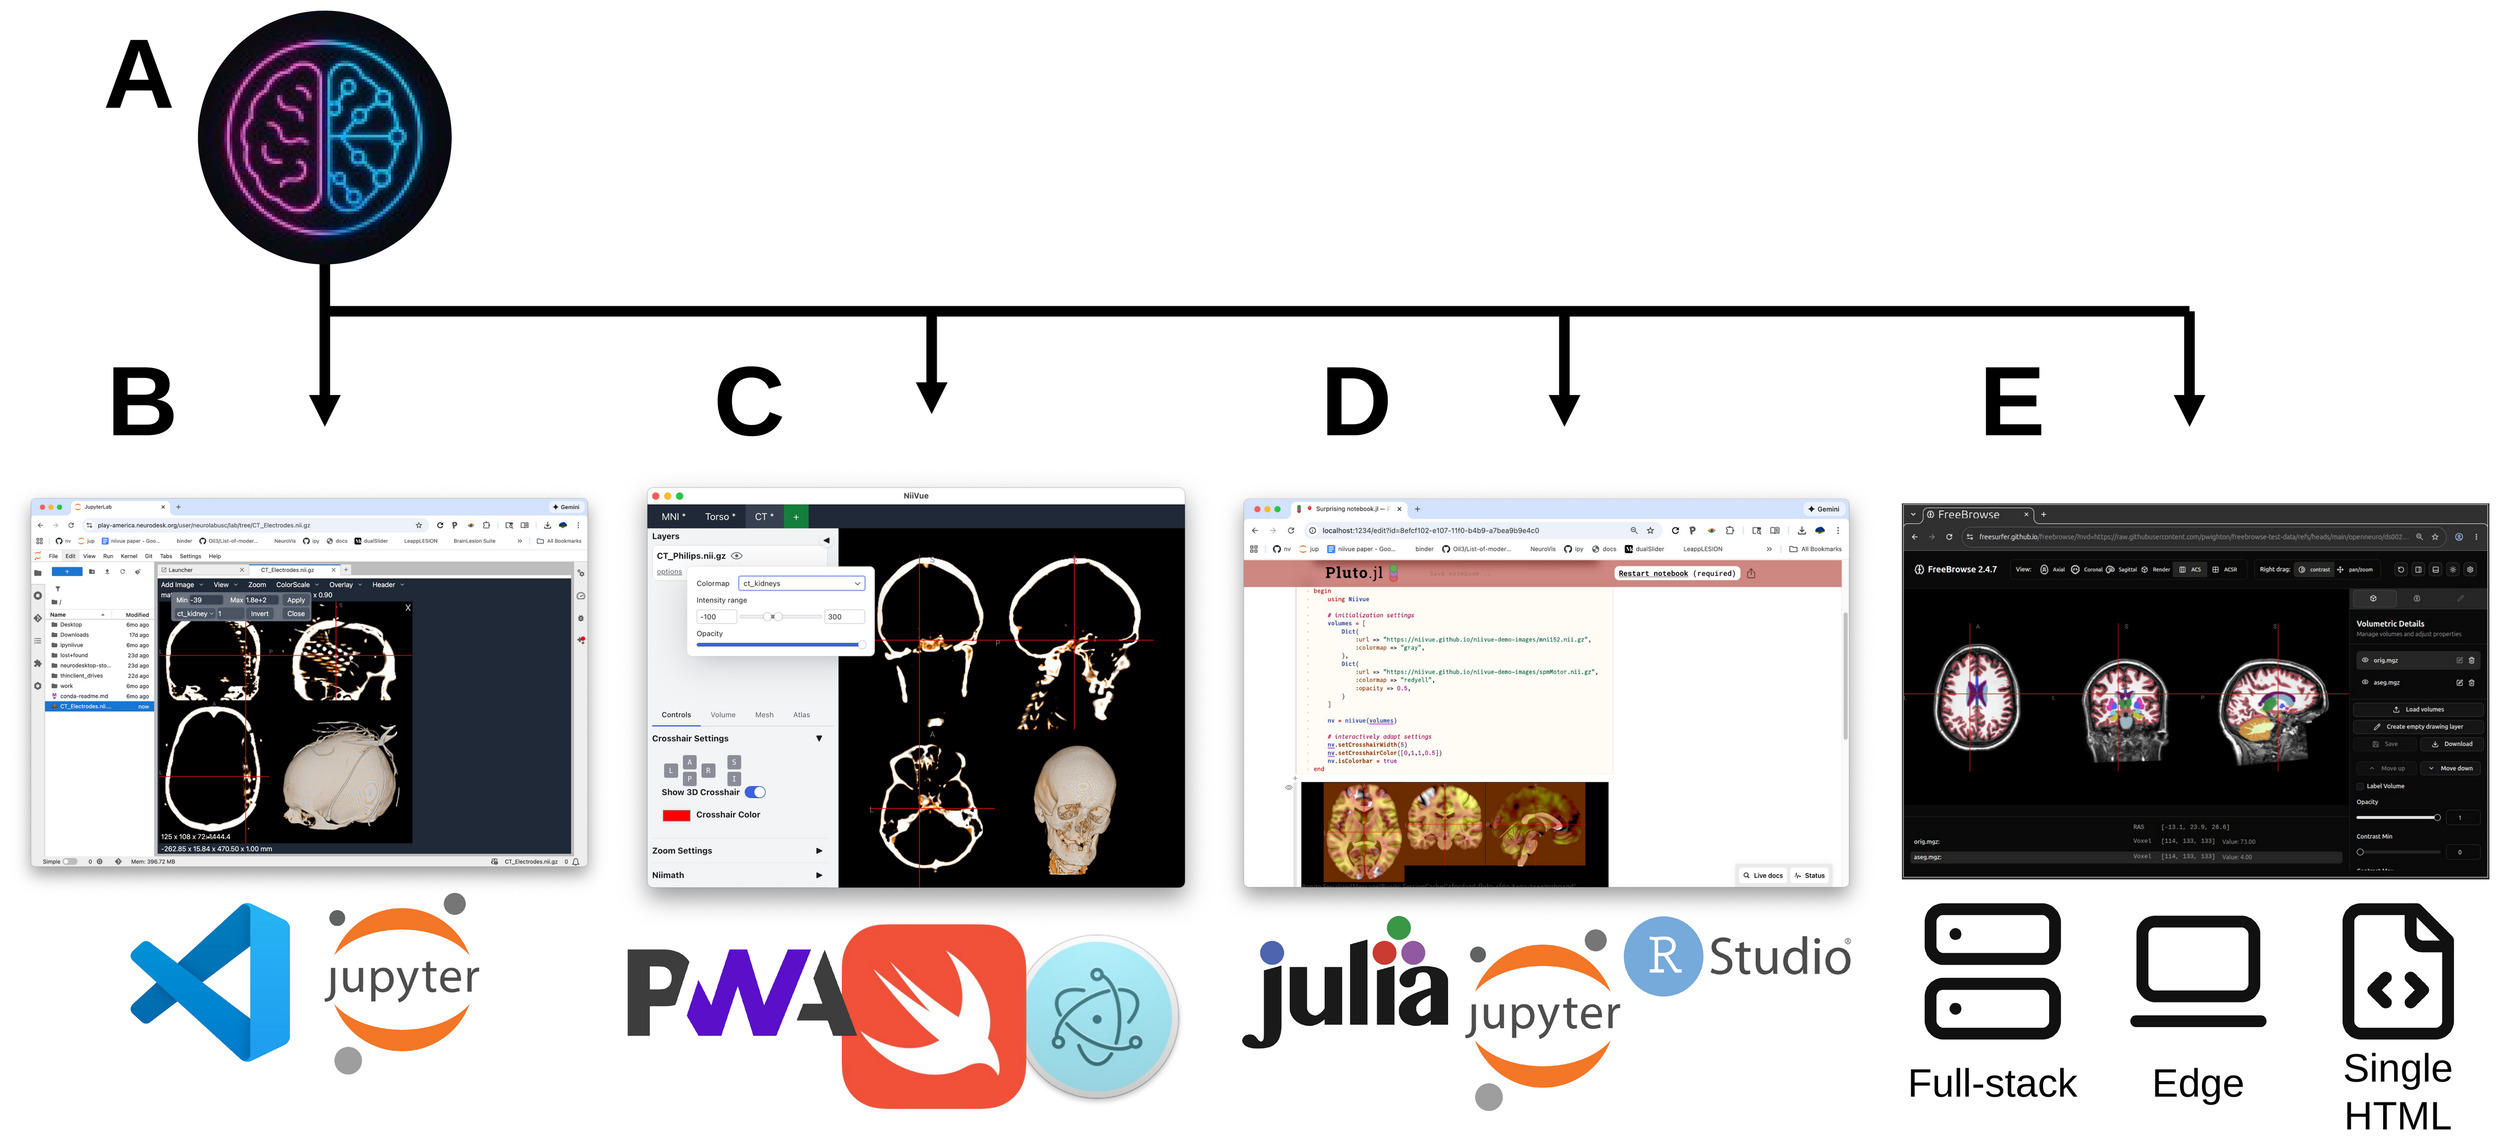
Figure 1 provides an overview of the deployment strategies described in this manuscript, illustrating how NiiVue can be extended through targeted wrappers to support file inspection in development environments, interactive visualization in web and notebook-based workflows, language-native access for Python, Julia, and R users, and integration into full-featured desktop applications. Together, these examples demonstrate how a single visualization engine can be adapted to meet the evolving needs of neuroimaging research without duplicating functionality or fragmenting user experience.
_is_a_modular__framework-agnostic_visualization_component_that_can_be_e.png)
Many popular neuroimaging workflows such as AFNI, FreeSurfer, MRtrix, and FSL were developed for workstation use, where command-line tools generate outputs that are then inspected in a separate desktop application. This approach disrupts analysis and prevents interactive exploration within the environment where computations are performed. Further, these approaches are not readily transferable to cloud-based workflows. Finally, each of these desktop applications relies on OpenGL, a legacy cross-platform graphics API that has been formally deprecated on macOS and increasingly superseded in modern graphics workflows by lower-level APIs such as Metal, Vulkan, and DirectX. This prevents embedding into modern web-based notebooks or cloud platforms and hinders reproducibility by making the visualization step difficult to script and archive alongside the analysis.
Recently, computational notebooks have become critical tools for reproducible research by interleaving code, narrative text, mathematical equations, and visualizations in a single, executable document.16 However, these environments traditionally lack integrated, interactive 3D neuroimaging viewers. Scriptable-visualization packages address part of this need: Python and R packages such as nilearn17 and ggseg,18 respectively, generate figures directly from scripted code interleaved with analysis, and libraries such as fslpy19 expose the data structures of established toolboxes to Python. Their output, however, is largely static, so changing a viewer setting requires editing the code and re-running it. Chopra and colleagues20 analyzed programmatic visualization tools for R, Python, and MATLAB (their Table 1) and showed that support for the common neuroimaging data types, voxel volumes, surfaces, regions of interest, connectomes, and streamlines, is split across many language-specific packages. Interactivity can be obtained by linking to a desktop viewer such as FSLeyes,8 but this relies on OpenGL, so it cannot be embedded in a browser-based notebook and does not run on headless services such as Google Colab. Interactive visualization and scripted analysis therefore remain largely separated.
NiiVue unifies this approach by providing a single, embeddable engine that can display these representations together and across environments. It is a browser-based neuroimaging visualizer that displays the principal data representations of the field, including voxel-based volumes, surface meshes, tractography streamlines, and connectomes, simultaneously within a single scene. Its architecture, supported data and file formats, and rendering model are described in Section 2.1. NiiVue comes with built-in rendering shaders, font typefaces, and colormaps designed to be robust for color vision deficiencies,1,21 which provides a consistent baseline across deployments, though custom resources can also be installed for special situations. Its browser-native architecture makes it portable across operating systems and devices, and performant through its use of hardware-accelerated rendering. Earlier browser-based viewers such as SliceDrop,22 BrainBrowser,23 NiftyView,24 and Papaya25 predate modern web-based rendering, such as WebGL2 and WebGPU, and tend to show a single representation at a time (e.g., volume, slices, or a 3D rendering), which forces a trade-off between the precision and interpretability of the resulting image1; NiiVue instead displays multiple representations simultaneously.
NiiVue can be integrated idiomatically into the environments where researchers work. A programmer working in Python or Julia can configure it with simple commands inside a notebook, while a user of an editor such as VS Code or JupyterLab can open neuroimaging files directly in an integrated viewer. These modes are complementary rather than exclusive: the same user may access NiiVue when browsing files, while also using it inside computational notebooks.
Modern neuroimaging workflows span a wide range of computational environments, from integrated development environments and interactive notebooks to traditional desktop applications, yet visualization capabilities are often fragmented across these contexts. To address this heterogeneity, we present an ecosystem of tools built around a shared NiiVue visualization core that can be deployed in forms tailored to distinct usage patterns. Specifically, we describe four complementary approaches. First, integrated visualization extensions integrate visualization directly into development environments, enabling in-place inspection of neuroimaging data at the point of access. Second, standalone applications provide varying levels of desktop integration, ranging from lightweight web-based deployments to fully featured native and cross-platform viewers. Third, language bindings expose NiiVue programmatically within Python, Julia, and R workflows, allowing interactive visualization to be embedded directly alongside analysis code. Finally, traditional web applications allow NiiVue to be integrated with specific data repositories via full-stack deployments or with a user’s local data in edge-based deployments or even as a single self-contained HTML file. Together, these approaches demonstrate how a single, modular visualization engine can support consistent neuroimaging visualization across the diverse environments that characterize contemporary research practice.
2. Methods
The primary aim of this work is not to introduce a collection of independent visualization tools, but rather to present a coherent ecosystem of wrappers built around NiiVue, a single, shared visualization engine. This design allows visualization to be integrated directly into the environments where neuroimaging data are generated, analyzed, and shared, while preserving a uniform viewing experience and minimizing fragmentation across workflows. A second aim was to provide open-source implementation templates for custom NiiVue integrations, helping to further grow the viewer ecosystem by encouraging community projects. These NiiVue wrappers can be grouped into four broad categories: integrated visualization extensions (Section 2.2), standalone applications (Section 2.3), language bindings (Section 2.4), and traditional web applications (Section 2.5). Because all these wrappers render through NiiVue, we first summarize the aspects of this common engine needed to understand the wrappers and to make clear where NiiVue ends and the contribution of the present paper begins (i.e., the wrappers; Sections 2.2 to 2.5).
2.1. The NiiVue Core
NiiVue is a browser-native neuroimaging viewer implemented in TypeScript. Its rendering core is separated from user-interface logic,15 so that the same engine can be embedded in different host environments without reimplementing rendering, basic user interactions, or data parsing. It is distributed as a versioned package (@niivue/niivue) on npm, the standard package registry for the JavaScript ecosystem.
NiiVue renders inside a web canvas, a graphics interface native to current web browsers and available via the webview element in most modern software frameworks. It therefore runs anywhere a standards-compliant webview is present: desktop browsers, Electron windows, native platform webviews, and the webview surfaces of integrated development environments and notebook front ends.
2.1.1. Supported data and file formats
NiiVue can display all the common visualization types of neuroimaging: voxel-based volumes, surface meshes, mesh-based statistical overlays, tractography streamlines, and connectomes. It reads the widely used cross-package formats, including NIfTI for volumes, GIfTI for surface meshes, and TCK and TRK for streamlines, together with formats specific to toolchains such as FreeSurfer, MRtrix, and AFNI. Additional formats, including DICOM, MINC, and TIFF, are supported through plugins. Table 1 lists the supported formats by data category.
2.1.2. Rendering and integration model
NiiVue uses a modular architecture in which a model controller, driven programmatically by the host application, dispatches rendering to one of two interchangeable backends: WebGPU26 and WebGL 2.0.27
When a file is opened, NiiVue parses and decodes it in the client, uploads the resulting voxel or geometry data to the graphics processor, and rasterizes the scene on the GPU through the active backend. For the WebGL 2.0 backend, consistent output across devices is provided by ANGLE,28 which translates WebGL 2.0 calls onto an appropriate native graphics API for each platform (e.g., Direct3D, Metal, or Vulkan). The WebGPU backend achieves the same consistency through each browser’s WebGPU implementation, such as Dawn29 in Chromium-based browsers and wgpu30 in Firefox, which map WebGPU commands onto the platform’s modern native API (Direct3D 12, Metal, or Vulkan). In the integrated extensions of Section 2.2, parsing, rendering, and interaction all occur inside the host webview, so no separate viewer process is launched and no remote display forwarding is required. This is what makes opening a file feel like viewing it in place rather than starting a separate application, an interaction pattern known as direct manipulation.31
2.1.3. Saving visualization state and image processing
NiiVue can serialize the complete state of a visualization into an NVDocument, a single CBOR-encoded document that records the loaded volumes and meshes, the scene and camera state, viewer options such as colormaps and intensity thresholds, any drawings, and measurement annotations. Reloading an NVDocument reconstructs the same view, so that a visualization can be archived, placed under version control, or shared with collaborators who then see exactly what the author saw. NVDocument can be exported and imported across different viewers that use the NiiVue core and reconstructs the same scene inside the rendering canvas. NiiVue also provides niimath,32 a compact reimplementation of fslmaths with common image-processing operations, compiled to WebAssembly so that it runs in the browser alongside the viewer, available as an optional plugin. Of the viewers presented here, only the NiiVue desktop app integrates it currently, where it provides thresholding, smoothing, and masking.
2.2. Integrated Visualization Extensions
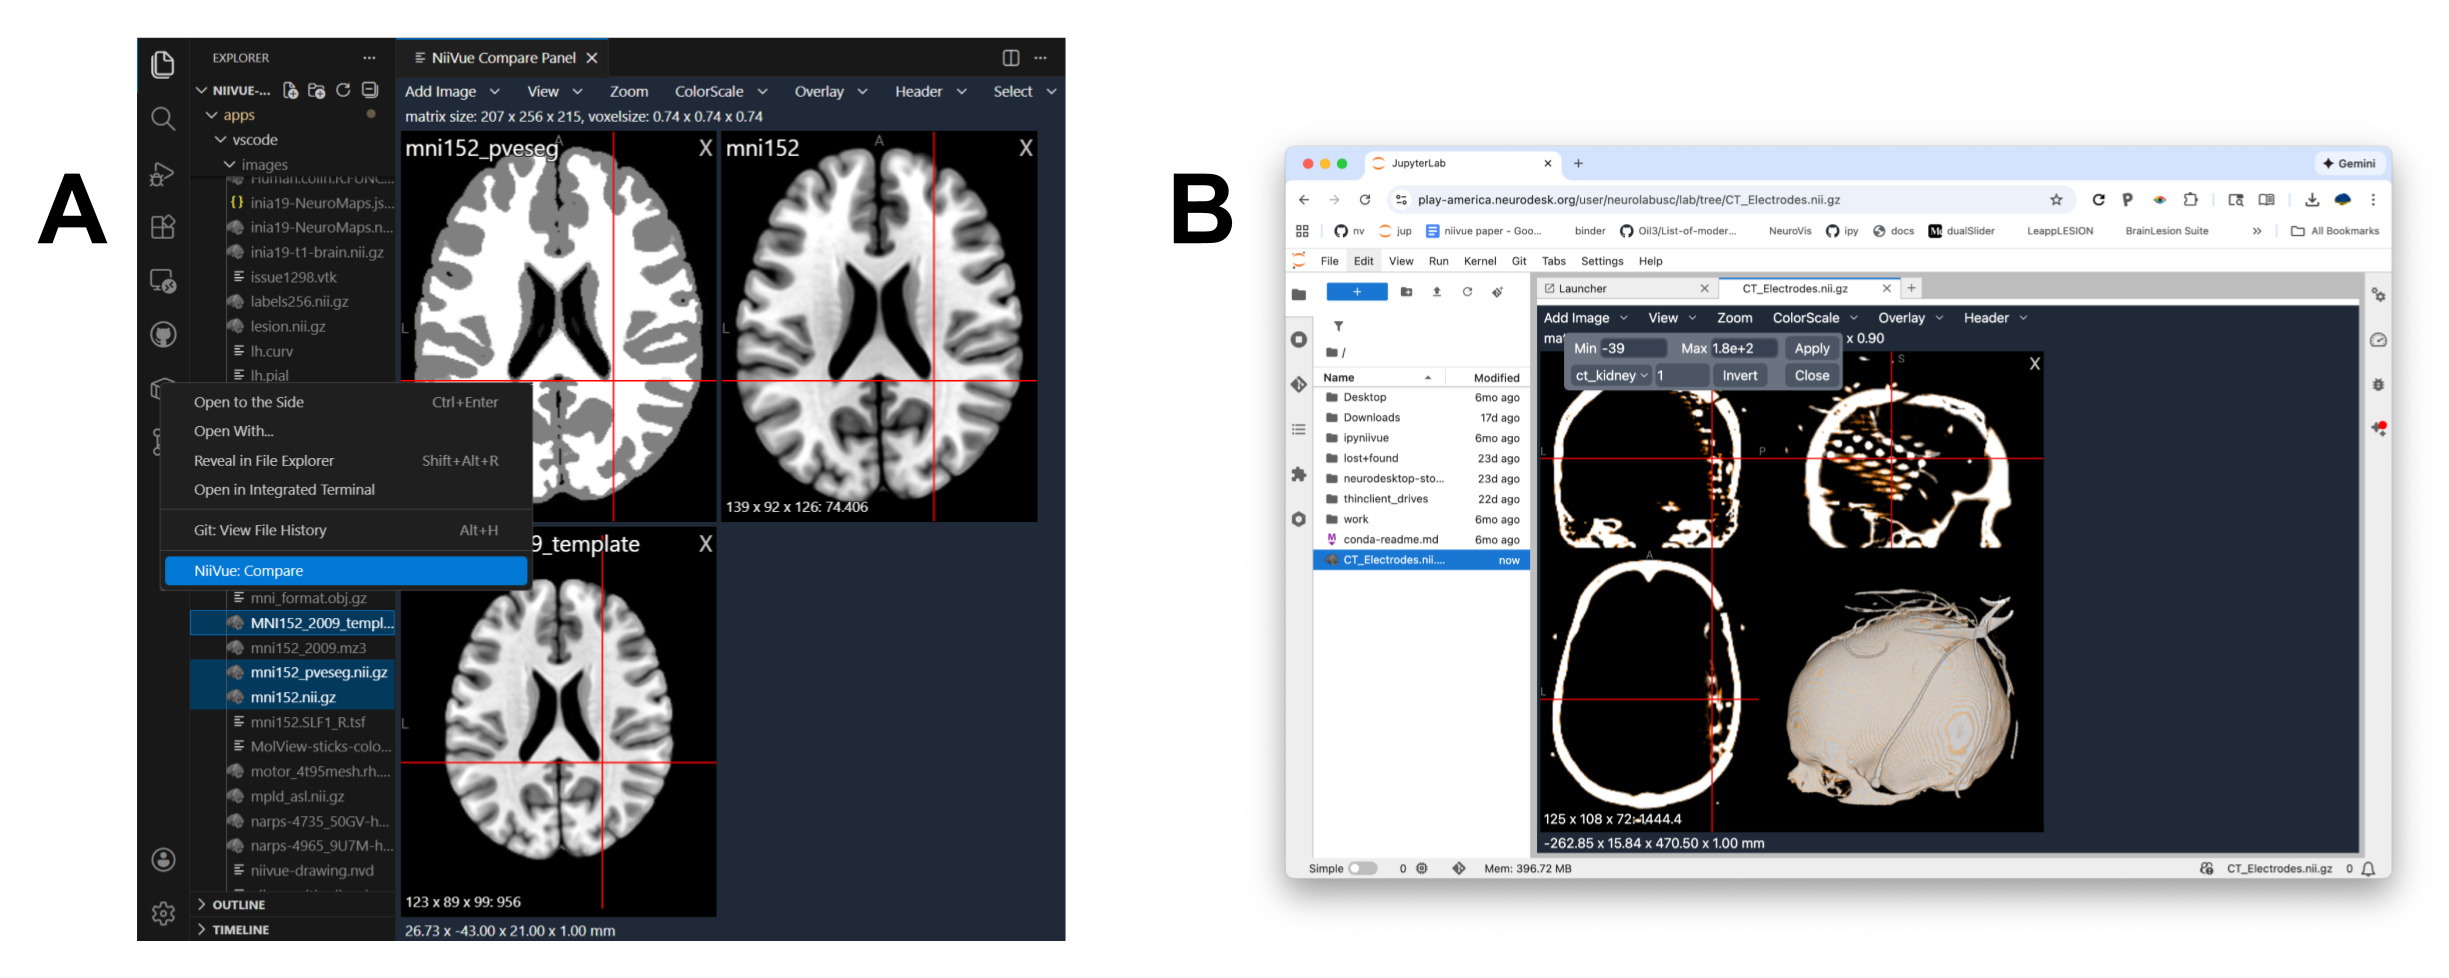
To make NiiVue’s broad format support immediately useful in everyday workflows, we developed file viewer extensions for popular development and analysis environments. These extensions allow users to inspect volumes, surface meshes, and tractography streamlines directly from the integrated file browser, without launching a separate viewer application or writing any code. By enabling low-friction visual inspection at the point of data access, these visualization tools support routine quality control, facilitate comparison across datasets, and reduce the overhead associated with exploratory data analysis. Specifically, we distribute integrated visualization extensions for VS Code and JupyterLab (Figure 2).
_and_jupyterlab_(b)._the_vs_c.png)
The Visual Studio Code and JupyterLab extensions, together with the Progressive Web App (Section 2.3.1), are built as a shared component layer in Preact (a small, API-compatible alternative to React). It wraps the NiiVue engine with support for multiple canvases and a menu bar, providing common functionality via this UI layer. Further, it relays a defined set of messages, such as loading a file, setting a colormap, moving the crosshair, changing the layout, or reading a voxel value, between the host application and the engine. This shared Preact layer makes the individual integration code slim and focused on the specific host they run on, while providing an identical user interface and similar functionality.
2.2.1. Visual Studio Code extension
To integrate visualization into the popular VS Code Integrated Development Environment (IDE), we developed a free extension published on the VS Code Marketplace and the Open VSX registry that can be installed via the VS Code extension manager. Through the Open VSX registry, it can be installed on a range of compatible IDEs, including Google Antigravity, VSCodium-based IDEs, Eclipse, Gitpod, or Cursor.
Usage: This extension registers file associations for common neuroimaging types (e.g., .nii, .dcm). When a user clicks on an associated file in the VS Code file explorer, it opens in a new editor tab. Images can also be opened via the terminal with ‘code <image-path>’. One feature to highlight is the comparison view of multiple volumes or meshes. When selecting multiple files, they can be viewed next to each other with a synchronized view (Figure 2A).
Features: A key advantage of the integration is its seamless interplay with VS Code’s own remote development capabilities. The extension functions identically when connected to remote sessions like containers, Windows Subsystem for Linux, or high-performance computing clusters, enabling interactive visualization of remote data without requiring screen forwarding or local file downloads. The browser-based version of VS Code is also supported, allowing zero install and direct GitHub repository visualization (github.dev).
Architecture: The extension embeds NiiVue in a VS Code Webview, a sandboxed browser view provided by the editor’s Electron/Chromium runtime. Opening a file launches no separate process or external browser, but renders it inside a VS Code editor tab. This extension is built mainly as a NiiVue React (Preact) project that handles the layout and logic. Via an API, messages are sent back-and-forth between VS Code and NiiVue React. The NiiVue React instance runs in an isolated webview environment, whereas the VS Code internal part of the extension acts as an intermediate layer, handling file system operations. The development is in a monorepository, which enables the functionality of the NiiVue React project to be shared with other projects, such as the JupyterLab File Viewer. Supporting VS Code’s remote modes is non-trivial: for a remote connection VS Code runs a local and a remote instance, and the extension mirrors this split, rendering in the local webview while reading data on the remote host. This complexity is hidden from the user, who clicks a file in the explorer and sees the image.
2.2.2. JupyterLab file viewer extension
JupyterLab is a browser-based development environment, supporting Jupyter notebooks. Our extension is a native JupyterLab plugin that renders the viewer client-side in a tab inside the JupyterLab interface (see Figure 2B). It behaves identically in local and cloud-hosted JupyterLab deployments (e.g., JupyterHub or Binder), while inline visualization within notebooks is provided by the language bindings of Section 2.4. This extension is also embedded into Neurodesk,33 a containerized, browser-accessible neuroimaging platform, giving its users interactive NiiVue visualization within the integrated JupyterLab interface.
Usage: Similar to the VS Code extension, it registers file associations for common neuroimaging types. A user can double-click any file of a supported neuroimaging format in the JupyterLab file browser, and it will open in a new viewer tab and load the corresponding data (Figure 2B). This supports inspection of neuroimaging data directly in JupyterLab’s file browser.
Features: This extension is distributed as a lightweight pip package and can be installed with ‘pip install jupyterlab-niivue’. It aims to provide a simple and powerful file viewer, and works outside notebooks, independently from the iPyNiiVue library (Section 2.4.1).
Architecture: The JupyterLab file viewer extension is developed in the NiiVue VS Code monorepository and shares the underlying NiiVue React project. It displays the viewer in an isolated webview frame and targets the NiiVue React API with messages from the Python side of the JupyterLab extension. The viewer opens as a JupyterLab tab within the same session, not as a separate browser tab, and runs entirely client-side. It therefore works in cloud-hosted JupyterLab deployments such as JupyterHub and Binder, without a server-side rendering process.
Neurodesk Integration: This extension was developed as a component of Neurodesk (neurodesk.org). Its integration allows researchers within the Neurodesk ecosystem to seamlessly view image data alongside their suite of analysis tools.
2.3. Standalone Applications
While NiiVue can be embedded in web pages, visualization extensions, and scripting environments, it can also be deployed as a traditional standalone desktop application, which is useful for offline use, secure computing environments, and workflows that require deeper integration with the operating system. Because browser-based viewers run within a security sandbox, opening a volume file does not automatically grant access to associated sidecar files34 such as BIDS metadata,35 and a web application cannot easily exchange data with other local tools. A native desktop application removes these restrictions, gaining access to complete directory structures and to inter-application messaging with other neuroimaging tools (e.g., AFNI components communicating with one another).
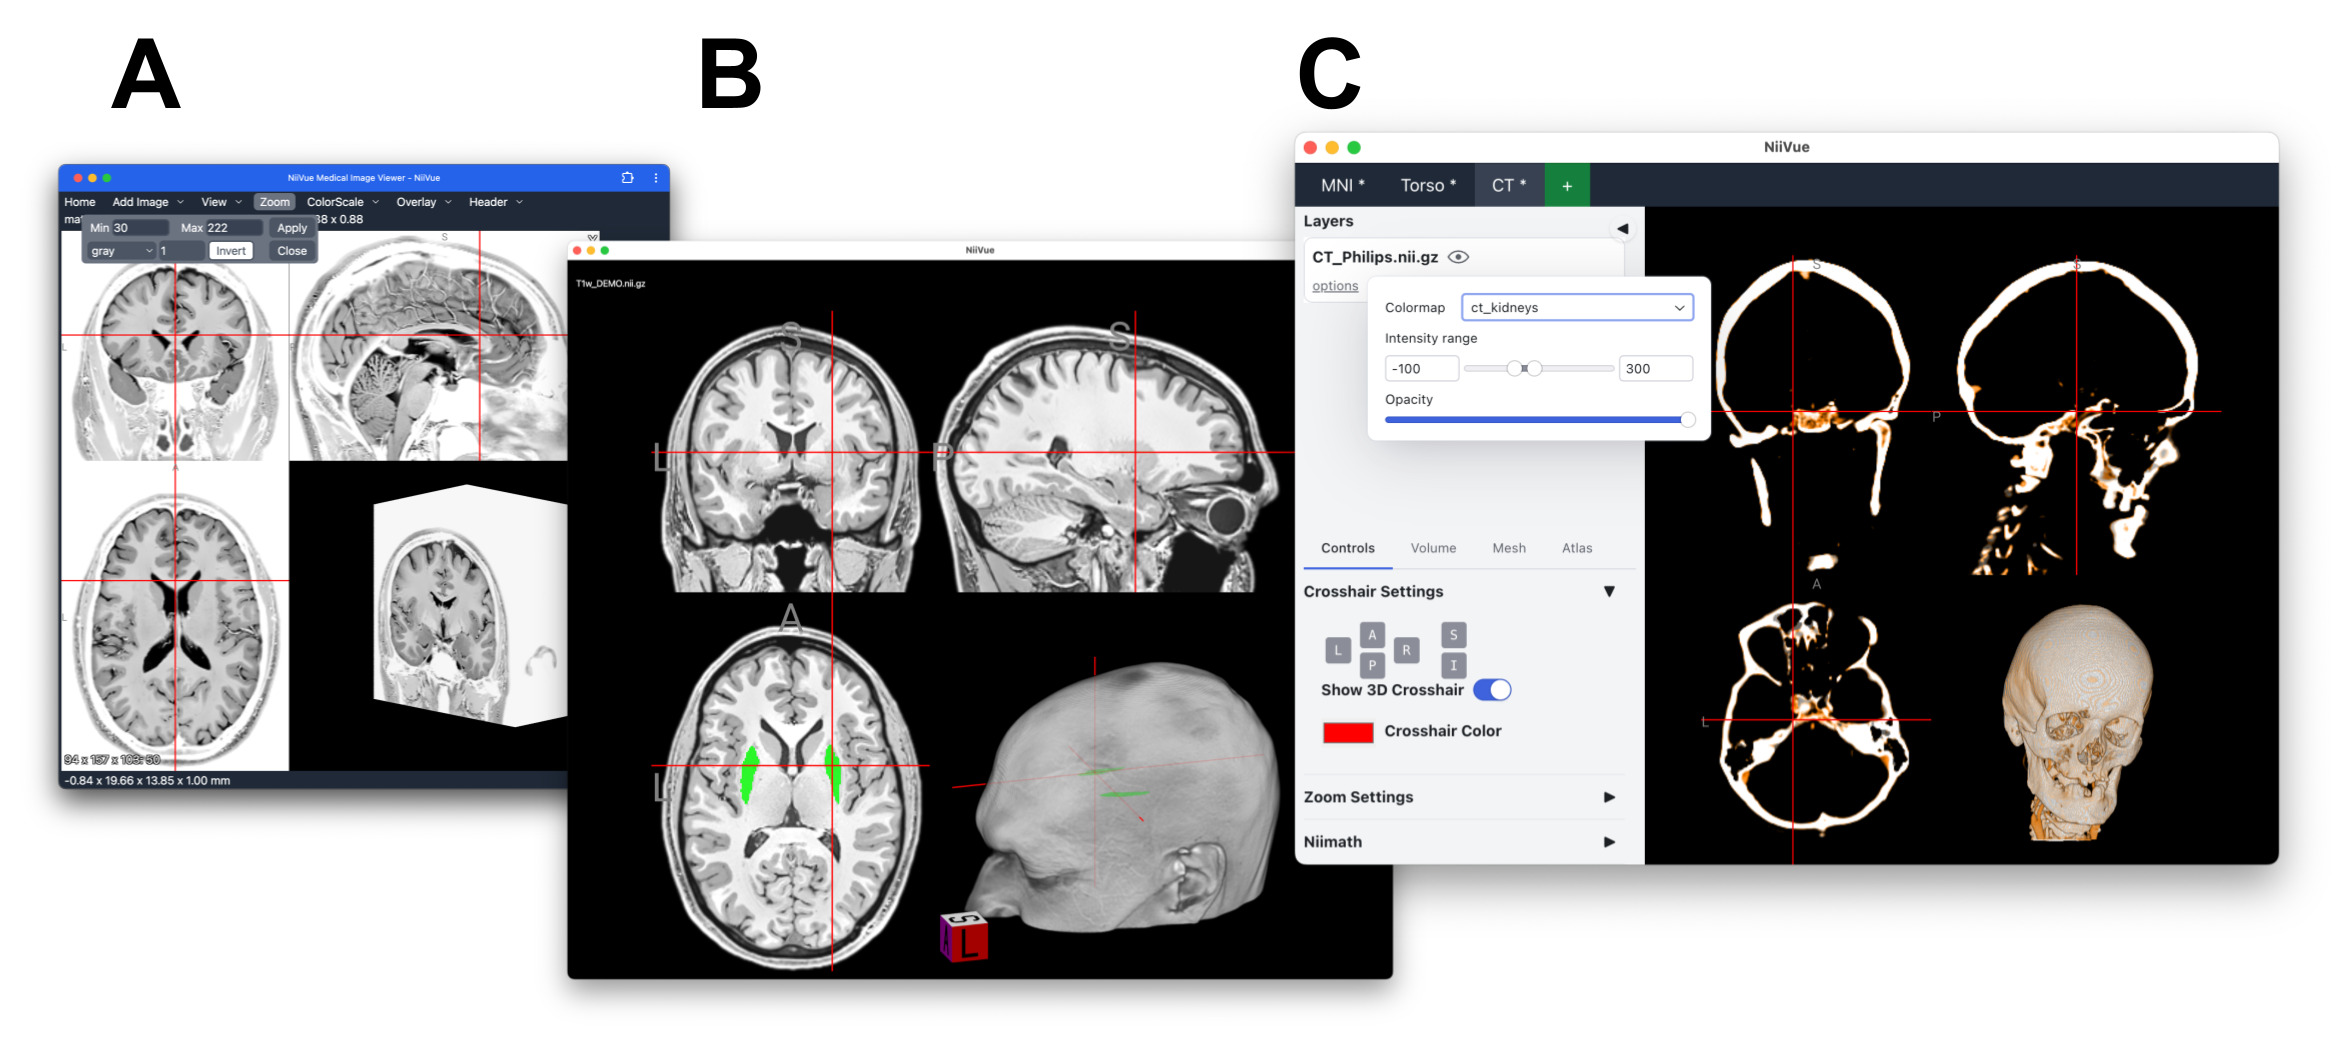
We therefore provide three complementary forms of standalone applications that address different levels of functionality and integration (Figure 3). The Progressive Web App (PWA) offers a lightweight desktop option packaging a web-based viewer with minimal overhead, prioritizing portability and ease of deployment. The Swift-based WebKit wrapper for Apple platforms provides a lean native interface that exposes platform-specific user interface elements and is particularly well suited for interactive tasks such as drawing voxel-based regions of interest on touch- and pencil-enabled devices. Finally, the Electron-based cross-platform application represents a fully featured desktop viewer, exposing the breadth of the NiiVue core through a rich set of user interface controls that enable users to explore and discover advanced visualization capabilities interactively.
__native_swift_application_for.png)
2.3.1. Progressive Web App
To provide a lightweight, cross-platform viewing experience, we developed a PWA, a web application that leverages modern browser capabilities including offline execution, local file access, and desktop integration. This can deliver experiences that closely resemble native applications.36 Because a PWA requires no installation and runs in any standards-compliant browser, it can be used in environments where installing native software is restricted or impractical, for example managed clinical workstations, shared teaching machines, or tightly controlled institutional systems. This NiiVue PWA supports hardware-accelerated neuroimaging visualization, while avoiding the complexity of distributing and supporting separate binaries for different operating systems.
Usage: The PWA can be either opened as a desktop application or a web page. Files can be dragged and dropped onto the window or chosen in the file picker. The PWA provides the power of NiiVue for viewing local or remote files without requiring any software installation beyond a web browser.
Features: Although the viewer can be accessed like a web page, the data remain local. The PWA can be installed to achieve a native-like experience, with an entry in the system application list and support for file associations. We provide a bookmarklet, which is a small script that can be placed in the bookmark bar of the browser. When clicked, it converts links to hosted neuroimaging files on the current webpage into PWA links, allowing the files to open directly in the viewer.
Architecture: The PWA execution runs in the local browser engine, without requiring a server backend. There is no online communication other than obtaining the JavaScript and HTML files of the NiiVue PWA by URL access. The PWA is based on the NiiVue React project and adds PWA capabilities through the frontend toolkit Vite.
2.3.2. Swift Native Apple applications (iOS, iPadOS, macOS)
Apple’s mobile and desktop platforms are supported via a native application distributed through the Apple App Store. Applications delivered via the App Store undergo Apple’s notarization and security review process, which helps ensure code integrity, protects users from malicious software, and enables installation without manual security overrides. This reduces friction for new users and offers a familiar user experience that aligns with platform conventions across iOS, iPadOS, and macOS. The current version is intentionally minimal, serving as an open-source reference implementation and extensible skeleton that others can build upon to create more capable, use-case-specific tools.
Usage: Users can download the application from the Apple App Store and install it on their iPhone, iPad, or Mac. Once installed, the application provides immediate access to NiiVue’s neuroimaging visualization capabilities. The native integration allows users to open neuroimaging files directly from their device’s file system and benefit from platform-specific features like Dark Mode support and system-level gesture controls.
Features: The application provides a focused viewing experience for users on iPhone, iPad, and macOS from a single, unified build. It supports flexible viewing on different screen ratios and sizes. An advanced capability of the application is interactive voxel-based drawing, which allows users to create and edit region-of-interest maps directly within the viewer. This functionality supports tasks such as delineating lesions, tumors, and white matter hyperintensities, as well as refining existing segmentation maps. The feature is particularly well suited to pencil-equipped tablets, where pressure-sensitive input and familiar gesture-based interactions enable intuitive and precise definition of voxel-level regions.
Architecture: This wrapper is built using SwiftUI, Apple’s modern framework for user interfaces. It provides a lightweight native shell that embeds NiiVue within a webview. This solution provides the best of both worlds: it provides a native application feel and App Store distribution, while leveraging the single NiiVue rendering core.
2.3.3. Electron-based NiiVue desktop
For users who prefer a traditional, cross-platform desktop experience, NiiVue Desktop is provided as a standalone application built with Electron. An Electron-based approach enables a single, unified codebase to be distributed reliably across Windows, macOS, and Linux, while offering the responsiveness, offline availability, and system integration expected of native desktop software. NiiVue Desktop bundles native builds of niimath and dcm2niix37 and ships pre-trained brainchop38 models for brain extraction and segmentation. These are available through the graphical interface and through a command-line interface, so that a DICOM directory can be converted, an image-processing operation applied, or a segmentation generated from a script, with the result opened in the viewer. The capability to execute native binaries and read complete directory structures are what distinguish this deployment from the browser-based viewers. NiiVue Desktop supports visualization of voxel-based volumes, surface meshes, tractography streamlines, connectomes, and associated statistical maps within a single environment. In addition to serving end users who require a comprehensive desktop viewer, this application also functions as a reference implementation that showcases the full capabilities of the NiiVue rendering core, providing developers with a concrete example of how advanced features can be integrated into their own applications.
Usage: This desktop application provides an experience similar to a traditional application (e.g., launching from a dock/start menu, file-opening associations, menu bar).
Features: The NiiVue Desktop application provides a comprehensive set of user interface controls for interactive visualization of voxel-based volumes, surface meshes, tractography streamlines, connectomes, and associated statistical maps. The interface exposes a wide range of rendering, layout, and annotation options, enabling users to configure complex visualizations within a single environment. The complete state of a visualization can be saved and shared via the NVDocument format. This breadth of functionality supports detailed exploratory analysis and comparison across data modalities, while also serving as a concrete demonstration of the full feature set available in the NiiVue rendering core.
Architecture: This application is built using Electron, a framework for creating desktop applications with web technologies. It packages the core NiiVue library into a standalone executable for Windows, macOS, and Linux.
2.4. Language Bindings for NiiVue Integration
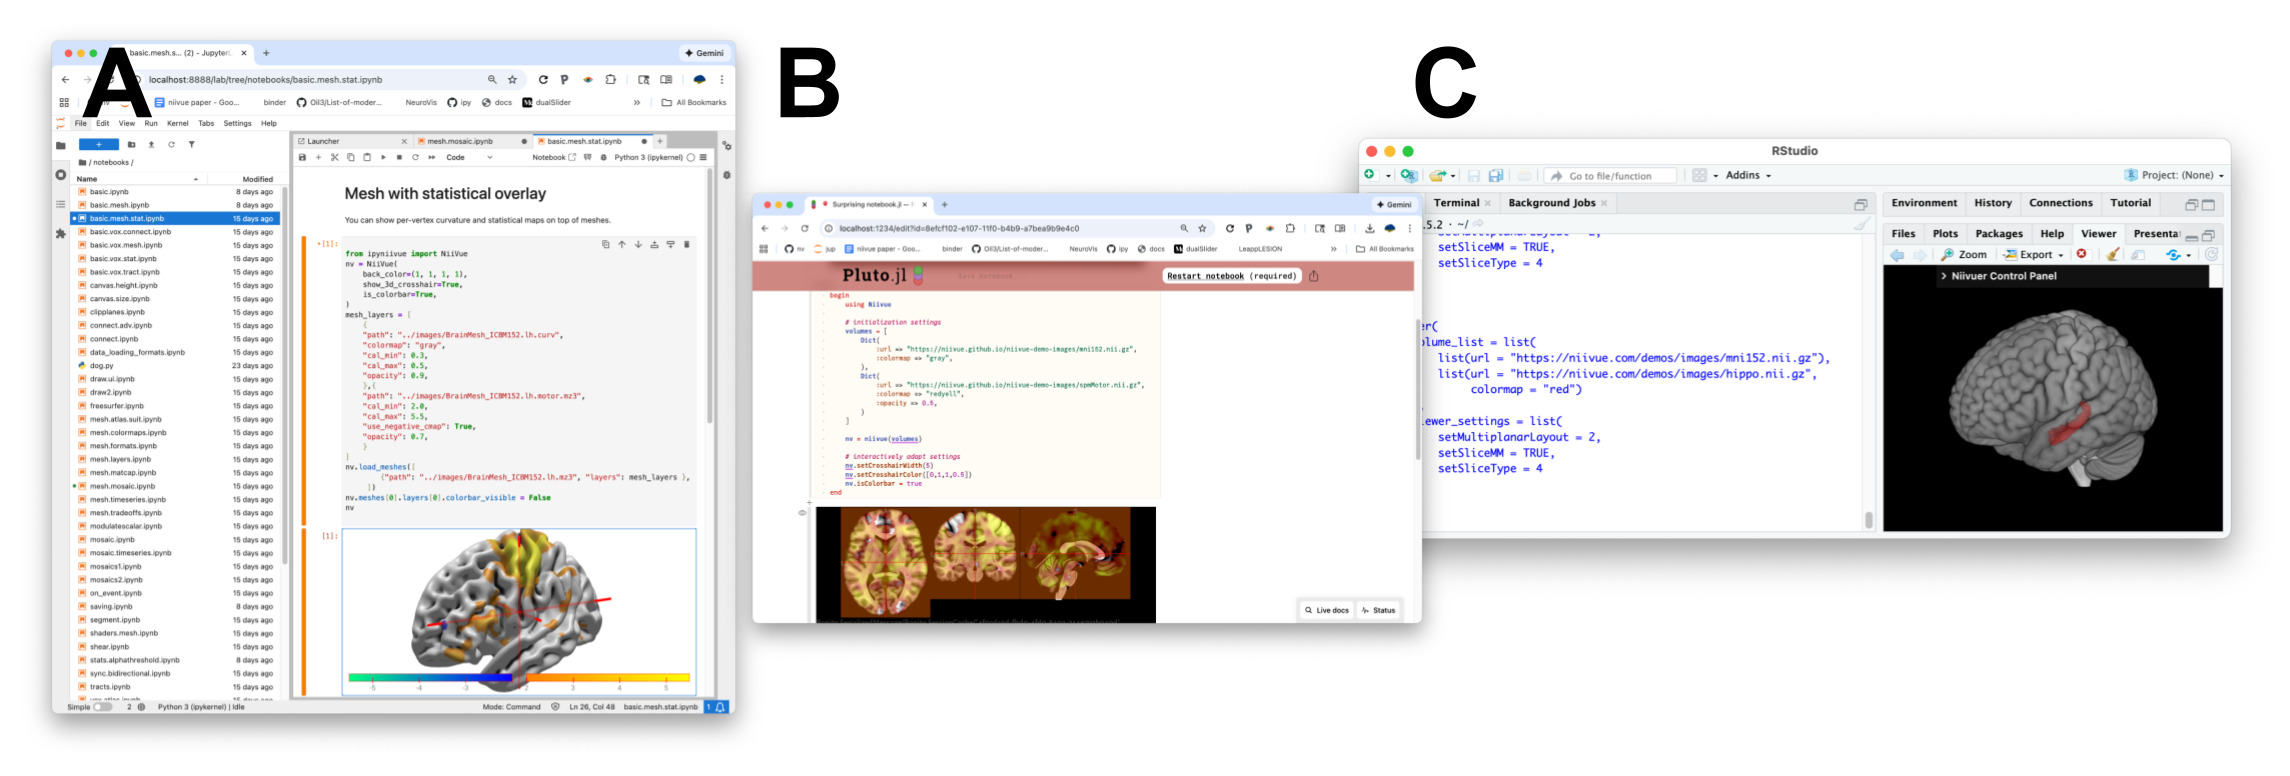
We provide language bindings that enable programmatic control of NiiVue’s embedded visualization from popular scripting languages, including Python, Julia, and R (Figure 4). These bindings allow interactive visualization to be incorporated directly into analysis workflows, supporting tasks such as quality control, exploration of edge cases for education, and the generation of reproducible figures for dissemination.
__julia_(b)_and_r_(c).png)
2.4.1. iPyNiiVue: Python with Marimo and Jupyter integration
To serve the Python data science community, we developed iPyNiiVue, an interactive notebook widget wrapping the NiiVue visualizer. It is worth emphasizing that Jupyter and Marimo notebooks execute within a web-browser, and therefore embedded interactive graphics must use web-based technologies such as NiiVue’s WebGL. In contrast, many popular Python-based tools for visualizing neuroimaging data rely on desktop-based graphics libraries (like OpenGL), and therefore they are unable to be embedded directly into notebooks.
Usage: iPyNiiVue allows programmers to display and interact with neuroimaging data from files or arrays, exposing most of the features of the native NiiVue widget to Python. iPyNiiVue can be used on local notebook servers, within notebooks rendered through IDEs (e.g., VS Code), on remote Jupyter servers (e.g., JupyterHub), or in virtualized notebook environments such as Google Colab. The iPyNiiVue documentation contains a Notebook Gallery with examples ranging from simple viewers to powerful widgets.
Features: iPyNiiVue wraps within native Python code most functionalities available in NiiVue and it provides a blueprint on how to implement NiiVue features that are not currently covered. All exposed (i.e., public) functions and classes are documented with docstring, offering the natural look-and-feel of native Python libraries. Specifically, the functions use Pythonic snake-case (e.g., set_gamma) rather than the native JavaScript camel-case (e.g., setGamma) naming. iPyNiiVue provides a bidirectional communication; user interactions in the viewer (e.g., voxel selection) emit events and send data back to the Python kernel, enabling fully interactive applications. Users can save and share complete scenes independently of the notebook via the NVDocument format.
Architecture: The library is built using the anywidget framework,39 which provides a lean and modern approach to creating custom Jupyter widgets. This framework acts as a “widget bridge layer”, handling the serialization and deserialization of data between Python and JavaScript. Data and commands (e.g., loading volumes, setting colormaps) are sent from the Python kernel to the widget. It uses the traitlets library to automatically synchronize the widget’s state, meaning any change to a property (e.g., colormap or opacity) in Python is automatically reflected in the JavaScript viewer, without custom messaging protocols. It exposes most of the NiiVue JavaScript API via a translation layer to Python. This embedding allows the visualization tool to take full advantage of the notebooks. For example, Marimo Python notebooks can be exported to WebAssembly, allowing interactive notebooks to execute entirely in the browser, without a backend executing Python. Likewise, with the Jupyter RISE extension, notebooks can be exported to reveal.js-based slide-show presentations.
2.4.2. Niivue.jl: Julia language support
Recognizing the increasing adoption of Julia in scientific computing, we developed Niivue.jl to integrate interactive neuroimaging visualization directly into Julia-based workflows. Julia provides a combination of high-level syntax and high-performance numerical execution,40 which has led to its growing use for large-scale data analysis, image processing, and statistical modeling. Despite this adoption, support for specialized neuroimaging visualization within the Julia ecosystem remains limited. Niivue.jl addresses this gap by enabling visualization to occur in the same environment in which data are generated and analyzed, reducing friction between computation and interpretation, and supporting interactive, exploratory workflows.
Usage: Niivue.jl displays neuroimaging files or Julia arrays, instantiated and controlled from a Julia session. The viewer layout and settings can be changed programmatically through Julia code, enabling interactive changes of the NiiVue instance. The viewer can be used in any Julia environment: the read-eval-print loop (REPL), notebooks (Pluto, Jupyter), and IDEs (VS Code plot pane). Niivue.jl can be directly used for visualization or as a base package for developing custom Julia GUI neuroimaging applications or widgets.
Features: This package provides an idiomatic Julia interface to NiiVue, with high-level convenience functions and direct access to the underlying NiiVue core API. It integrates seamlessly with the Julia ecosystem, enabling users to visualize arrays and image objects directly from the REPL, Pluto, or Jupyter notebooks. This architecture supports bidirectional communication, enabling executing JavaScript from the Julia kernel and handling frontend events via Julia callbacks.
Architecture: The package is designed as a thin wrapper built on the Bonito.jl framework. Bonito.jl serves as the reactive web framework that bridges Julia with the JavaScript-based NiiVue library. It manages the web server, WebSocket connections, and data synchronization, allowing Julia code to interact with the NiiVue frontend.
2.4.3. niivuer: R integration
To support users working in the R ecosystem, we developed niivuer, an R package that enables interactive neuroimaging visualization using NiiVue from within R-based workflows. R is widely used for statistical analysis, data visualization, and reproducible reporting in neuroimaging research, particularly through environments such as RStudio and R Markdown. niivuer allows users to embed interactive visualization directly alongside statistical analyses and figures, reducing the need to switch between separate analysis and visualization tools.
Usage: niivuer exposes a high-level R function that launches an interactive NiiVue viewer capable of displaying volumetric images and surface meshes from local files or remote URLs. The viewer can be rendered in the RStudio Viewer pane, in a web browser, or embedded within R Markdown or Quarto documents. Viewer appearance and behavior can be configured using R lists that map directly to NiiVue settings, enabling reproducible visualization through scripted workflows.
Features: The package provides a lightweight R interface to a subset of NiiVue functionality, focusing on common visualization tasks such as loading volumes and meshes, setting colormaps, and adjusting viewer layout. In contrast to the Python and Julia bindings, niivuer currently exposes a more limited portion of the NiiVue API and offers less extensive bidirectional interaction between the viewer and the R session. As such, it is best suited for interactive inspection and reporting rather than the construction of fully reactive visualization applications.
Architecture: niivuer is implemented as an HTML widget that embeds the NiiVue WebGL viewer within the R environment. The package handles the generation of the required HTML and JavaScript assets and manages communication between R and the embedded viewer using standard htmlwidgets mechanisms. The viewer executes entirely in the local browser engine, with R responsible for configuring the visualization state. Compared with the Python and Julia implementations, the R integration is intentionally simpler and remains under active development. Our niivuer bindings can embed NiiVue into Shiny applications and interactive R Markdown or Quarto documents.
2.5. Traditional Web Applications
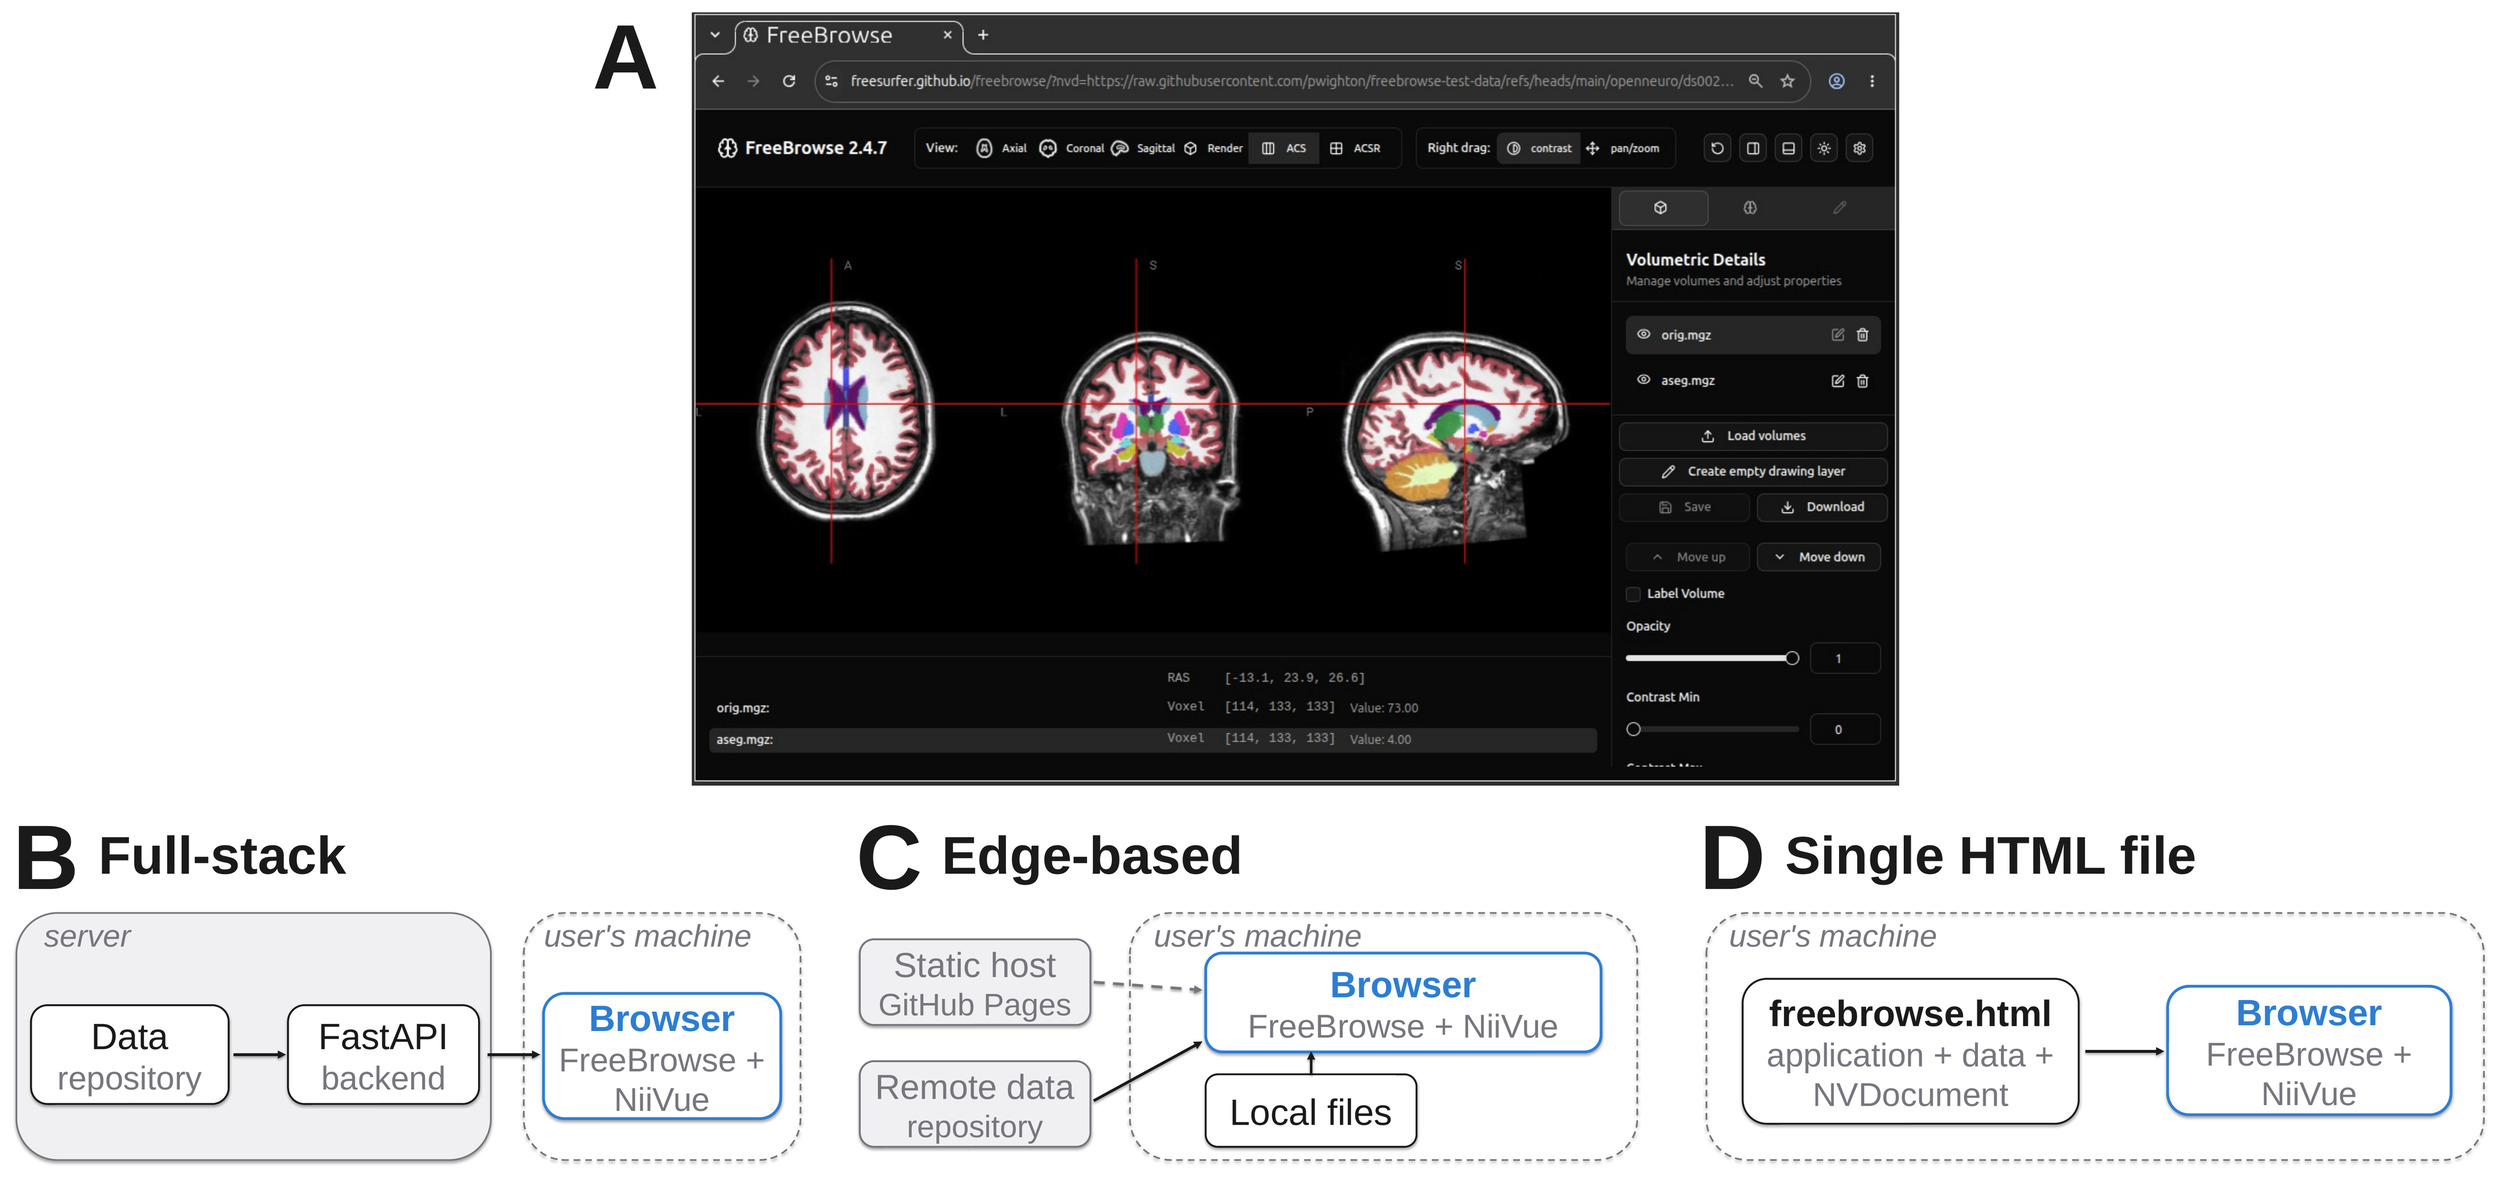
NiiVue can also be integrated into traditional web applications, either as a full-stack deployment where neuroimaging data is served from a central repository, as an edge-based deployment where rendering occurs locally against data already accessible to the browser, or as a single self-contained HTML file requiring no infrastructure at all (Figure 5). FreeBrowse is an open-source neuroimaging viewer that demonstrates all three of these deployment modes.
_is_similar.png)
2.5.1. Full-stack deployments
Usage: Deploy FreeBrowse alongside a centralized neuroimaging data repository to provide browser-based visualization and annotation with server-managed data access.
Features: Access, visualize, and annotate large datasets served from institutional or cloud storage; integrates with existing data management infrastructure.
Architecture: FreeBrowse’s full-stack architecture borrows from the NiiVue full-stack demo, an open-source reference implementation developed during a Google Summer of Code project41 that pairs a NiiVue-based frontend with a lightweight FastAPI backend for serving neuroimaging files. FreeBrowse builds on this foundation by adding a file browser, annotation, and deep-linking functionality. Deep links encode not just a reference to a dataset but a complete viewer configuration, including the volumes and surfaces to be loaded and their display parameters, into a single shareable URL. Deep-linking is achieved via a URL parameter that specifies an NVDocument to load.
2.5.2. Edge-based deployments
Usage: Deploy FreeBrowse as a static web application that renders neuroimaging data accessible directly from the user’s local machine or via URL, without requiring a dedicated backend or risking Protected Health Information exposure.
Features: Zero server-side infrastructure; data never leaves the user’s machine; suitable for local analysis workflows and privacy-sensitive datasets.
Architecture: In edge mode, FreeBrowse runs entirely in the browser as a static deployment with no backend. NiiVue performs all format parsing and rendering client-side, with no data transmitted to a remote server. Users can load neuroimaging data by uploading files from their local machine or by referencing URLs to remotely hosted data, such as datasets on OpenNeuro42 or other publicly accessible repositories.
2.5.3. Standalone deployments
Usage: Pipeline developers can bundle FreeBrowse as a single self-contained HTML file alongside the outputs of a processing pipeline, enabling end users to inspect results directly in a browser without installing any software or configuring any infrastructure.
Features: No installation, build step, or hosting infrastructure is required. These self-contained HTML files are compatible with the file:// protocol which enables them to be opened directly from a local filesystem without requiring a web server. They can be distributed alongside pipeline outputs or shared as a file attachment and can be opened in any modern browser.
Architecture: All dependencies, including NiiVue and the FreeBrowse interface, are bundled into a single HTML file. Neuroimaging data and viewer configuration are embedded directly into the file as an NVDocument, allowing a pipeline to produce a fully self-contained, pre-configured viewer as part of its standard output.
3. Results
The implementation of these methods has resulted in a comprehensive ecosystem of tools that integrates NiiVue visualization across a wide array of scientific platforms. Each of the presented projects is open-source and shared on GitHub, providing a collaborative platform for users and developers to generate issues and improve the code. The range of deployment options enables visualization to be integrated across users’ preferred environments. Furthermore, these implementations serve as extensible templates for integrating NiiVue into custom or domain-specific neuroimaging tools.
3.1. Validation and Testing
To ensure the robustness of the software presented, the packages are validated by automated continuous-integration pipelines. The shared NiiVue core is linted, type-checked, and unit-tested, and extensive end-to-end tests are performed. These contain reference-based regression tests, operating at two levels. At the data level, the tests ensure that parsed header fields, voxel intensities, geometric transforms, and derived statistics match reference values for standard test images. At the rendering level, complex scenes are created in a headless browser and compared pixel-by-pixel against committed reference renderings, detecting any unintended change.
The wrappers are tested individually in their respective repositories, and the current state of the testing infrastructure is summarized in Table 2. The React package shared by the VS Code extension, JupyterLab extension and PWA has unit tests, as do these individual wrappers. Basic end-to-end tests are implemented for the JupyterLab extension, and a larger range of user-simulating end-to-end tests for the PWA. The iPyNiiVue package contains unit tests covering multiple Python versions and operating systems, and end-to-end tests covering all example notebooks presented in the gallery. The remaining wrappers contained only light or no automatic testing at the time of this writing.
To ensure new features are well tested, code coverage metrics are used in continuous integration for the NiiVue core and for the VS Code extension, JupyterLab extension, and PWA, sharing the same repository and most of the codebase via a shared component layer.
3.2. Community Adoption
The VS Code and JupyterLab extensions provide a seamless, IDE-native file viewing experience, allowing researchers to inspect data products without leaving their development environment. These tools have seen strong community uptake, with the VS Code extension having approximately 22,000 users (unique downloads, updates not counted) from the official VS Code Marketplace and an additional 2,900 downloads from the Open VSX registry.
Users who prefer a traditional standalone viewer can choose between the native Apple application (for iOS, iPadOS, and macOS), the cross-platform Electron-based desktop application, and the PWA. These applications are motivated by the need for simple, accessible visualization, and share the common characteristic of being pure viewer applications that require no programming or integration into other tools. The native Apple application has achieved over 15,000 impressions and 700 installations, demonstrating a demand for portable, mobile-first visualization. No usage statistics were collected for the PWA or the desktop application.
For researchers working within a programming environment, we created the libraries iPyNiiVue for Python-based visualization in Jupyter and Marimo notebooks, and Niivue.jl for the Julia programming language, that provide robust, interactive, and bidirectional neuroviewer solutions. iPyNiiVue alone has accumulated approximately 31,000 downloads as of January 2026. Meanwhile, niivuer is integrated into RAVE43 and YAEL,44 R-based frameworks for analyzing intracranial electroencephalography. The NiiVue core package is available on npm and downloaded 2,200 times per week as of January 2026.
Collectively, this suite of tools helps address the fragmented workflow of “export and view”. It allows researchers to maintain context by keeping analysis and visualization within a single environment, thereby facilitating more interactive data exploration. Further, they provide a lighter, nimbler solution to visualize neuroimaging data in various contexts, including clinical and educational settings.
4. Discussion
The central contribution of this work is the integration of the NiiVue visualization core across a wide range of scientific computing environments. By embedding a shared visualization engine into tools such as integrated visualization extensions, computational notebooks, web applications, and desktop platforms, users gain a consistent viewing experience independent of their preferred workflow. This consistency reduces cognitive overhead, enables transfer of skills between environments, and allows researchers to choose the most appropriate tool for a given task without sacrificing format support or interaction paradigms, which is aligned with the usability principle of consistency and adherence to platform conventions.45 We also aimed to reduce the number of interactions a routine task requires, both inside the interfaces we built and through the existence of our tools, for example by opening a file directly from the host file browser instead of exporting data and launching a separate viewer. This minimizes the elementary operations a task involves and is what established models of interaction cost, such as the keystroke-level model, associated with faster routine performance.46
These benefits extend equally to developers. Because all wrappers are built on a common visualization core, improvements to NiiVue—such as adding new format support, rendering optimizations, or adding interaction features—propagate across the ecosystem. This contrasts with traditional neuroimaging software development, where visualization capabilities are reimplemented and maintained separately in siloed applications. This coupling to a shared core also contains a risk, a defect in the core would likewise reach multiple wrappers, the single point of failure that motivates design diversity in fault-tolerant systems.47 The core therefore has the most extensive automated test suite in the ecosystem (Section 3.1), and since each wrapper adds its own tests and its own users, the core is tested on more independent contexts than any single application would provide. The use of web technologies further ensures broad portability: NiiVue runs on any platform that supports a webview, independent of operating system or hardware vendor.
The ecosystem presented here addresses long-standing needs within the neuroimaging community. NiiVue is open source, actively maintained, and exposes a stable, well-documented API. It supports a wide range of data types and integrates common image-processing operations through niimath within the visualization environment (Section 2.1.3). This flexibility has encouraged adoption and integration, with more than 30 external projects incorporating NiiVue as of January 2026.
By providing targeted wrappers, this work transforms NiiVue from a standalone visualization library into a practical component of everyday neuroimaging workflows. Direct integration into environments such as VS Code, JupyterLab, Python, Julia, and R ecosystems, and desktop applications eliminates the need to export data to external viewers and enables visualization to occur in situ, alongside analysis code and results. Furthermore, NiiVue supports export into the NVDocument format to allow users to save and share the complete state of a visualization, including loaded volumes, color scales, and camera angles. This makes the visualization step itself reproducible: a figure can be regenerated from the same script, and a saved scene can be reopened by a collaborator, who might be working in a different NiiVue wrapper.
The wrappers are not meant to replace tools like FSLeyes or 3D Slicer for every task, but rather to close existing gaps by providing focused viewers for specific tasks. NiiVue uploads each volume to the graphics processor as a single 3D texture, so an image must fit both within the maximum 3D texture size the device exposes, which is 2048 voxels per axis under the current WebGPU limits, and within a single memory allocation, which is currently limited to 4 GB. High-resolution volumes or long 4D series can exceed these bounds, where a native application would not. This can be solved with chunked, multi-resolution formats48 that load only the region currently required, and support is actively being developed in the NiiVue core. In addition, automated testing is uneven across the ecosystem (Table 2), and our tests establish consistency against reference values and reference renderings rather than equivalence with other neuroimaging viewers. Finally, the NiiVue core is currently being transitioned into a monorepository for its v1.0 release, which introduces large architectural improvements, including a new model controller design, and establishes a long-term stable API. The public API changes slightly, and the individual wrappers are still being migrated to this new version.
Looking ahead, development will focus on strengthening existing integrations and testing infrastructure, as well as expanding support to additional platforms in response to community needs. Prototype integrations already exist for Streamlit apps, and support for environments such as MATLAB is feasible given their support for embedded webviews. Planned directions include expanding niimath usage in the wrappers where useful and harmonizing the backend communication to allow simple swapping of user interfaces (e.g., using FreeBrowse as a viewer in the VS Code extension). Further active paths of development are integration with BIDS, which would enable provenance tracking via BIDS derivatives and be especially valuable in combination with niimath. Together, these efforts aim to further make interactive visualization a standard component of modern neuroimaging pipelines.
Funding
AA, CD, TH, COR and CR are supported by the National Institutes of Health (NIH) with P50-DC014664 and RF1-MH133701. KE was supported through both institutional employment and external research consultancy contracts provided by UQ and the South Carolina SmartState Endowment for Neuroimaging. This work is supported by the Wellcome Trust with a Discretionary Award as part of the Chan Zuckerberg Initiative (CZI), The Kavli Foundation, and Wellcome’s Essential Open Source Software for Science (Cycle 6) Program (Grant Ref: 313306/Z/24/Z).
Acknowledgments
The authors would like to thank Trevor Manz, whose anywidget framework provides the foundation for the iPyNiiVue library. We also acknowledge contributions from Jan-Hendrik Müller, Alexis Thual, Kabilar Gunalan, Jolinda Smith, Bradley Alford, and Remi Gau.
Data and Code Availability Statement
All components of this software ecosystem are open-source and released under permissive licenses (e.g., BSD-2-Clause, MIT). The source code and documentation for each component are publicly available on GitHub with details about the repositories in Table 3. The packages are installable from their respective community repositories and distribution pages.