
Introduction
Perinatal stroke (PS) is a focal vascular brain injury occurring between the 20th week of gestation and the 28th postnatal day, affecting about 1 in 1100 births and millions of people worldwide.1,2 It is the leading cause of hemiparetic cerebral palsy (HCP), a non-progressive, lifelong disorder of motor and posture predominantly on one side of the body.3 The precise timing and focal nature of PS create a quasi-experimental context in which to observe how the developing brain reorganizes after injury, supporting its use as an ideal human model for investigating developmental neuroplasticity.4 Yet, the extent to which sensorimotor network connectivity is disrupted after PS, and how this relates to functional outcomes is poorly understood. This study aimed to characterize sensorimotor network connectivity and to examine its association with proprioceptive and visuomotor performance across different sensorimotor tasks.
PS is broadly classified into two subtypes: arterial ischemic stroke (AIS) and periventricular venous infarction (PVI). AIS is the most common, representing about two thirds of all PS, which most commonly results from a middle cerebral artery occlusion with combined cortical and subcortical infarction near term.5,6 In contrast, PVI is caused by a germinal matrix hemorrhage in utero leading to subcortical venous infarction of the periventricular white matter often involving the corticospinal tracts while the motor cortex remains structurally intact.1,7
Children with PS typically experience lifelong neurological disabilities, most commonly presenting as motor deficits in the form of HCP.5 Sensorimotor networks can be disrupted in children with PS, and diverse motor impairments may result from altered networks in both the lesioned and contralesional hemispheres.5 In addition to the motor system, proprioception is a key somatosensory modality impaired in youth with HCP, responsible for the perception of limb position and motion that relies on mechanosensory neurons distributed throughout the body.8,9 It is critical for maintaining the cortical representation of the body and is likely involved in the recovery of function after injury.10–12 Studies have previously quantified upper limb sensorimotor function in children with PS using the Kinesiological Instrument for Normal and Altered Reaching Movements (Kinarm) exoskeleton robot’s interactive augmented reality environment (BKIN Technologies Ltd., Kingston, ON, Canada).13–17 A major advantage of this technique is that limb proprioception can be sensitively measured in an objective way using tasks that are well-tolerated in a pediatric population.
Sensorimotor network disruption in HCP can also be assessed using task free resting state functional MRI. Measuring temporal cross-correlations in blood oxygenation level-dependent (BOLD) signals between brain regions at rest allows functional connectivity (FC) to be quantified and compared to those of typically developing controls (TDC).18 A recent study identified lower FC in some components of the sensorimotor network (i.e., thalamus) in children with HCP due to PVI, showing positive correlations between FC and upper-limb visuomotor performance assessed using the visually guided reaching task of the Kinarm robotic platform.19 This study also utilized the Assisting Hand Assessment (AHA) and Melbourne Assessment of Unilateral Upper Limb Functioning (MA) standardized clinical assessments, both of which primarily assess upper-limb functional motor ability. Both AHA and MA performance were positively correlated with sensorimotor network FC. By contrast, another study found no significant associations between FC and upper-limb performance using the AHA and MA suggesting mixed findings.20 Building on previous work, the present study utilized the Kinarm robotic platform to investigate associations between FC in sensorimotor pathways and proprioceptive and visuomotor function of a larger, more diverse cohort of children with AIS, PVI, and their typically developing peers.
In contrast to the previous study focused on visually guided reaching,19 we investigate multiple Kinarm tasks (position matching, kinesthesia, and visually guided reaching) to evaluate a broader range of sensorimotor functions, focusing on spatially remote regions of the sensorimotor network. Accordingly, we propose the following three hypotheses: (1) children with AIS and PVI will show lower overall interhemispheric FC between sensorimotor regions compared to healthy controls, with AIS showing lower FC than PVI; (2) PS children will exhibit lower intrahemispheric FC of sensorimotor regions in their lesioned hemisphere compared to non-lesioned, with this asymmetry more pronounced in AIS than PVI; and (3) lower FC within the sensorimotor network in children with HCP will be associated with proprioceptive and visuomotor deficits, with possible differential involvement based on stroke subtype.
Methods
Participants
This was a secondary pooled analysis of data from several prospective and observational studies.21–26 PS participants were recruited from two urban Canadian centres as part of the Alberta Pediatric Stroke Project.27 Criteria for inclusion were: (1) 6-19 years of age; (2) term birth (> 36 weeks); (3) MRI-confirmed unilateral PS (AIS or PVI); and (4) symptomatic HCP as classified by a Pediatric Stroke Outcome Measure (PSOM) motor score of ≥ 0.5.28 Exclusion criteria included severe hemiparesis (Manual Ability Classification System V), additional psychiatric or neurodevelopmental conditions, unstable epilepsy, multifocal stroke or diffuse damage, multiple strokes, MRI contraindications, or excessive head motion during the scan. Handedness was defined as being opposite to the stroke-impacted arm, or as being ipsilateral to lesion side.
A community-based program (Healthy Infants and Children’s Clinical Research Program)29 was used to recruit TDC of comparable age and sex distributions, who were all right-handed as measured by the Edinburgh Handedness Inventory.30 The left hemisphere was referred to as the dominant hemisphere for motor function in this group given their right-handedness. TDC participants had no MRI contraindications or neurodevelopmental or psychiatric conditions. Informed parental written consent and participant assent were obtained for all participants. This study was approved by the Conjoint Health Research Ethics Board at the University of Calgary (REB16-2535, REB16-2474, REB22-0303, E-23536) and the Research Ethics Board at the University of Alberta (Pro00071012).
Imaging
MRI data was acquired on a 3.0 Tesla GE MR750w scanner (GE Healthcare, Waukesha, WI, USA) with a 32-channel head coil at the Alberta Children’s Hospital. High-resolution anatomical images were obtained using a T1-weighted fast-spoiled gradient echo brain volume sequence in the axial plane (166-225 contiguous slices, 1.0 mm isotropic voxel size, repetition time [TR] = 8.5 ms, echo time [TE] = 3.2 ms, matrix = 256 x 256, duration ~5 minutes). A resting state functional MRI (rs-fMRI) sequence was obtained using 150 T2*-weighted whole brain echo planar volumes (36 contiguous axial slices, 3.6 mm isotropic voxel size, TR/TE = 2000/30 ms, total scan duration ~5 minutes). During rs-fMRI scanning, participants were instructed to focus on a cross in the center of their vision.
Lesion Mapping
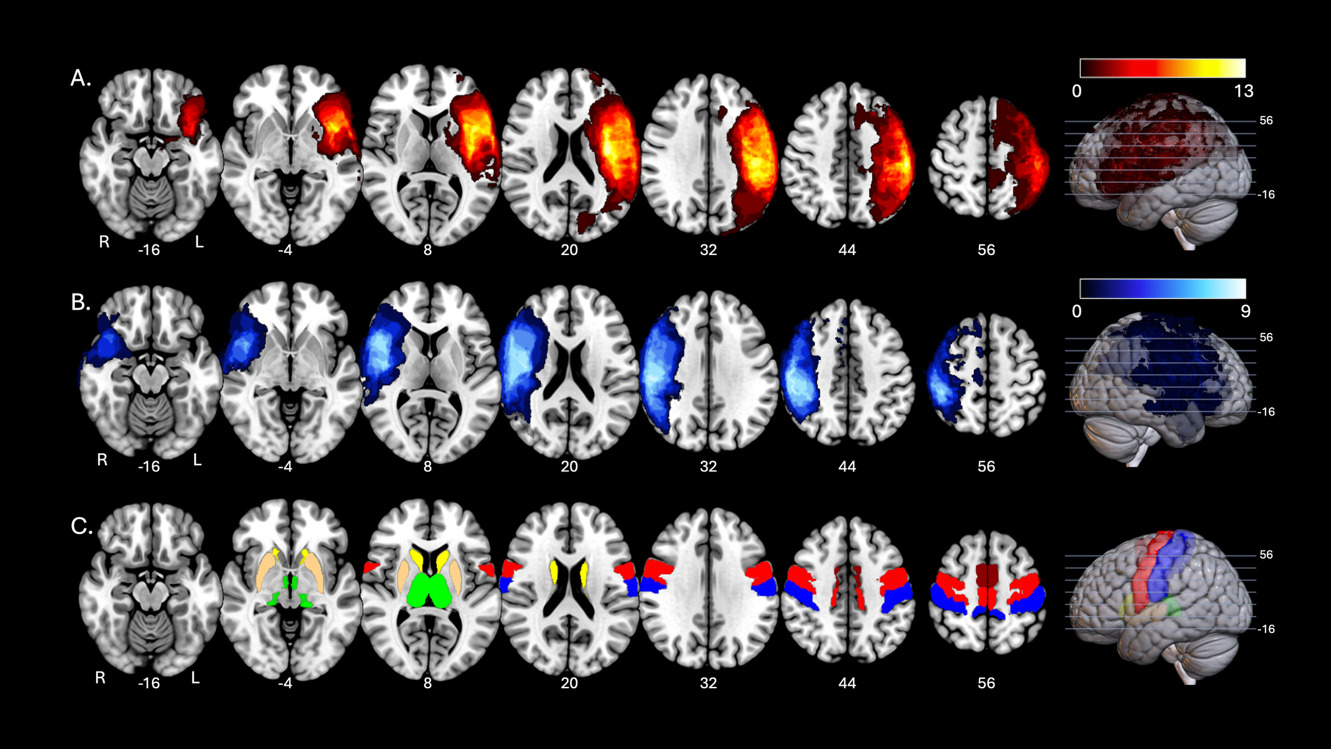
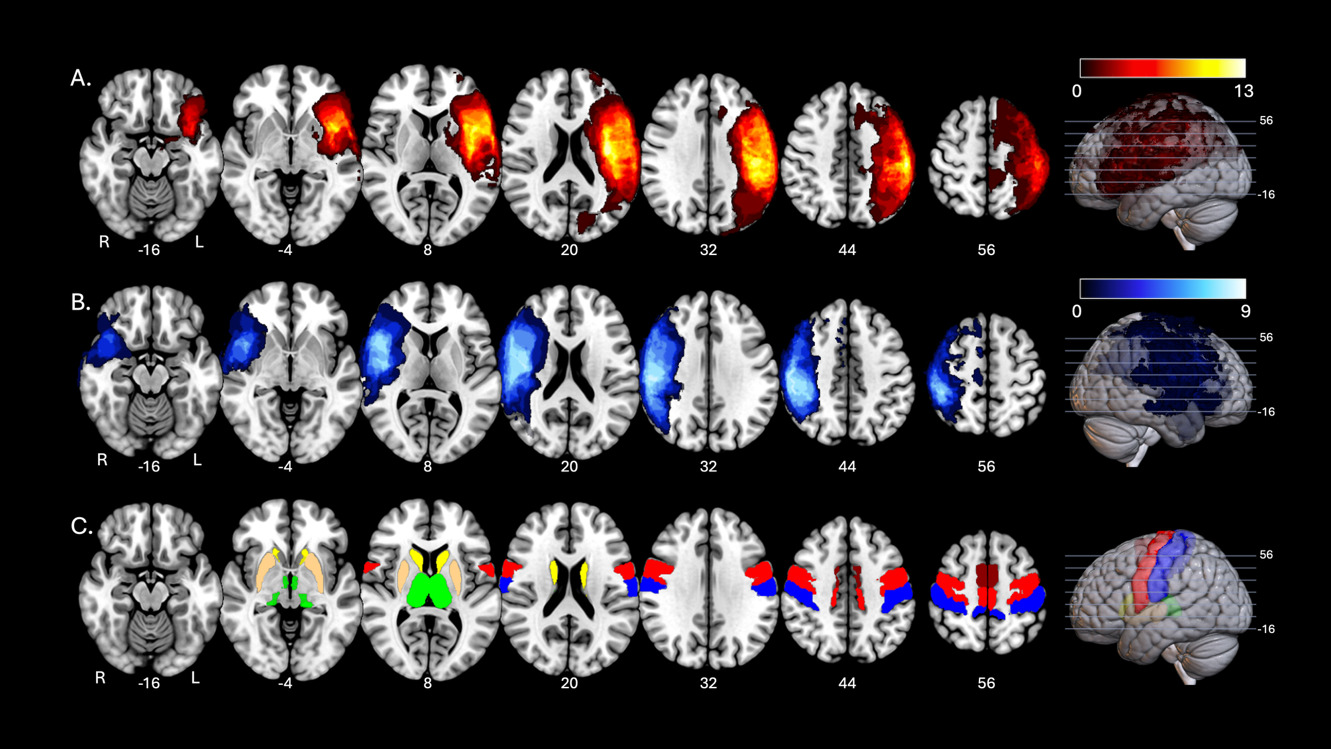
Lesion size was measured on the T1-weighted scans of participants with AIS. Each scan was viewed in MRIcron,31 and the 3D fill function was applied to regions of cerebrospinal fluid (CSF) occupying the infarct cavity. The borders were determined by voxel intensity, with dark CSF contrasted from the brighter grey or white matter. The resulting binary masks were smoothed with a 2 mm kernel (threshold = 0.5), and lesion volumes were calculated (in cm3).32 For group-level visualization of lesion distribution and overlap, the masks were spatially normalized to MNI standard space using the Normalize function in SPM12 (Wellcome Centre for Human Neuroimaging, London, UK) implemented in MATLAB 2019a (The MathWorks, Inc., Natick, MA, USA). The standardized binary masks were overlayed on the MNI152 standard T1 template in MRIcroGL31 as a heatmap for visualization (Figure 1).
Resting State fMRI
Resting state fMRI data was analyzed using the CONN functional connectivity toolbox,33 an SPM12-based toolbox running via MATLAB R2021 (The MathWorks Inc.). Preprocessing was completed using the standard CONN pipeline (slice timing correction, realignment, co-registration, denoising, and calculation of 12 head motion parameters). Standard SPM tissue probability maps were used to automatically segment the co-registered images into different tissue types (gray matter, white matter, and CSF). Each slice underwent manual review to ensure that lesioned areas were correctly identified and labelled. The standard 152-average template was used to normalize images into MNI space and smooth with a 6 mm isotropic full-width at half-maximum Gaussian kernel. Outliers were identified using the Artifact Repair Toolbox34 with global mean signal greater than z = 5 or exceeding 0.9 mm of translational movement. Identified outlier volumes, as well as CSF and white matter time courses were de-weighted in the general linear model. Outliers were inspected for each participant, and participants were excluded from further analysis if they had > 50 volumes with excessive motion out of the 150-volume scan.
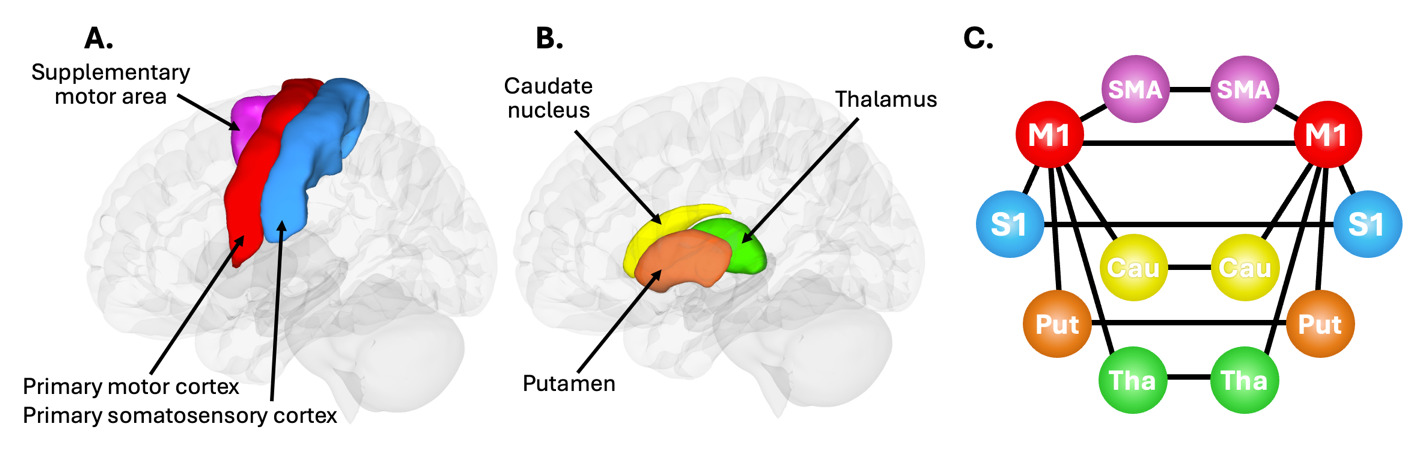
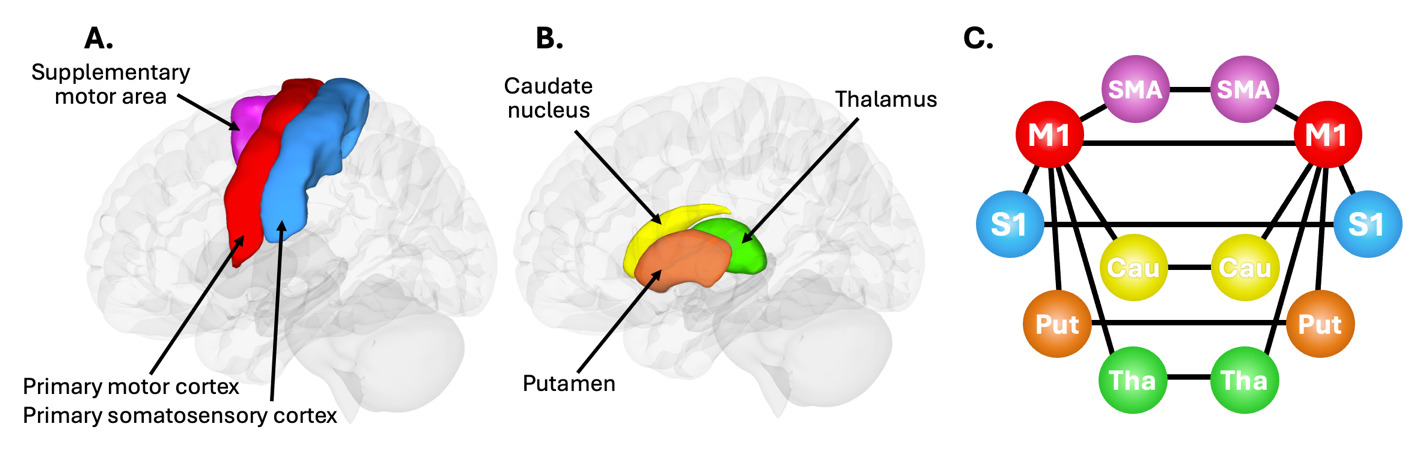
Seed-to-seed FC was measured between each primary motor cortex (M1) and five ipsilateral seeds of interest (Figure 2) including the primary somatosensory cortex (S1), supplementary motor area (SMA), thalamus, caudate nucleus, and putamen because of their central roles in the cortico-basal ganglia-thalamocortical sensorimotor network.35–38 This a priori selection of relevant regions of interest (ROIs) primarily focused on cortical and subcortical regions involved in the sensorimotor circuit of interest. The cerebellum was therefore not included despite its role in sensorimotor function. The SMA was included in our exploratory group and hemispheric FC comparisons because of its known role in motor planning and bilateral coordination.39 However, the SMA was excluded from correlational analyses due to its inconsistent involvement in proprioceptive and visuomotor processing relative to primary somatosensory regions.40–42 Interhemispheric connections between left and right hemispheres for each ROI were investigated, as well as intrahemispheric connections consisting of M1 to thalamus, caudate nucleus, and putamen. These connections were selected due to the interconnected cortical, basal ganglia, and thalamic circuits involved in sensorimotor pathways in the brain.36,43 FC values were represented as the weighted bivariate Fisher-transformed Pearson correlation coefficients resulting from the temporal cross-correlation analysis between each seed pair.
The number of resting state volumes included after scrubbing for each participant was compiled. Head motion was quantified for each participant by calculating mean framewise translational and rotational distances (mm) from the CONN realignment parameter file using an in-house MATLAB script. Differences between sequential frames were calculated for translational movement and Euclidean distances (in mm) were extracted using the formula: translational distance = sqrt(Δx2 + Δy2 + Δz2). For rotational movement, differences between sequential frames were calculated and Euclidean distances extracted as above, then were converted to mm using a 50 mm radius metric using the formula: rotational distance = 50 * sqrt(Δyaw2 + Δpitch2 + Δroll2).44 Mean (SD) values were subsequently calculated for each participant group.
Sensorimotor Function
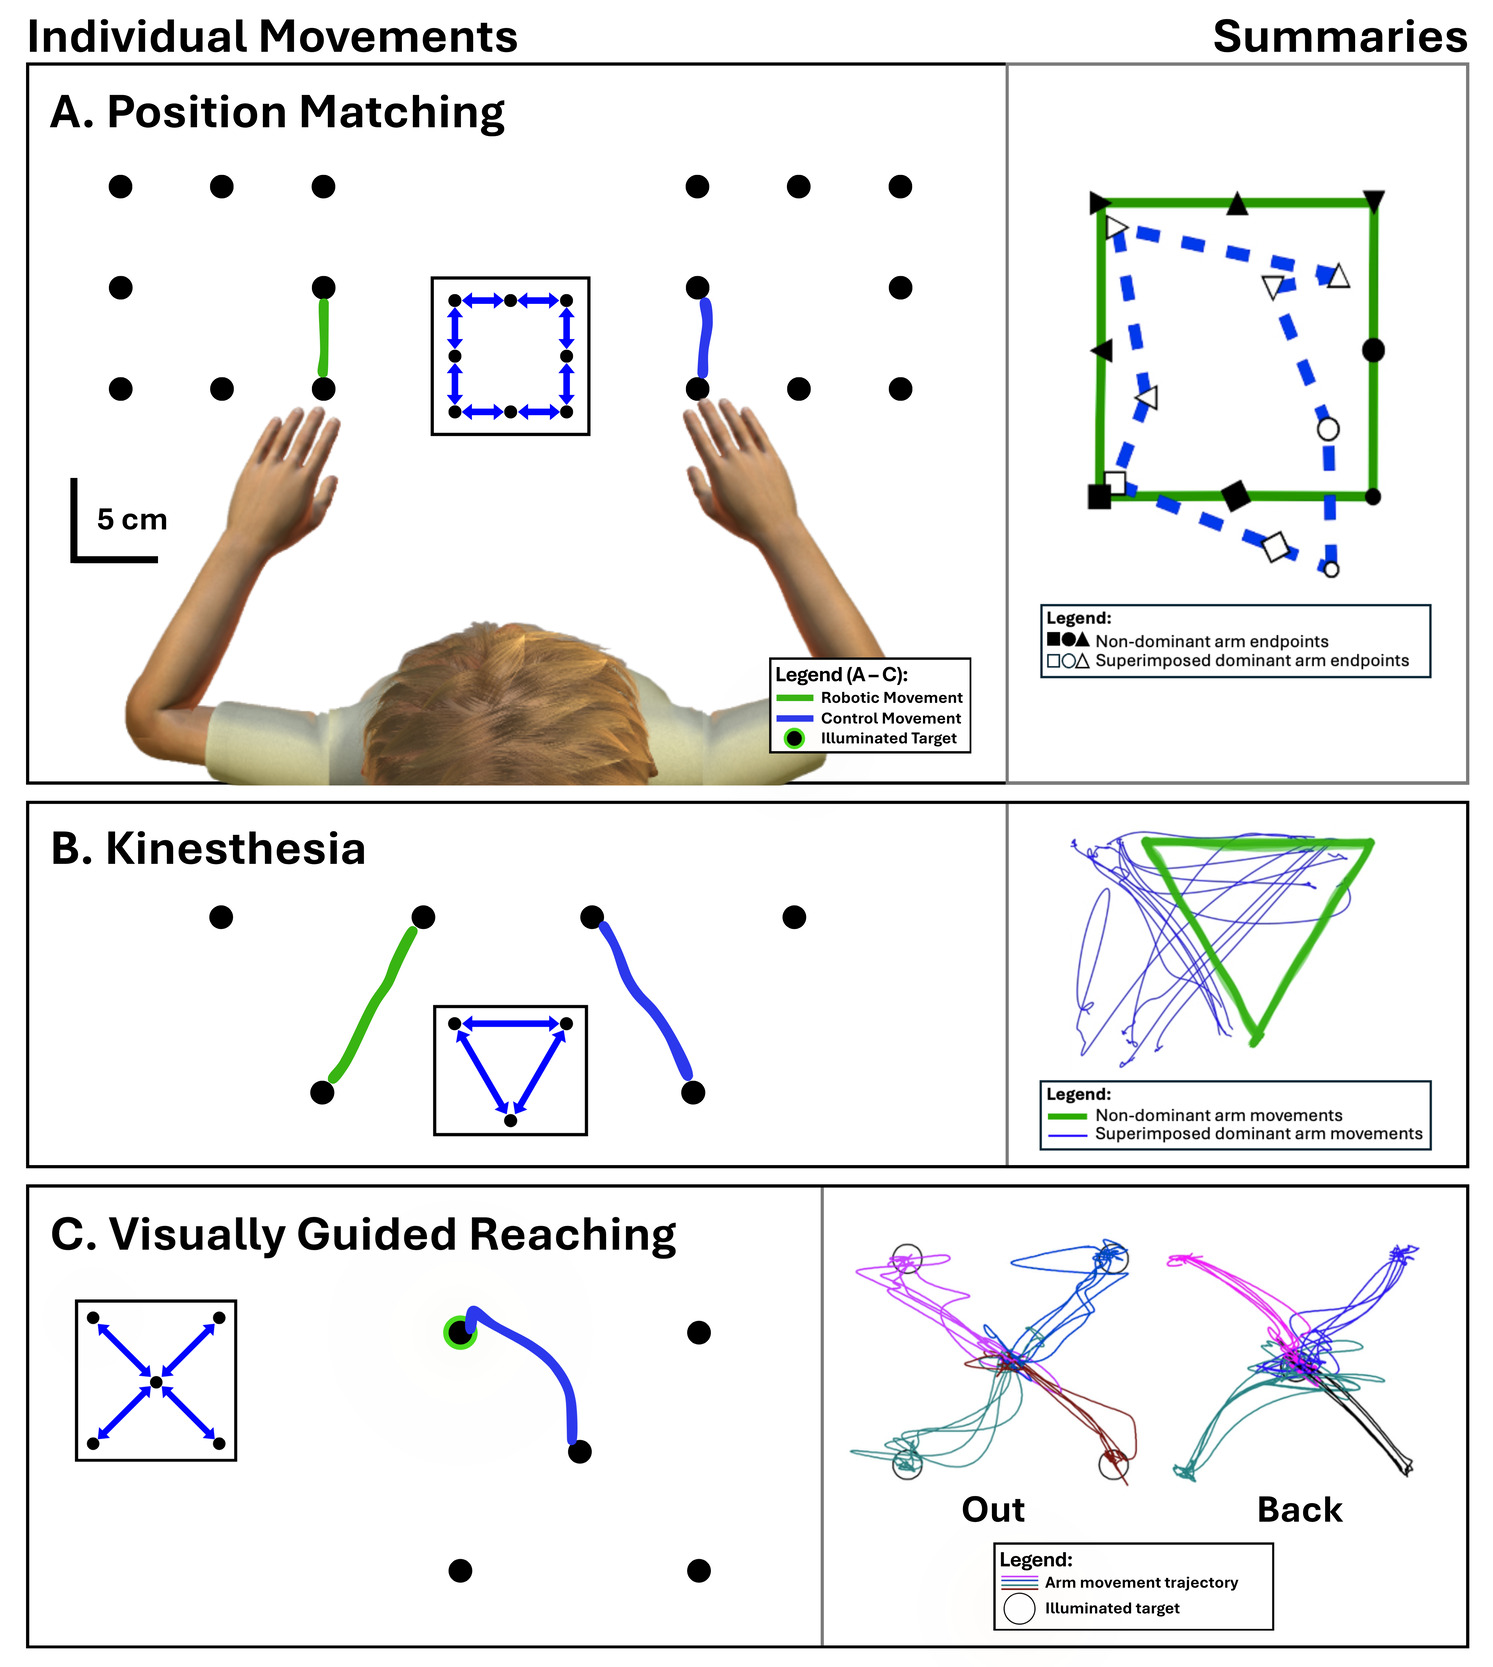
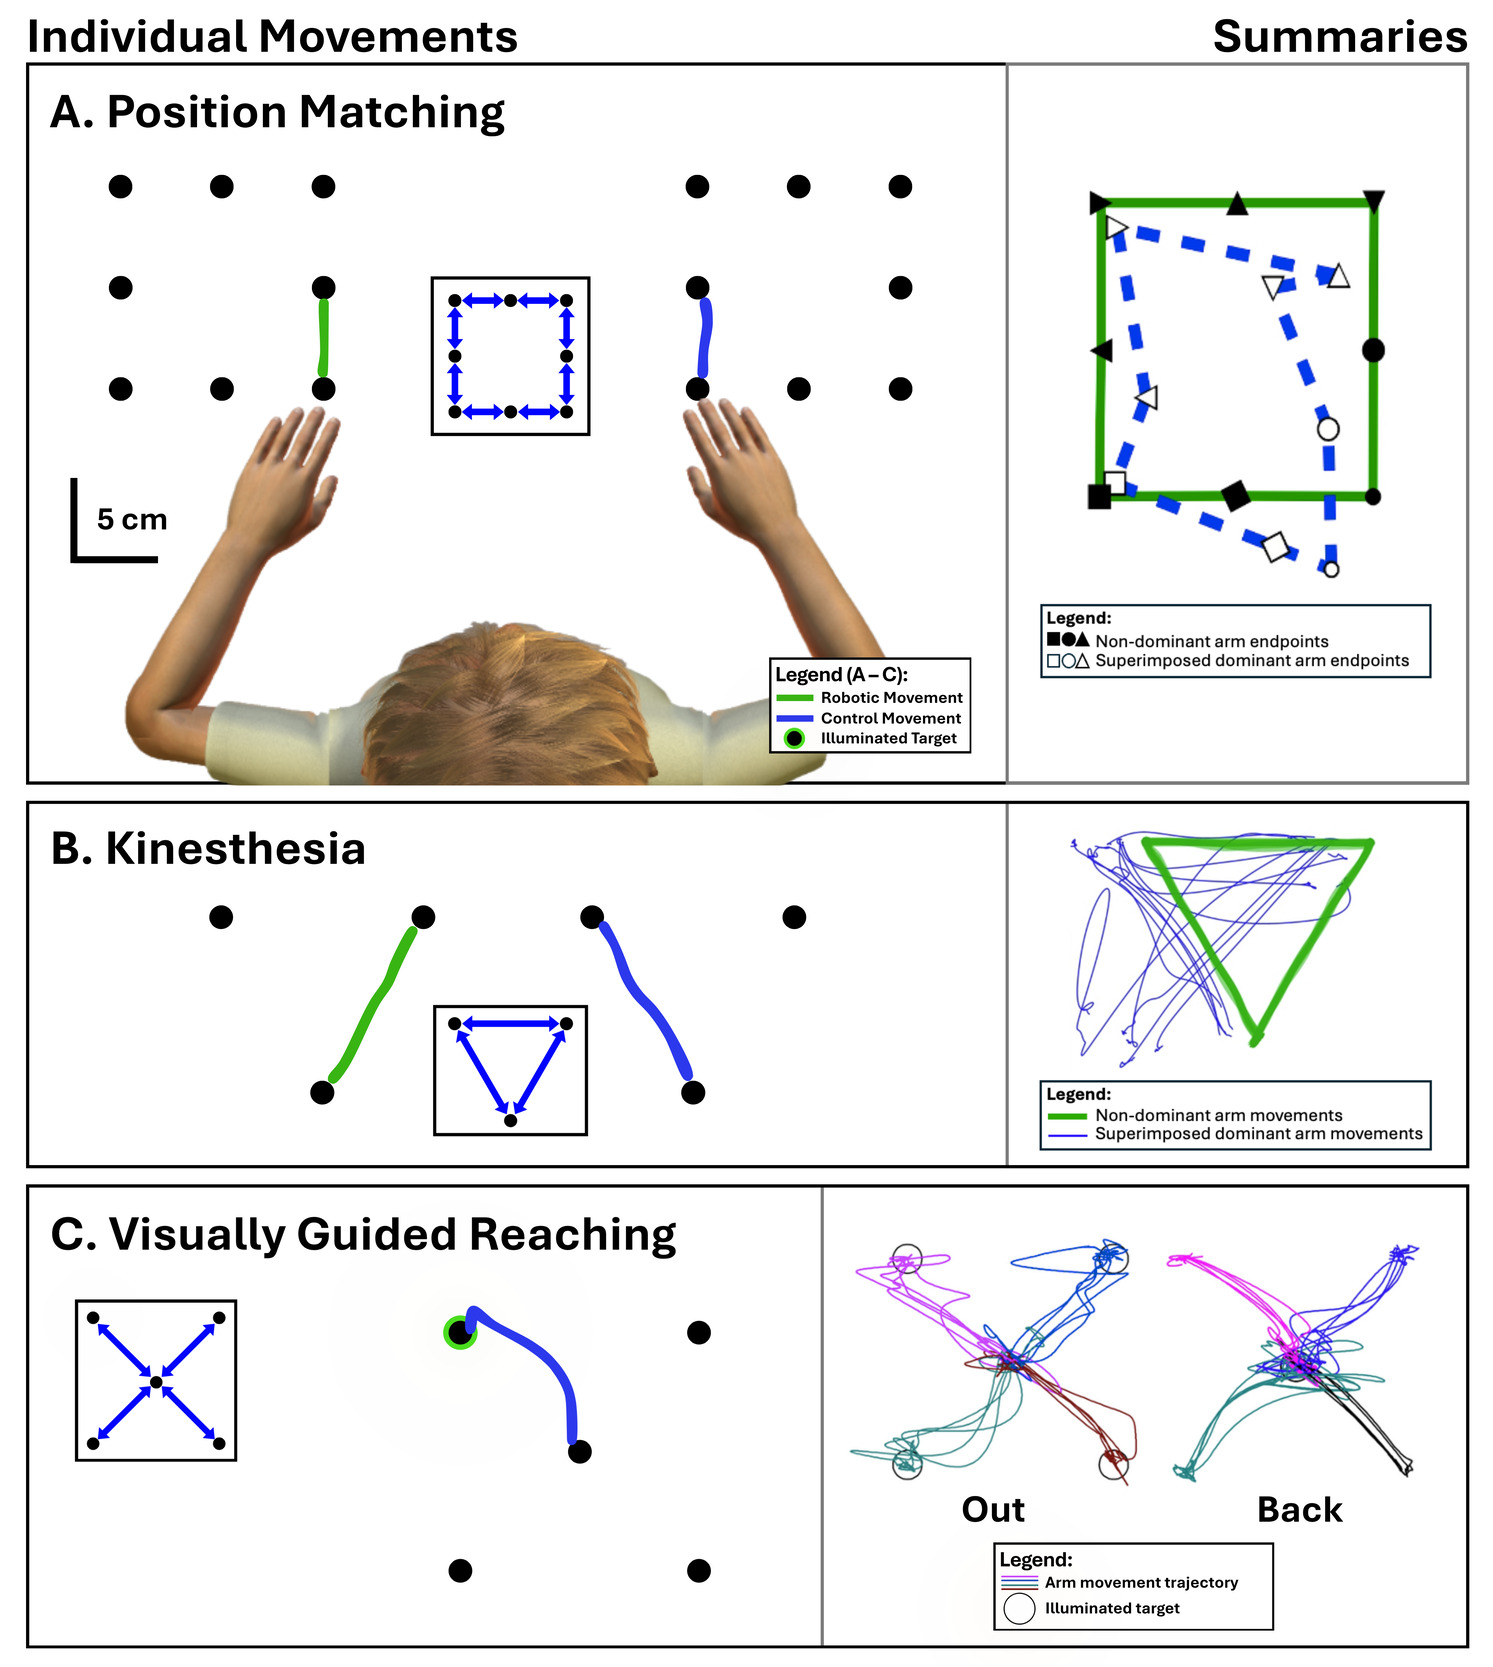
The Kinarm exoskeleton robot was used to assess sensorimotor function (Figure 3A). The standardized, validated sensorimotor tasks include position matching, kinesthesia, and visually guided reaching. Given the large catalogue of task variables available, we selected a representative subset to minimize multiple comparisons. These were prioritized based on theoretical relevance and ability to capture distinct aspects of task performance (posture control, visual reaction, first movement, corrective movement, and total movement). All tasks reported here were completed with vision.
Position Matching
This task assesses limb position sense and has been used in both stroke-impacted and healthy children.13,15 The Kinarm robot moved the participants’ non-dominant (stroke-affected) arm in a linear path to one of nine pseudorandomized spatial locations 6 cm apart (Figure 3A). Participants were then asked to move their dominant hand to mirror the location of the non-dominant arm and indicate a completion to initiate the subsequent trial. Fifty-four trials were completed. Performance was quantified for each trial using previously described parameters13:
-
Variability (Varxy): The mean standard deviation for the dominant arm’s final position in matching the position of the non-dominant arm (cm).
-
Spatial contraction/expansion (Cont/Expxy): The range/area of the movement completed by the dominant arm (> 1 indicates expansion, < 1 indicates contraction).
-
Systematic shifts (Shiftxy): The consistent differences in error between dominant and non-dominant arm across target locations (cm).
These three measures reflect aspects of proprioceptive perception: precision, spatial scaling, and directional accuracy of perceived limb position respectively. Deficits on these tasks could reflect trial-to-trial inconsistencies in arm positioning (precision variability), distortions of their perceived workspace (spatial scaling and/or shift), or errors between positioning of dominant and non-dominant arms (accuracy).45
Kinesthesia
This task assesses upper limb motion sense (kinesthesia) in both stroke-impacted and healthy children.17,46,47 The Kinarm robot moved the participant’s non-dominant (stroke-affected) arm in a linear path to one of three locations 12 cm apart (Figure 3B). Participants were presented with a red circle opposite to their non-dominant index finger (mirrored across the midline) and a white circle representing the participant’s index finger on their dominant arm. Participants were instructed to move the white circle into the red circle with their dominant index finger which initiated the trial and the circles were extinguished. The robot then moved the participant’s arm to one of the other two positions at a peak speed of 0.28 m/s. Immediately as the movement began, participants were instructed to mirror-match the speed and direction of the movement with their dominant arm. Thirty-six trials were completed. Performance was quantified using previously described parameters47:
-
Response Latency (RL): The movement onset time difference between non-dominant and dominant arms (s).
-
Peak Speed Ratio (PSR): The ratio between maximum hand speed of non-dominant and dominant arms (> 1 indicates faster, < 1 indicates slower).
-
Initial Direction Error (IDE): The absolute angular deviation at peak hand speed between the non-dominant and dominant arms (degrees).
-
Path Length Ratio (PLR): The ratio between the total movement length of the dominant arm and the length moved by the non-dominant arm (> 1 indicated larger, and < 1 indicated smaller).
These measures capture the speed, accuracy, and efficiency of proprioceptive-guided movement which indicates the ability of a participant to translate perceived limb position into motor output. Deficits on these tasks could reflect dysfunction in reproducing the speed and direction of a movement using sensation derived from the stroke-affected arm to signal and drive movement of the opposite arm.47
Visually Guided Reaching
This unimanual task measures upper-limb visuomotor ability in both stroke-impacted and healthy children.16,48,49 The participant was instructed to quickly and accurately reach one of four peripheral targets 10 cm from a central position as they illuminated (Figure 3C). The Kinarm robot did not provide any assistance to the participant in completing the reach. Starting with the participant’s dominant arm and followed by the non-dominant arm, targets were presented in a pseudorandomized manner for a total of 25 trials each. Performance was quantified using previously described parameters48:
-
Postural Hand Speed (PS): The resting mean hand speed for 0.5 s before the illumination of a peripheral target (cm/s).
-
Reaction Time (RT): The time between peripheral target illumination and initial movement onset (s).
-
IDE: The absolute angular deviation between a straight line from the initial and final positions, and the path between movement onset and the first hand speed maximum (degrees).
-
Speed Maxima Count (SMC): The number of movement speed peaks between the start and end of the movement.
-
Movement Time (MT): the elapsed time from movement onset to offset (s).
-
Maximum Hand Speed (MHS): The highest speed that the hand travelled across trials (cm/s).
These measures capture multiple dimensions of visuomotor control, including postural stability, processing speed, accuracy, motion steadiness, and raw motor output. Deficits on these measures could reflect dysfunction in hand stabilization, initiating movements, correcting movements, or multi-joint coordination.48
Statistical Analyses
Statistical analyses were completed using Jamovi (version 2.6.26.0 for MacOS, Sydney Australia).50 Distribution normalities for age and all outcome variables were assessed using Shapiro-Wilk tests. Age was normally distributed, and variables violating normality were analyzed using non-parametric methods. Spatial contraction/expansion, peak speed ratio, and path length ratio were expressed as ratios centered at 1 (indicating no error). To symmetrize proportional deviations around unity and reduce skew, ratio measures were natural log-transformed prior to analysis, and the absolute value was used since they functioned as measures of error in this study. A one-way analysis of variance (ANOVA) was used to compare age between groups and Chi-square tests were used to compare sex and lesion side proportions. Head motion parameters and number of resting state volumes included were compared between groups using a Kruskal-Wallis one-way ANOVA. Mixed-design analyses of covariance (ANCOVAs) (controlling for age) were conducted to assess group differences in interhemispheric FC (hemisphere * group interaction) and robotic-assessed proprioceptive and visuomotor performance; Tukey’s honestly significant difference test was applied for post-hoc pairwise comparisons to correct for multiple testing within each ANCOVA and Levene’s test for homogeneity of variances was conducted to assess whether variances differed between groups. To characterize individual-level performance, normative reference ranges were established for outcome parameters using the TDC group. Individuals were classified as ‘failing’ a parameter if their score exceeded the normative reference limit based on whether higher values represented better or worse performance (i.e., mean + 1.645 * SD if higher = worse). Normative cutoffs for classifying task failure were defined as the upper 95th percentile of the TDC distribution (i.e., the threshold below which ~95% of the TDC participants fell). Hemispheric differences in FC within groups were assessed by repeated measures ANCOVAs (covarying for age), followed by Tukey-corrected pairwise post-hoc analyses. Effect sizes are quantified via Cohen’s d. Partial correlation analyses (controlling for age) were performed to assess associations between FC metrics, proprioceptive, and visuomotor performance outcomes (Pearson’s r or Spearman’s ρ as appropriate according to distribution normality). Multiple comparisons across correlation analyses were controlled using family-wise false discovery rate (FDR) corrections.51 Analyses were focused on non-dominant visually guided reaching (VGR) performance given the study’s focus on impaired proprioceptive and visuomotor performance and its correlations with connectivity.
Results
Population
From the initial sample (N = 124), seven participants were excluded due to excessive head motion during scanning and five due to inaccurate tissue segmentation. After all exclusions, the final sample comprised 112 participants (AIS = 33, PVI = 36, TDC = 43), as described in Table 1. Age, sex, and stroke side did not differ between groups. Task-specific participation was slightly lower than our total sample of 112, with 11 participants who did not complete the position matching task (AIS = 28, PVI = 36, TDC = 37), and 11 who did not complete the kinesthesia task (AIS = 27, PVI = 36, TDC = 38). These participants were not included in the corresponding correlation analyses. Resting state fMRI head motion parameters (translational and rotational movements) and number of resting state volumes included after scrubbing were not different between the three groups and are also found in Table 1.
Seed-to-Seed Analyses
Differences in Interhemispheric Functional Connectivity Between Groups
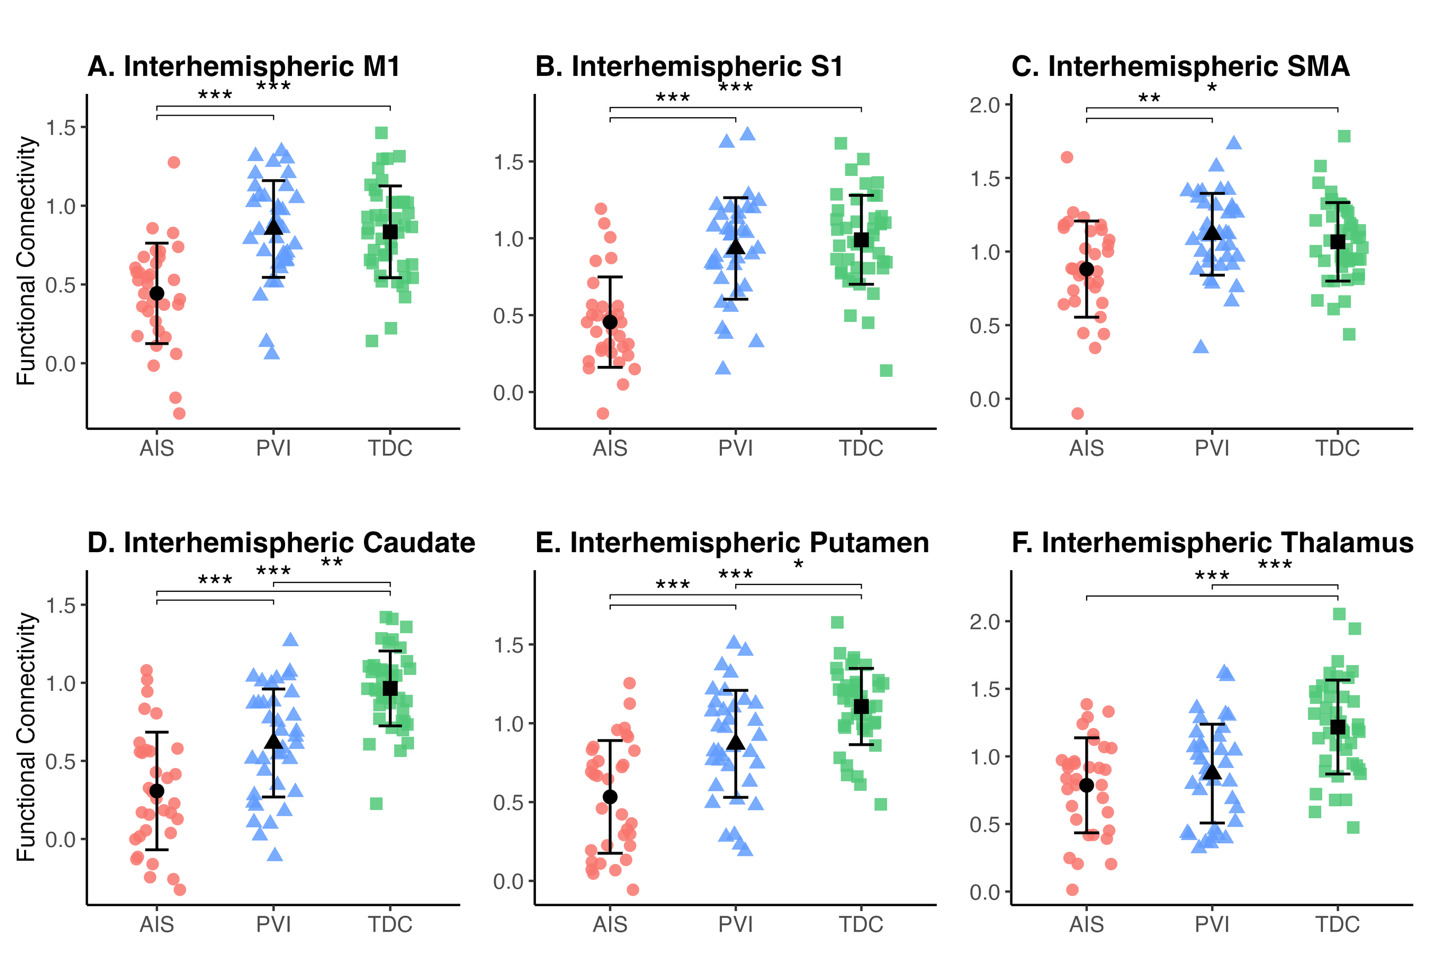
Results showed significant group differences in interhemispheric connectivity across all six cortical and subcortical regions measured, all of which are putatively involved in sensorimotor function (Figure 4).
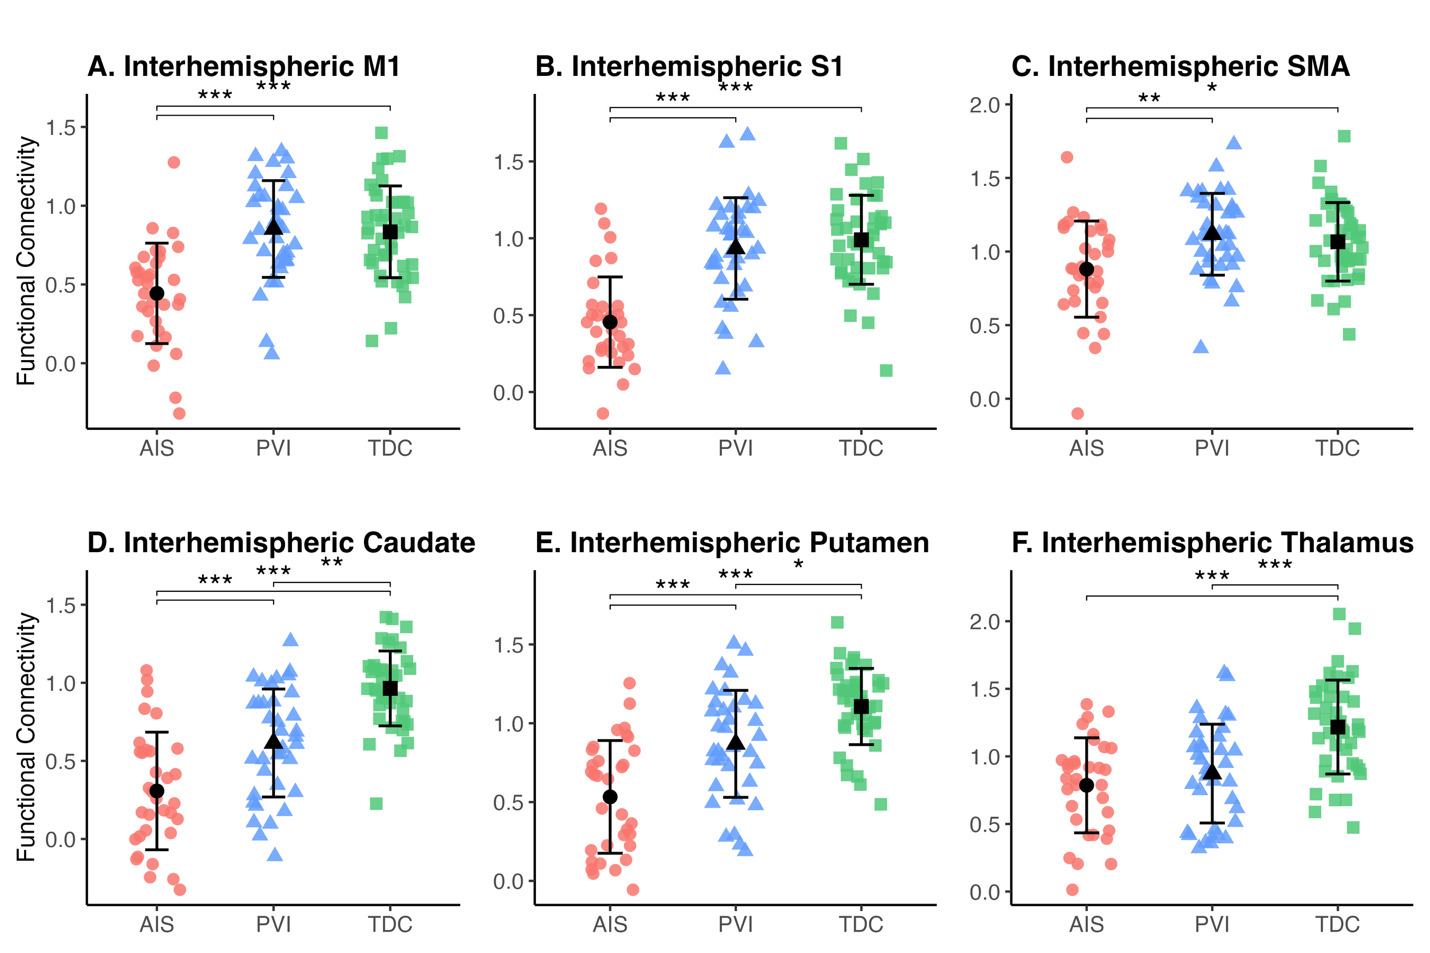
Participants with AIS showed significantly lower interhemispheric FC in M1, S1, SMA, caudate, and putamen compared to participants with PVI (all p < .004). There was no difference present in interhemispheric thalamic FC between AIS and PVI groups. Compared to TDC, participants with AIS showed lower interhemispheric FC in all six regions: M1, S1, SMA, caudate, putamen, and thalamus (all p < .014). Conversely, participants with PVI only showed lower interhemispheric FC compared to TDC for the subcortical regions, including the caudate, putamen, and thalamus (all p < .018), with no difference present for the three cortical regions. For complete results see Table 2.
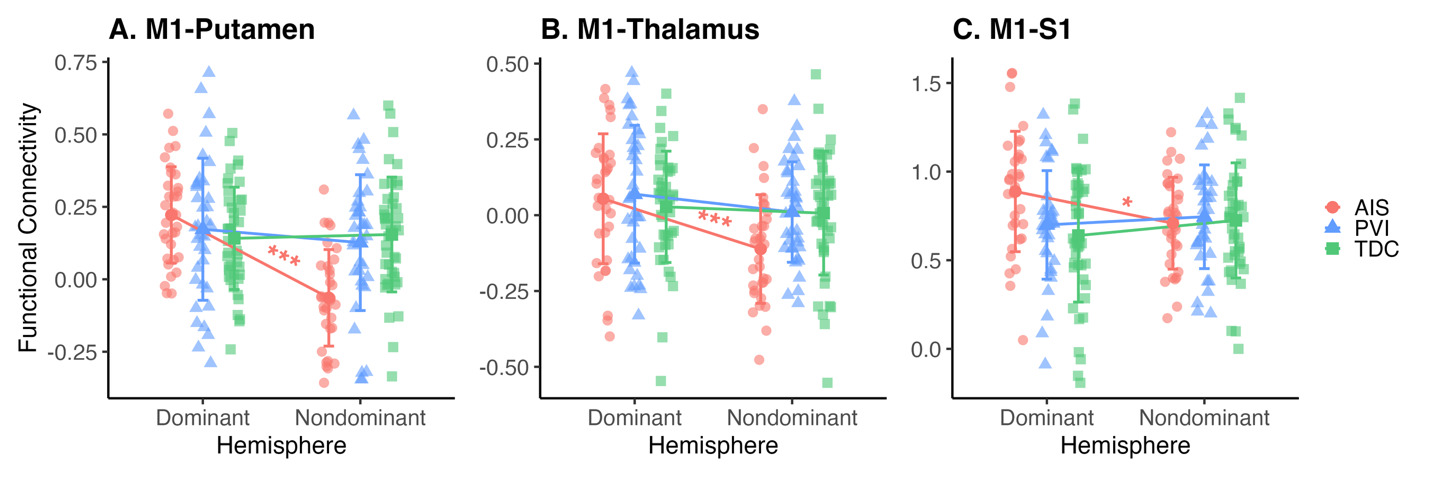
We found a significant interaction between hemisphere and stroke type for three out of the four connections examined: M1-Putamen (F(2, 108) = 17.45, p < .001), M1-Thalamus (F(2, 108) = 4.61, p = .012), and M1-S1 (F(2, 108) = 7.27, p < .001), but not for M1-Caudate (F(2, 108) = 1.02, p = .365) (Figure 5).
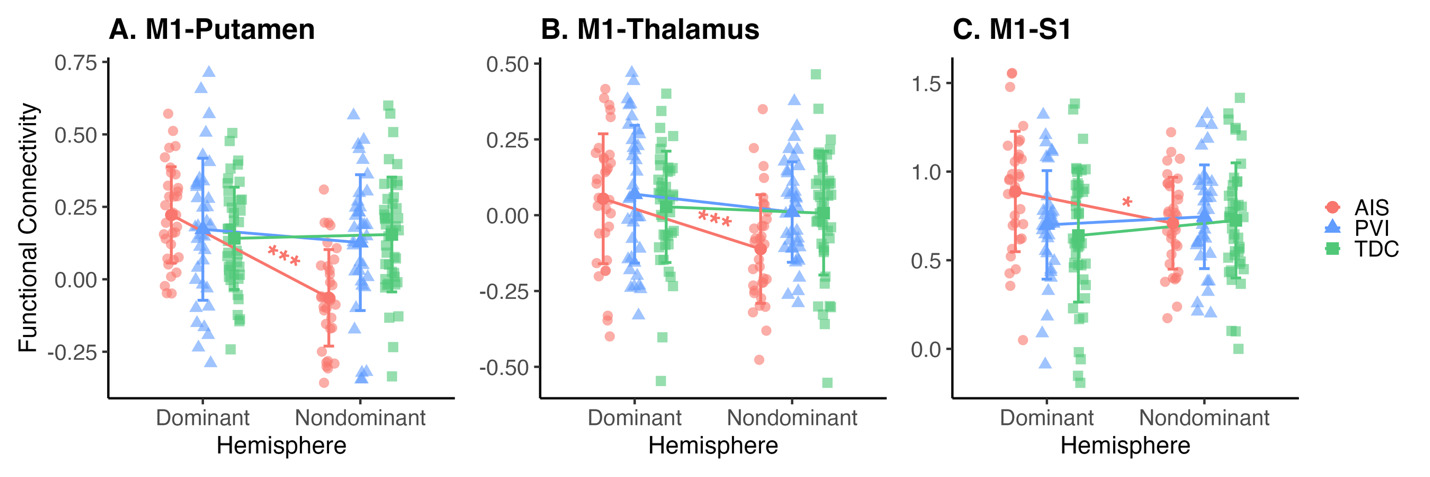
Further post-hoc analyses (Figure 5) revealed that FC was higher in the dominant, non-lesioned hemisphere compared to the non-dominant, lesioned hemisphere in children with AIS (p < .001) for the connection between M1 and the thalamus. The lesioned hemisphere in children with AIS also indicated lower FC compared to the non-lesioned hemisphere for the intrahemispheric connection between M1 and the putamen (p < .001). Finally, the same pattern of lower FC in lesioned versus non-lesioned hemisphere persisted in the connection between M1 and S1 for children with AIS (p = .018). For complete results see Table 3.
Children with PVI did not show any intrahemispheric differences for the examined regions, and no other significant intrahemispheric differences were found.
Behaviour Analyses
Differences in Kinarm Task Outcomes Between Groups
Participants with AIS showed poorer proprioceptive and visuomotor function for 12 out of the 13 outcome measures we analyzed across all three Kinarm tasks, compared to controls (all p < .039; Table 4). The one outcome in which individuals in the AIS group was not different was postural hand speed for VGR. PVI participants demonstrated deficits in proprioceptive and visuomotor functioning compared to controls in 9 out of 13 measures (all p < .023; Table 4). The four outcomes that were not different compared to controls include spatial contraction/extraction and shift for position matching (PM), and postural hand speed and maximum hand speed for VGR. Thus, both stroke groups showed extensive differences in both proprioceptive and visuomotor functioning compared to controls. No comparisons in performance between AIS and PVI groups survived FDR correction. Levene’s test indicated significant heterogeneity of variances between groups for 10 of the 13 measures (all p < .024), with the exception of VGR postural hand speed, reaction time, and speed maxima count; controls showed smaller variances across significant measures (Table 4).
Approximately 95% of controls failed ≤ 1 parameter for PM and Kinesthesia (KIN) tasks, and ≤ 2 parameters for the VGR task. Compared to TDC, both AIS and PVI groups showed greater proportions of failing parameters and thus failing tasks (see Supplementary Figure S1). Using these normative cutoff ranges for task failure, 57.5% of AIS participants and 30.5% of PVI participants failed the PM task. For the KIN task, 54.6% of AIS and 47.2% of PVI failed, while 27.2% of AIS and 30.6% of PVI failed the VGR task.
Associations between Functional Connectivity and Kinarm Tasks
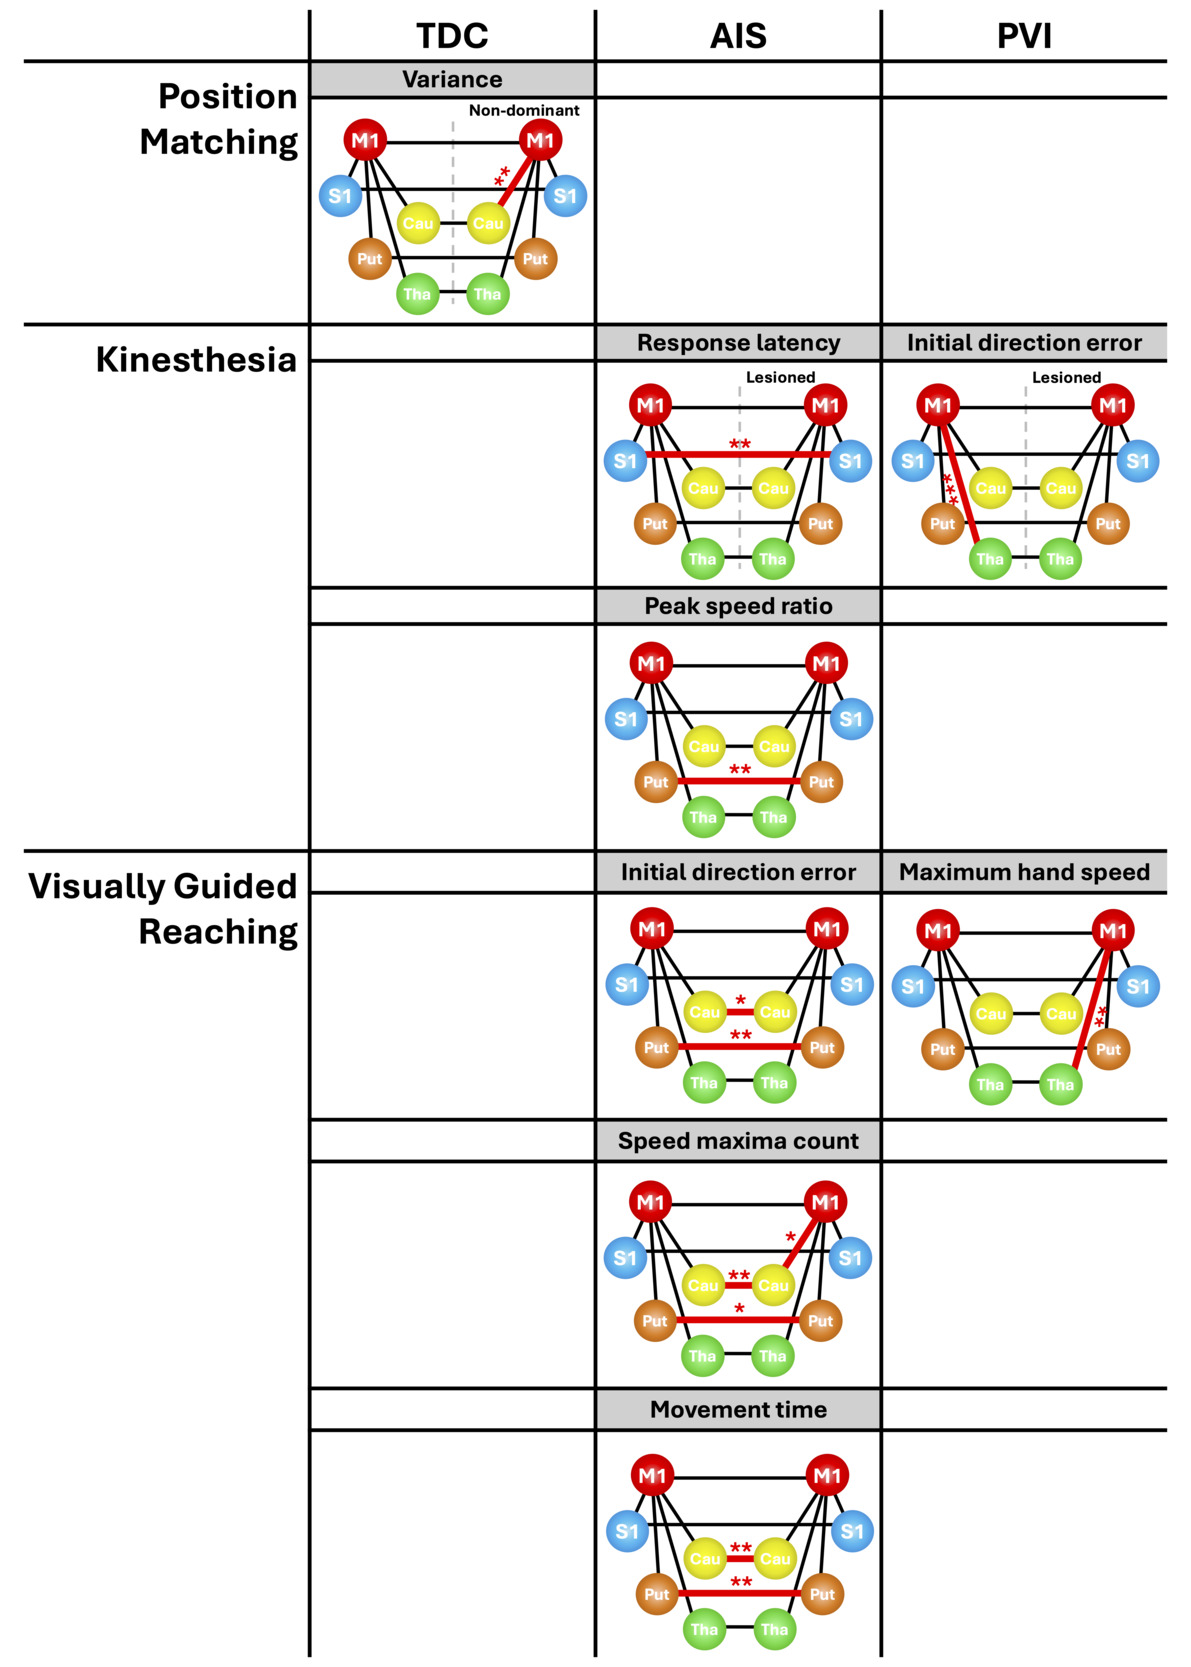
A summary of the results of FC and sensorimotor function correlations are depicted in Figure 6.
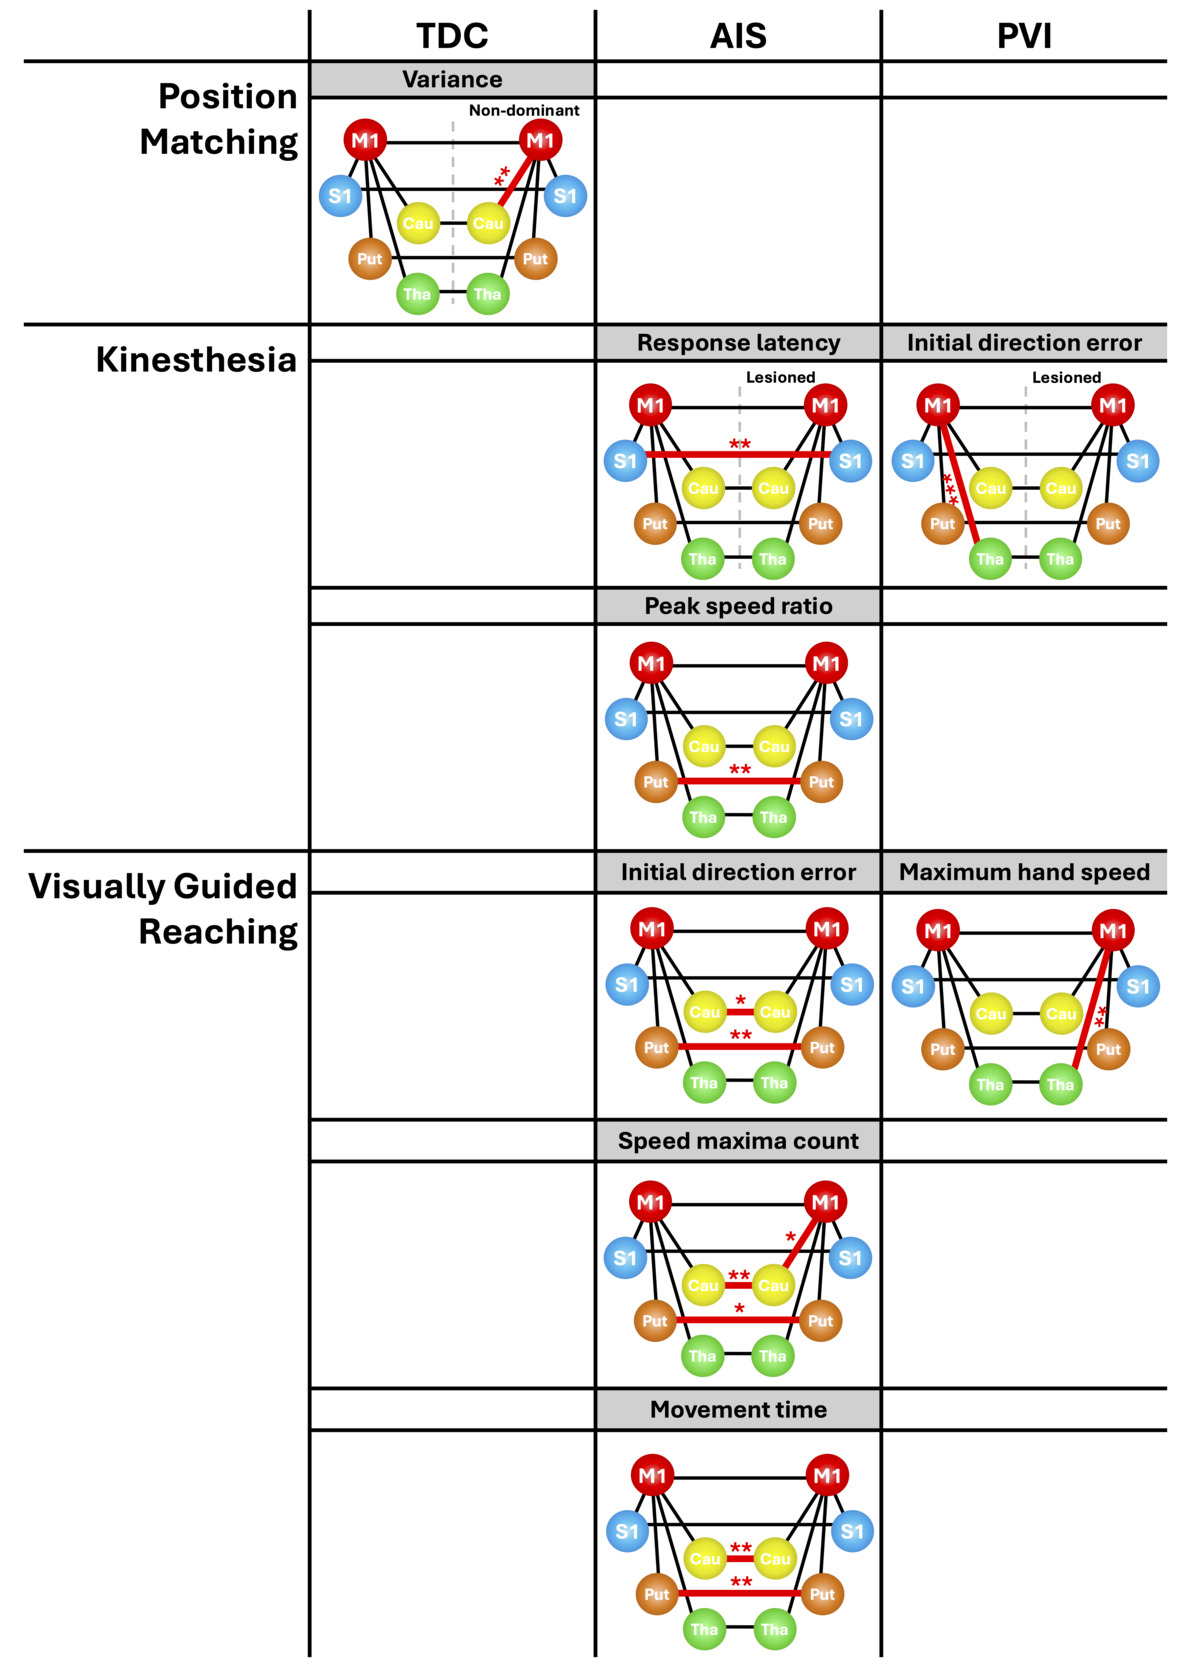
Out of the three outcome measures for the PM task, variability was positively correlated with FC between M1 and the caudate nucleus (r = 0.46, p = .004) in the TDC group. The other two outcomes; spatial contraction/expansion and shift were not correlated with FC. This indicates that cortico-striatal connectivity may support proprioceptive precision in typical development, but not in PS groups for this task.
For the KIN task, participants with AIS exhibited a negative correlation between interhemispheric S1 FC and response latency (ρ = -0.59, p = .002), and a negative correlation between interhemispheric putamen FC and peak speed ratio (ρ = -0.68, p < .001). Initial direction error was positively correlated with FC between the M1 and the thalamus (ρ = 0.617, p < .001) in children with PVI, and path length ratio did not show any correlation with FC. Thus, connectivity patterns associated with KIN performance revealed distinct patterns between the stroke groups that were absent in controls, suggesting injury-related network reorganization despite similar functional deficits (i.e., HCP).
For the VGR task, in children with AIS, interhemispheric putamen FC was negatively correlated with non-dominant initial direction error (ρ = -0.46, p = .009), speed maxima count (ρ = -0.43, p = .013), and movement time (ρ = -0.49, p = .005). Interhemispheric caudate FC in children with AIS showed a similar pattern and was also negatively correlated with non-dominant initial direction error (ρ = -0.44, p = .012), speed maxima count (ρ = -0.48, p = .006), and movement time (ρ = -0.50, p = .004). Non-dominant speed maxima count was negatively correlated with FC between M1 and the caudate in the non-dominant hemisphere (ρ = -0.41, p = .020) in children with AIS. Lastly, participants with PVI showed a positive correlation between the FC between non-dominant M1 and thalamus and maximum hand speed (ρ = 0.46, p = .005) of VGR. These findings indicate that lower striatal FC was associated with poorer visuomotor performance across measures in AIS, while in PVI, a single thalamocortical association with maximum hand speed indicated poorer performance. These patterns were not present in TDCs, suggesting reorganization relates to functional deficits in both PS groups. Exploratory analyses of dominant hand VGR performance did not reveal significant correlations with sensorimotor network FC. Similarly, analyses of non-dominant postural hand speed and reaction time showed no significant correlations with FC.
Discussion
We quantified FC among sensorimotor brain regions for children and youth with AIS, PVI, and TDC and examined correlations with proprioceptive and visuomotor function. We observed that our perinatal stroke sample showed lower connectivity among sensorimotor areas compared to controls, with the most prominent of these disruptions occurring in interhemispheric connectivity. Within-hemisphere connectivity differences were also present in AIS, but not in PVI. Associations between FC and sensorimotor performance were found for more tasks in AIS compared to PVI. These associations in the AIS group also appeared to be primarily for interhemispheric FC over intrahemispheric. This suggests distinct connectivity patterns across stroke subtypes that have functional implications. In PVI, associations were more limited and centered on thalamocortical connections, consistent with periventricular white matter pathology. These findings highlight the role of sensorimotor connectivity in the brain, how it is potentially disrupted after PS, and suggest that AIS and PVI may disrupt sensorimotor function through distinct disease-specific mechanisms. Such impairments have implications for activities of daily function after perinatal stroke and may inform rehabilitation strategies.
Seed-to-seed Analyses
Interhemispheric FC in sensorimotor networks is increasingly seen as an important marker of motor function after PS.19 Recent studies in children with stroke show differing interhemispheric connectivity patterns between AIS and PVI, which has significant implications for improving our understanding of network (re)organization after early injury and help to target better intervention depending on lesion location. Steiner et al.52 showed that pediatric participants with hemiparesis following AIS had significantly weaker interhemispheric connectivity between motor areas, including M1 and the premotor cortex, compared to individuals with less motor impairment. These findings are consistent with another study observing lower interhemispheric FC in sensory regions associated with motor impairments, highlighting that S1 connectivity paired with M1 connectivity may explain greater variation in motor outcomes beyond M1 connectivity alone.53 Our results echo these findings, indicating that participants with perinatal stroke had lower interhemispheric connectivity across multiple sensorimotor areas compared to controls.
Interestingly, we additionally demonstrated that the pattern of disruption differed between stroke subtypes. Specifically, we showed that PVI primarily showed deficits restricted to subcortical regions (i.e., putamen, thalamus, caudate nucleus) compared to the AIS group that showed deficits in all measured cortical and subcortical sensorimotor regions. These altered connectivity patterns are consistent with differences in stroke mechanisms, lesion localizations, and developmental timing between stroke subtypes, which may differentially shape neuroplastic reorganization. In PVI, alterations in FC between subcortical structures may result from a combination of direct damage to periventricular portions of the corticospinal tracts as well as secondary diaschisis resulting from this periventricular white matter damage projecting to subcortical areas.54,55 Conversely, AIS can cause direct cortical and subcortical damage through infarction in the middle cerebral artery56 though may also show secondary diaschisis reflected as areas of remote damage.57,58 Consistent with these disease-specific findings, other studies show no significant differences in network connectivity between PVI and controls in cortical regions, but more widespread cortical and subcortical differences between AIS and controls.19,59,60 The role of subcortical structures like the thalamus and basal ganglia are particularly important and potentially mediate motor deficits observed in HCP youth, as they are suggested to play crucial roles in motor control and sensorimotor functioning.43,61,62 Additionally, our results support the argument that earlier brain injury during times of rapid network formation, as seen in PVI, might allow for developing circuits to reorganize more effectively around the lesion compared to damage in a slightly more mature network as seen with AIS which happens after parturition. However, recent work has highlighted that outcomes after early brain injury are not uniformly better than after later injury and that the mechanism of injury might be more important in dictating functional consequences.4,63,64 More studies are needed to elucidate how injury timing interacts with lesion mechanism and network maturity to determine functional outcomes.
The unilateral lesions present in individuals with AIS and PVI result in damaged brain regions that appear to not only impact interhemispheric FC but may also alter connectivity within the lesioned hemisphere. We observed lower FC in the connections between the M1 and putamen, M1 and thalamus, and M1 and S1 only in the lesioned hemisphere of the AIS group. This finding is consistent with other research, where ipsilesional connectivity is altered in stroke participants with motor deficits.20 The absence of this pattern in PVI is likely due to the preservation of cortical areas that are typically damaged in AIS, despite both types of strokes often resulting in damaged corticospinal tracts. Spared cortical areas in PVI might allow for a greater potential for intrahemispheric reorganization in cortical sensorimotor networks, somewhat bypassing damaged corticospinal tracts.65 Notably, corticospinal tracts and thalamocortical projections are critical for motor planning, movement execution, and proprioceptive function given their central role in motor networks.65–67 This is consistent with our finding that lower sensorimotor FC in the lesioned hemisphere is more characteristic of AIS than PVI, reflecting differential lesion damage between the two stroke types.
Connectivity-behaviour Analyses
We also examined how FC in sensorimotor networks is positively associated with proprioceptive and visuomotor performance after perinatal stroke. Sensorimotor deficits are well-established in HCP youth after perinatal stroke,5 but the specific structures, circuits, and connectivity pathways underlying these functions are poorly understood. Previous studies using the Kinarm robotic exoskeleton demonstrated impairments in position sense, kinesthesia, and visually guided reaching abilities in children with stroke compared to peers.15,17,68 Our findings build on this work, suggesting lower FC in sensorimotor networks might provide a basis for these behavioural deficits in children and youth with perinatal stroke.
We found that both interhemispheric and intrahemispheric FC in sensorimotor networks were positively correlated with proprioceptive and visuomotor performance in stroke groups. TDC only showed one significant correlation in proprioceptive performance but was not correlated to any visuomotor measures. Patterns of associations differed for each stroke type. In AIS, interhemispheric basal ganglia connectivity had the strongest associations with proprioceptive and visuomotor performance, correlating with both visually guided reaching and kinesthetic measures (Figure 6). The caudate nucleus and putamen are central structures within the basal ganglia, and their involvement mediates the functioning of cortico-striatal-thalamo-cortical circuits to generate movement.43,69 The consistent associations between these areas and functional performance suggest that interhemispheric striatal connectivity is essential for proprioceptive control after AIS. This finding is consistent with past research showing that damage to basal ganglia based on the vascular territory affected predicts motor outcomes after PS.62 Additionally, connectivity between M1 and subcortical areas was positively correlated with task performance in all groups, although the exact subcortical areas differed by stroke subtype. M1-thalamus connectivity was associated with both KIN performance and VGR measures in PVI participants, while AIS participants exhibited associations between M1-caudate FC and VGR performance. These projections align with known motor circuits, in which the cortical motor areas project to both the thalamus and basal ganglia.70,71
Our findings also suggest differential network reorganization as a function of patient group as evidenced by distinct patterns of connectivity-behaviour associations. Specifically, FC in controls was only subtly correlated with proprioceptive performance and not with visuomotor control. The lack of detectable correlations in controls might partly reflect their lower variance in compared to stroke groups, potentially approaching a ceiling effect. This truncation of range can attenuate correlation coefficients, thus making associations more difficult to detect. By contrast, the PVI group showed some functional associations between FC and performance whereas the AIS group demonstrated even more numerous robust associations between FC and performance (Figure 6). The association between FC strength and behavioural performance is poorly understood, likely complex, and may be non-linear in typical neurodevelopment. Developing networks undergo pruning and specialization as superfluous connections decrease as the brain matures. These developmental processes are thought to underlie a decline in pairwise connections while performance improves with age, relying more on multi-network integration than node-node connections.72,73 However, these processes are even more poorly understood after very early brain injury such as PS and are likely variable across individuals.4 Impairments in proprioceptive and visuomotor performance are common in this population as was found in our current study and in others.15,17,74 These impairments could suggest incomplete or maladaptive reorganization. Following early brain injury, particularly the extensive cortical and subcortical damage characteristic of AIS,5 the brain may undergo reorganization creating dependencies between sensorimotor FC and task performance. This pattern mirrors the models of adaptive and maladaptive plasticity after PS, where reorganization might be necessary for the preservation of function, despite remaining suboptimal compared to intact developmental trajectories.4 Our study suggests that individuals with AIS may rely more heavily on remaining bilateral connections within the sensorimotor system than TDC, seen in the more frequent associations between interhemispheric FC and sensorimotor performance. Potentially reflecting contralateral compensation, interhemispheric connectivity is seemingly recruited to support function despite being reduced compared to typically developing counterparts. For PVI, intrahemispheric FC was correlated with sensorimotor function, reflecting a more unilateral pattern. These disease-specific reorganization patterns might preserve some functional capacity but remain less efficient than intact developmental trajectories in controls and may manifest as sensorimotor deficits.
Limitations
Important limitations of this study must be considered. Our study required participants to undergo an MRI, follow complex instructions, and perform proprioceptive and visuomotor tasks within the Kinarm robot that may be challenging for a clinical population. The primary reason for physical exclusions was spasticity, which necessarily limited our sample to high-functioning children and excluded those with more severe physical and cognitive impairments. This likely affects the generalizability of our sample to the wider PS population. In addition, not all participants completed comprehensive Kinarm testing. Thus, the final sample of participants with complete performance data was smaller compared to the sample included with sensorimotor FC and visually guided reaching data though is still a large sample for this population. Furthermore, participants likely received differing amounts of physical rehabilitation and therapy prior to the study, which could have impacted their imaging and sensorimotor outcomes. This likely affected variability among participants and though not controllable, is reflective of the natural variability of CP severity in this population. We also did not include the cerebellum as an ROI despite its role in sensorimotor function. This was primarily because our ROI selection was based on the cortico-basal ganglia-thalamocortical sensorimotor loop described by Lanciego et al.,43 which highlighted the M1, S1, SMA, putamen, caudate, and thalamus. An additional consideration was that we did not have full coverage of the cerebellum in all participants for the resting state sequence to sufficiently sample FC. In order to maximise our sample (and statistical power) we chose to exclude the cerebellum regions. A future study directly investigating cerebro-cerebellar connectivity might provide more insight into sensorimotor reorganization after perinatal stroke. Finally, head motion while scanning is an omnipresent challenge in pediatric neuroimaging studies. Despite correcting for head motion using stringent denoising and scrubbing techniques, removing participants with excessive motion, and regressing out movement-related outlier volumes, residual motion has been shown to impact long-range FC measurements in spatially distinct regions of interest.75
Conclusions
In summary, we investigated functional connectivity of sensorimotor regions and their association with proprioceptive and visuomotor performance in children and adolescents with PS compared to peers. Our results showed distinct group differences in FC and connectivity-behaviour associations across groups possibly reflective of differential network reorganization patterns. Compared to a control population, children and adolescents with PS exhibited lower sensorimotor FC that was associated with proprioceptive and visuomotor performance. These findings support a model of developmental plasticity after early unilateral brain injury, in which reorganization may differ across lesion type, location, timing, and size. They also provide insight into the mechanisms underlying proprioceptive and visuomotor development following perinatal stroke. Future studies aimed at distinguishing effective from ineffective compensatory connectivity mechanisms could inform more personalized therapeutic interventions. Additionally, longitudinal studies examining how these connectivity patterns evolve over a developmental trajectory and respond to types of rehabilitation could create further opportunity to improve quality of life for children with PS.
Data and Code Availability
This dataset includes original participant data and cannot be publicly shared due to participant confidentiality constraints. Data and code are available from the corresponding author upon reasonable request, which includes submission of a formal project outline, local ethics committee approval, and a formal data sharing agreement.
CRediT Authorship Contribution Statement
Methodology: Dakota Hofforth, Isabelle Poitras, Adam Kirton, Helen L. Carlson. Software: Dakota Hofforth, Isabelle Poitras, Helen L. Carlson. Validation: Dakota Hofforth, Meghan Maiani, Adam Kirton, Helen L. Carlson. Formal Analysis: Dakota Hofforth, Helen L. Carlson. Data curation: Dakota Hofforth, Adam Kirton. Writing – original draft: Dakota Hofforth. Writing – review & editing: Dakota Hofforth, Meghan Maiani, Isabelle Poitras, Adrianna Giuffre, Andrea M. Kuczynski, Lauran Cole, Martin Bardhi, Sean P. Dukelow, Adam Kirton, Helen L. Carlson. Visualization: Dakota Hofforth. Conceptualization: Meghan Maiani, Adam Kirton, Helen L. Carlson. Resources: Meghan Maiani, Adrianna Giuffre, Andrea M. Kuczynski, Lauran Cole, Martin Bardhi, Sean P. Dukelow, Adam Kirton. Supervision: Meghan Maiani, Adam Kirton, Helen L. Carlson. Investigation: Adam Kirton. Funding acquisition: Adam Kirton, Helen L. Carlson. Project administration: Helen L. Carlson.
Funding Sources
This work was supported by an Azrieli Accelerator Studentship Award held by DH. The data used in this study were collected as part of projects supported by the Canadian Institutes of Health Research (CIHR), Heart and Stroke Foundation of Canada, CHILD-BRIGHT Network, Alberta Children’s Hospital Foundation, Cumming School of Medicine Vision in Stroke Across the Lifespan Grant. The funder had no role in study design, data collection, analysis or interpretation, or writing of this report.
Conflicts of interest
The authors report no conflicts of interest that may bias or could be perceived to bias this work.
Corresponding Author
Dr. Helen Carlson
Alberta Children’s Hospital
28 Oki Drive NW,
Calgary, AB
Canada
Email: helen.carlson@ahs.ca
ORCID: 0000-0002-5788-0542