
Introduction
Millions of people worldwide are living with human immunodeficiency virus (HIV).1,2 When left untreated, HIV can cause severe neurological complications and cognitive deficits across various domains, including working memory, information processing, motor control, and executive functioning.3–5 Life expectancy and quality of life for people with HIV (PWH) have significantly improved due to the widespread availability of combination antiretroviral therapy (cART), and dementia is now rare.6–10 Despite the benefits of cART, there are still an estimated 20-50% of PWH who go on to develop neurocognitive impairment, even when virally suppressed.11–14 Structural and functional brain abnormalities have been associated with neurocognitive dysfunction in PWH,15 but the neural mechanisms underlying cognitive dysfunction in PWH are not yet well understood.
Resting-state functional magnetic resonance imaging (rs-fMRI) is a non-invasive imaging technique that measures low frequency fluctuations in blood oxygen level dependent (BOLD) signal in the brain when not engaged in a task.16 rs-fMRI allows researchers to assess functional connectivity, which refers to the temporal coactivation between different brain regions over time16 and provides insights into the spontaneous functional organization of brain networks.17 To date, most brain connectivity analyses in the neuroHIV literature have estimated aggregated brain networks (i.e., static connectivity). These studies have primarily reported reduced static functional connectivity in PWH compared to people without HIV (PWoH) across multiple large-scale brain networks.18–20 Given the breadth of network-level disruptions observed in PWH, a focused examination of network systems central to cognitive control and attentional regulation is critical for understanding HIV-associated cognitive impairment.
Key networks supporting cognitive functions include the default mode network (DMN), executive control network (ECN), and the salience network (SN). These networks form the triple network model, a framework that emphasizes their dynamic interplay and the ways in which disruptions within or between them can affect cognition.21 The DMN, typically activated during rest, supports internally oriented thought and social cognition; the ECN underlies executive functioning and attentional control; and the SN detects external and internal stimuli and facilitates switching between the DMN and ECN.22 Prior studies have reported reduced intra-network connectivity in the DMN, SN, and ECN in PWH compared to PWoH.19,20 Additionally, reduced inter-network connectivity between several large-scale brain networks has been observed in PWH.19 In contrast, other work has identified increased connectivity in the DMN and ECN in PWH.23 Regarding cognition, reduced functional connectivity in the DMN has been linked to cognitive deficits,24 whereas other studies have found no relationship between functional alterations and cognitive performance.20,25 Additionally, reduced ECN and SN connectivity in virally suppressed PWH was associated with neurocognitive disorders.26 Together, these findings highlight the complex network-specific disruptions associated with chronic HIV.
While static rs-fMRI studies have provided important insights into how HIV affects patterns of functional connectivity and their relationship to cognition, they overlook how these connectivity patterns fluctuate over short time scales. Because brain networks are inherently dynamic, capturing temporal variations can yield novel insights into both adaptive and abnormal neural processes.27,28 Dynamic functional connectivity approaches quantify moment-to-moment fluctuations in resting-state brain activity, identifying disruptions in transitions between distinct network states.17,28 One prior study examined dynamic functional connectivity in PWH using sliding-window and K-means clustering approaches, and found that increased temporal variability in connectivity patterns was associated with attention and working memory, as well as immune markers.25 However, these findings were characterized at the level of region-to-region interactions rather than a cohesive large-scale network framework, limiting their interpretability with respect to cognitive systems. While resting-state connectivity provides a broad view of brain activity, understanding how dynamic connectivity fluctuations are organized within specific functional networks is essential for clarifying their contributions to cognition.
Our team has developed a novel approach using hidden semi-Markov models (HSMM) for dynamic functional connectivity analyses. HSMM more accurately estimates abrupt changes in network states compared to a sliding window analysis and does not have restrictive assumptions on sojourn times (i.e., the amount of consecutive time someone spends in a given state) that the standard hidden Markov model has.29,30 This framework allows us to estimate each participant’s most probable sequence of network states, along with total time spent in each state, time dwelling in each state before switching to a new state, and probability of transitioning between states. For this study, we applied this novel HSMM approach to investigate how PWH transverse in and out of different network typologies involving brain regions from three key networks - DMN, ECN, and SN. We hypothesized that state occupancy and dwell times would distinguish PWH from PWoH. Additionally, we explored the associations between dynamic connectivity patterns and neuropsychological performance.
Methods
Procedures
Study procedures have been described previously.31 In brief, participants were enrolled in one of three protocols with shared procedures. After providing written informed consent, participants completed an in-person screening visit that assessed medical, psychiatric, and substance use histories. Eligible participants returned for neuropsychological testing, MRI scanning, and additional assessments. Procedures were approved by the institutional review board at Duke University Health System.
The sample included adults aged 20-55 years with and without HIV disease who were recruited from infectious diseases clinics and community advertisements in the Raleigh-Durham area of North Carolina. The age range was selected to reduce potential confounding from developmental and aging-related influences on brain organization, including age-related comorbidities and neurobiological changes that may hasten HIV neuropathology.32–39 For PWH, diagnosis of chronic HIV was verified by medical record review. For PWoH, an oral rapid antibody test (OraSure ADVANCE® HIV-1/2) was conducted to confirm HIV-negative status. Exclusion criteria were: English non-fluency or illiteracy; <8th grade education; severe learning disability; unresolved neurological disorders or neuroinfections; severe head trauma with loss of consciousness >30 minutes and persistent functional decline; bipolar I or psychotic disorder; acute psychiatric symptoms interfering with functioning; MRI contraindications; and/or impaired mental status. Current nicotine, alcohol, and marijuana use was permissible, but participants could not meet criteria for dependence. For other drugs, individuals were excluded for a history of dependence, lifetime regular use for >2 years, any use in the past 30 days, and/or a positive urine drug screen.
Assessments
Screening. The Addiction Severity Index-Lite interview assessed current and lifetime substance use and other domains of function, including psychiatric symptoms and medical conditions.40 Other interviews included the Mini International Neuropsychiatric Interview to identify DSM-IV mood and psychotic disorders41 and Module E of the Structured Clinical Interview for DSM-IV-TR to identify substance use disorders.42 To test for recent drug use, we conducted a 9-panel urine toxicology screen for amphetamine, barbiturates, benzodiazepines, cannabis, cocaine, methadone, methamphetamine, opioids, and oxycodone. Medical records were reviewed to assess medical history and ensure no exclusionary conditions.
Neuropsychological testing. Our battery assessed seven cognitive domains relevant to HIV-associated neurocognitive disorder (HAND): (1) executive function [Trail Making Test Part B43and Stroop Color and Word Test Interference44]; (2) processing speed [Trail Making Test Part A43 and Stroop Color and Word Test Color Naming44]; (3) working memory [Paced Auditory Serial Addition Task-5045 and NAB Digit Span: forward and backward46]; (4) verbal fluency [FAS letter fluency and category fluency – animals47]; (5) learning [Hopkins Verbal Learning Test—Revised (HVLT-R), immediate trials48]; (6) memory [HVLT-R, delayed trial48]; and (7) motor functioning [Grooved Pegboard Test, dominant and non-dominant hands49]. Using the most up-to-date published norms for each test, raw scores were converted to standardized T-scores (M = 50, SD = 10) that corrected for age and, when available, other demographic factors. T-scores for tests within a domain were averaged to create a domain T-score, and a global T-score was computed as a mean of all domain T-scores.
HIV clinical data. Date of HIV diagnosis, nadir and current CD4+ T-cell count, current antiretroviral regimen, and most recent HIV viral load were reviewed from the medical record. Viral suppression was defined as <50 copies/mL. To normalize the data, CD4+ T-cell counts were square root transformed.
MRI Data Acquisition and Processing
Data were acquired at Duke Hospital on a 3.0T GE Discovery MR750 scanner using an 8-channel head coil. High-resolution anatomical images were acquired with the following parameters: TR = 8.10 ms, TE = 3.18 ms, FOV = 25.6 cm, 256*256 matrix, 12° flip, 166 interleaved slices of 1 mm thickness). For the rs-fMRI data, whole-brain eye-open BOLD images were collected using T2*-weighted echo-planar imaging (TR = 2000 ms, FOV = 24 cm, 64*64 matrix, voxel size 3.75*3.75*3.8 mm). Slices were acquired in an interleaved order with no inter-slice gap, and simultaneous multi-slice acceleration was not used. Additional parameters differed slightly between the first protocol (TE = 27 ms, 77° flip, 39 slices) and the other two protocols (TE = 25 ms, 90° flip, 35 slices). These acquisition parameters reflect the original protocols of the parent studies from which the present secondary analysis was conducted and were based on standard imaging practices at the time of data collection. Data harmonization consisted of ensuring that all scans had 144 volumes. Across the three acquisition protocols the composition of participants differed significantly (p = .012). Specifically, protocol 1 included 16 PWH (55%) and 13 PWoH (45%), protocol 2 included 16 PWH (47%) and 18 PWoH (53%), protocol 3 included 16 PWH (72%) and 13 PWoH (28%). The protocol differences reflect data acquired under three parent study protocols conducted at different times as part of the larger research program. The present study is a secondary analysis of those existing datasets. Although acquisition parameters varied slightly across protocols, all scans underwent standardized preprocessing and harmonization procedures, and protocol effects were further addressed through post-estimation covariate-adjusted sensitivity analyses.
For rs-fMRI, the first six volumes were excluded to ensure steady state sampling. Data processing was conducted using FSL v6.0.3,50 including motion correction using rigid-body transformation, slice-timing correction, high-pass temporal filtering using a Gaussian filter at 0.01 Hz, signal intensity normalization, and spatial smoothing with a 6 mm full width at half maximum Gaussian kernel. White matter and cerebrospinal fluid means were regressed out. Motion and physiological-related components were removed using the non-aggressive implementation of ICA-AROMA.51 Registration of functional data to the T1-weighted acquisition was done using a 12-parameter affine transformation, and images were registered to the 2-mm MNI template using nonlinear registration.52 All included scans had a relative motion cutoff of < 0.3 mm, based on FSL’s MCFLIRT using the middle volume as reference. Images were parcellated into the 100-node Schaefer atlas.53 Analyses were restricted to the 49 nodes that made up the DMN, ECN, and SN networks of the triple network model. Therefore, the mean fMRI time series was extracted for each ROI within these three subnetworks.
Hidden Semi-Markov Models
We applied an HSMM to the region of interest (ROI) time-series data from our final participant sample. A full technical description of the HSMM is available in prior work.54 Here we provide a concise overview. We denote the ROI time-series data for each participant by where each p−dimensional vector contains the BOLD measurements of the p ROIs at the timepoint for the participant. We assume a unique unobservable (or hidden) brain network state gives rise to each We represent this hidden network state at a particular observation time by where takes discrete values (i.e., ∈ 1…K). We assume that each follows a multivariate Gaussian distribution, ∼ where the mean and covariance are dependent on the current (unknown) network state, for any S ∈ 1, …, K. Thus, each network state has its own set of mean activations across our ROIs, as well as its own covariance structure between ROIs. To characterize functional connectivity, each state’s covariance matrix is converted to a correlation matrix, yielding a weighted network representation.
The HSMM additionally estimates (a) transition probabilities between states and (b) dwell time for each state, which refers to the amount of consecutive time spent in that state before transitioning to a different state. Because the number of states must be specified before model estimation, we used the PeakMin procedure to select the number of states.55 The HSMM was fit using candidate solutions ranging 3–10 states. For each solution, the estimated state covariance matrices were converted to correlation matrices, and Euclidean distances were calculated between every pair of states. The smallest pairwise distance was retained for each candidate solution. The PeakMin procedure selects the adequately fitted solution with the largest minimum distance, thereby favoring a model in which even the two most similar states remain well separated.
Candidate solutions were also evaluated by inspecting the participant-specific state sequences. The nine- and ten-state models produced implausible sequences in which many participants remained in a single state throughout essentially the entire scan, indicating inadequate model fit and a failure to capture meaningful dynamic transitions. These solutions were therefore excluded from consideration. Among the adequately fitted solutions, the six-state model had the largest minimum pairwise distance (approximately 3.64, compared with 2.99 for five states and 3.43 for seven states) and produced plausible participant-level dynamic state sequences. The six-state model was therefore selected for all downstream analyses. The complete minimum-distance plot and representative state-sequence diagnostics are presented in Supplementary Figures 1 and 2. The complete data log-likelihood of the HSMM is detailed in our prior work.54 The analysis was run on a computer running Windows 11 Enterprise equipped with an Intel Core Ultra 5 135U processor (12 cores, 1.60 GHz) and 16 GB RAM, and it took approximately 2–3 hours. This included fitting separate HSMMs for candidate solutions containing 3–10 states, evaluating the state-selection diagnostics, estimating participant-specific sequences under the selected six-state solution, and conducting the downstream permutation analyses.
Parameter estimation was carried out using the Expectation–Maximization algorithm.56 The most probable sequence of states for each participant was then inferred via the Viterbi algorithm.57 This procedure uses the fitted state distributions, transition probabilities, dwell-time densities, and initial state probabilities to compute each participant’s most likely trajectory of network states given their BOLD data. Although the state definitions are learned from the full dataset rather than individually, the resulting sequences are participant specific. Further details of the estimation framework are available elsewhere.54
Topological Characteristics of Brain States
Undirected, weighted graphs were constructed from state covariance matrices derived via the HSMM. Each covariance matrix was converted into a correlation matrix, with negative correlations set to zero. To further characterize each brain state, we applied graph-theoretical analyses to estimate metrics of global efficiency, modularity, local efficiency, and degree. Graph measures were computed using the Brain Connectivity Toolbox (www.brain-connectivity-toolbox.net).58
Global efficiency reflects the inverse of the average shortest path length across the network, indexing overall integration and the speed of information transfer.59 Modularity assesses the extent to which the network is partitioned into distinct communities, with higher values indicating stronger segregation and specialized processing within subnetworks.60 Local efficiency, defined as the average inverse shortest path length among a node’s immediate neighbors, captures the robustness of localized information exchange segregation.59 Finally, degree quantifies the number of connections per node, serving as a basic measure of centrality.61
HIV Status Inference via Permutation Testing
We assessed whether there were differences in state empirical dwell time of PWH and PWoH. To find empirical dwell time for each state, the number of consecutive time points spent in a state for each individual sojourn was counted for each participant. These counts were then compiled across all participants for each group. These group-level counts were then converted into density estimates. Each participant’s initial state and last state were omitted from these counts as it is impossible to know how long participants were in the initial state prior to the beginning of their fMRI scan or how long they remained in the final state following the conclusion of the scan. Therefore, omitting these counts prevented biasing the dwell time toward shorter times.
Once empirical dwell time were obtained for PWH and PWoH for all six states, a group comparison of each state’s empirical sojourn distribution was performed using permutation testing and Kullback–Leibler (KL) divergence. KL divergence is a measure of the directed divergence between two probability distributions.62,63 To generate null dwell time, permutation testing with 1000 permuted samples was used. Group labels (i.e., PWH and PWoH) were randomly assigned. The Philentropy R package was used to calculate KL divergence using these null distributions. Essentially, this approach answers whether the dwell time of the PWH and PWoH are more distinct from each other than distributions compared between two randomly selected groups of participants. Group difference p-values for state occupancy times were generated in a similar manner. A more detailed discussion of this approach can be found elsewhere.54 Because the published HSMM implementation does not accommodate participant-level covariates directly within state estimation, imaging protocol was not included in estimation of the latent brain states. As a post-estimation sensitivity analysis, State 1 occupancy was modeled using linear and Poisson regression with HIV status as the primary predictor and imaging protocol included as a categorical covariate. Continuous age was also included to evaluate age-related confounding.
Relationship of Occupancy Time to Cognitive Function
To calculate state occupancy time for each participant, the number of total time spent in a state was determined for each individual. We then examined the relationship between neuropsychological functioning and state occupancy time (dependent variable) via Pearson correlations in SPSS.
Results
Demographics and Clinical Characteristics
The sample included 125 PWH and 67 PWoH (controls). Demographics and clinical characteristics data are displayed in Table 1. Participants ranged in age from 20 to 55 years (M = 39.15, SD = 9.01). Majority of the sample were males (71.4%) and African American (67.7%) with a mean education of 14.24 years (SD = 2.25). The groups did not significantly differ on age (p = 0.051), sex (p = 0.107), or years of education (p = 0.140); however, race was borderline significant (p = 0.050). Most PWH (88.8%) had a suppressed viral load, with an average of 11 years (SD = 7.35) since diagnoses. The median most recent CD4+ count and median nadir CD4+ count were 714 (interquartile range [IQR] = 473) and 262 (IQR = 282), respectively. PWH exhibited a significantly greater medical comorbidity burden than PWoH (p < .001), and they had a higher prevalence of depression (p < .001) and diabetes (p = .024). PWH overall demonstrated poorer global cognitive performance, with significantly lower scores in the domains of information processing, learning, memory, executive function, verbal fluency, and motor function, compared to PWoH (all p < 0.05).
Brain State Characteristics
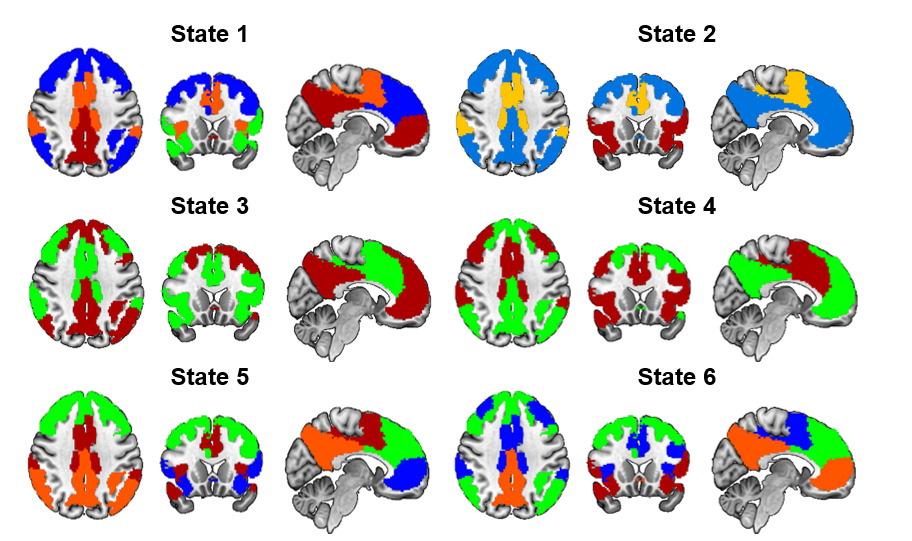
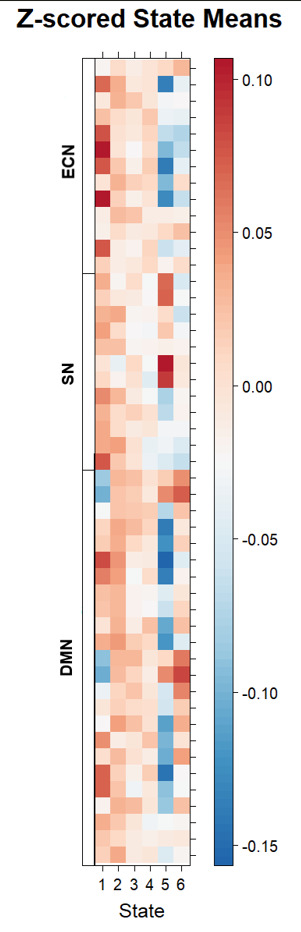
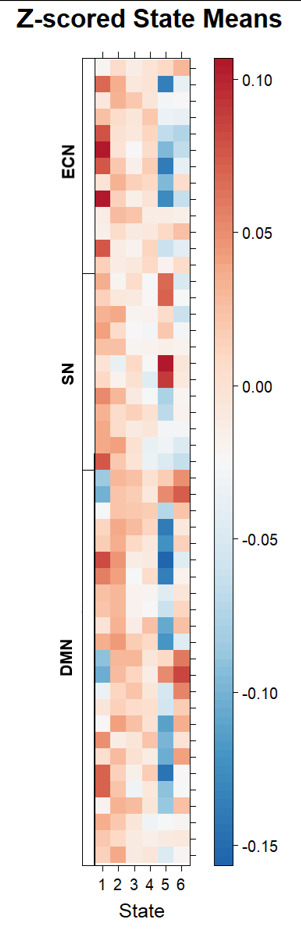
Six network states were estimated by HSMM from the 49 nodes of the DMN, SN, and ECN (Table 2). For each state, these nodes formed 2–4 communities (Figure 1) and had varying activity (Figure 2). In Figure 1, colors indicate community membership within a given state and are assigned independently across states; therefore, the same color does not imply the same community composition across different states. State 1 had the highest mean activity, which was most pronounced in ECN nodes, but the lowest modularity score and broke up into four communities. The first included prefrontal and posterior parietal nodes of the DMN and ECN; the second the precuneus and posterior cingulate nodes of the DMN and ECN; the third the middle temporal and orbitofrontal nodes of the DMN; and the fourth the SN nodes. Overall, State 1 reflects an integrated, high-activity configuration characterized by broad communication across networks.
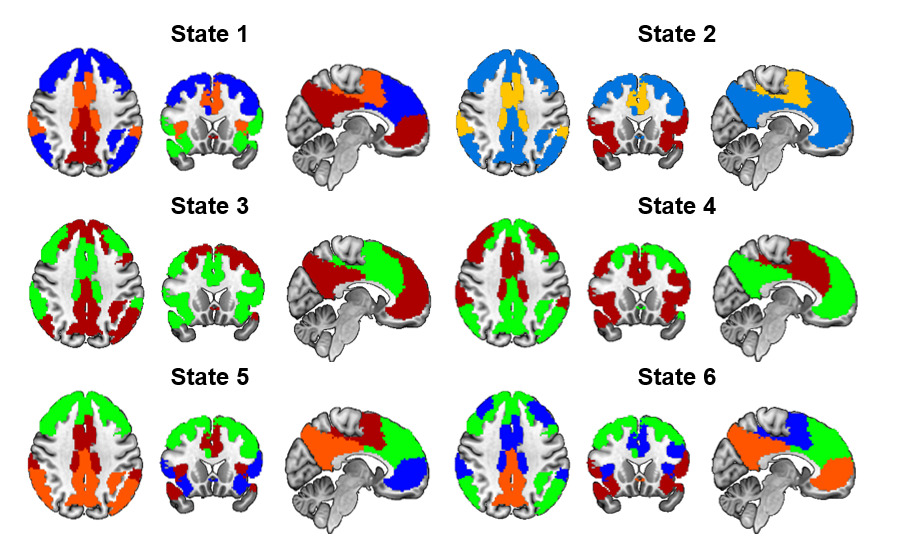
State 2 had moderate activity and broke into three communities. The first was the largest and included all nodes of the ECN plus the precuneus/posterior cingulate and rostral prefrontal nodes of the DMN. The second included the medial prefrontal and posterior parietal nodes of the SN, and the third included the insular nodes of the SN and the orbitofrontal and middle temporal nodes of the DMN. Overall, State 2 reflects an integrated configuration involving both ECN regions and core DMN hubs.
State 3 had fairly low activity and broke into two communities. The first include the SN nodes, the lateral prefrontal nodes of the ECN, and the orbitofrontal, temporal, and parietal nodes of the DMN. The second community included the remaining nodes of the precuneus/posterior cingulate nodes of the DMN and ECN. Overall, State 3 reflects a low-activity configuration where the core DMN regions are isolated from a broadly integrated system comprising the SN, ECN, and peripheral DMN.
State 4 had low activity but higher global and local efficiency, and degree. The state broke into two communities with fairly high modularity. The first included the precuneus and posterior cingulate nodes of the DMN and ECN plus anterior cingulate/frontal pole and middle temporal nodes of the DMN. The second included all of SN, the lateral and medial prefrontal portion of ECN, and the orbitofrontal and ventral prefrontal portion of the DMN. Overall, State 4 reflects a highly efficient and modular configuration characterized by the canonical segregation of a cohesive DMN from the SN and ECN.
State 5 was characterized by high activity, which was accounted for primarily by SN nodes, and below average activity, which was accounted for by the majority of nodes in the ECN and DMN. It had the lowest global and local efficiency, and degree. The state broke into four communities with high modularity. The first included the orbitofrontal, anterior cingulate, and frontal pole of the DMN. The second is the lateral prefrontal portion of ECN and the medial frontal portion of DMN. The third included the precuneus, posterior cingulate, and posterior parietal nodes of the ECN and DMN. The fourth included all the SN nodes plus the middle temporal nodes of the DMN. Overall participants spent the least amount of time in State 5. This state reflects a SN dominant configuration characterized by high activity and strong network segregation.
State 6 was also characterized by low graph metrics and broke into four communities with moderate modularity. Notably, the ECN and DMN nodes were split up across three communities each, while the SN remained intact. Overall, State 6 reflects a fragmented, low-efficiency configuration with reduced network cohesion.
State Occupancy
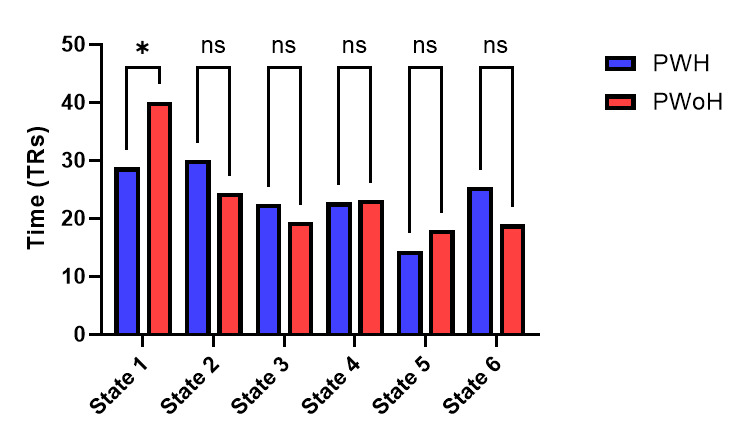
Overall, participants spent the most amount of time in State 1 and the least time in State 5. Of the six states, only State 1 significantly differed between PWH and PWoH (p = 0.023) (Figure 3). Although not statistically significant, PWH also spent less time in State 5 and more time in States 2 and 6, compared to PWoH. To ensure that the relationship between HIV status and State 1 occupancy time was not driven by age or differences in imaging protocol, we assessed both linear regression and Poisson regression models that included HIV status, age as a continuous covariate, and imaging protocol. Across both modeling approaches, HIV status remained a significant predictor of State 1 occupancy time after adjustment for age and protocol, indicating that HIV status explained unique variance beyond that attributable to these factors.
.png)
Dwell Time
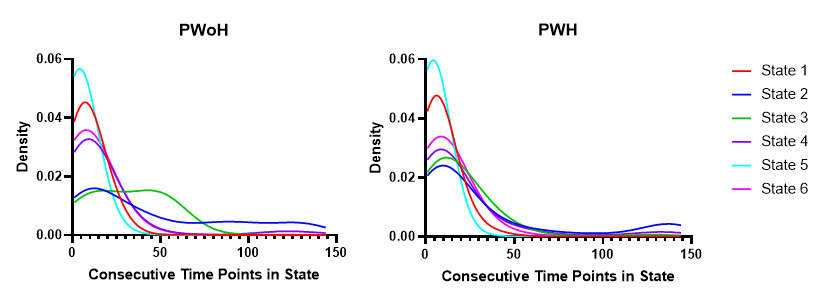
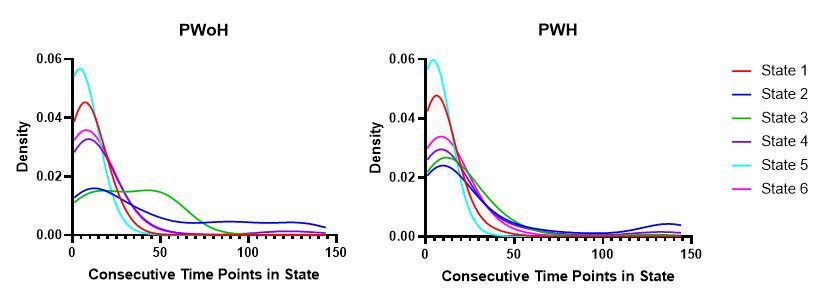
Dwell time reflects the length of time a participant remains in a specific state before switching to another. Figure 4 displays the distribution of dwell times across the six states for both PWH and PWoH. Curves that peak further to the left on the x-axis indicate shorter durations within a state prior to transitioning. Unlike occupancy times, we did not find a significant difference between the groups in any state (p > 0.05).
State Transition Probabilities
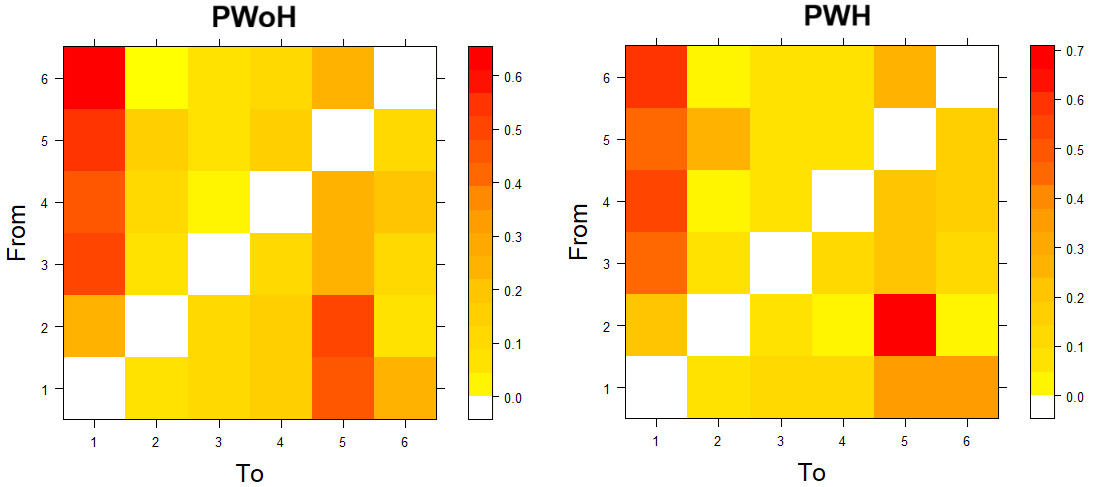
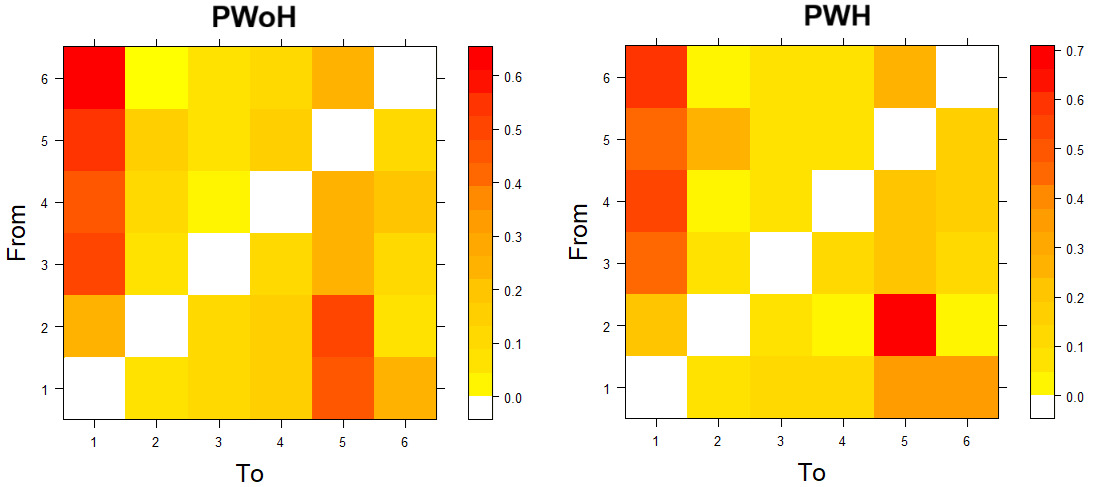
The two groups did not differ in how likely they were to transition to each of the states from their current state (Figure 5). In both groups, participants transitioned from States 6, 5, 4, and 3 to State 1 more often. They also transitioned from State 2 to State 5 often. Although both groups transitioned from State 1 to States 5 and 6, PWH transitioned slightly less often from State 1 to State 5, but this did not reach statistical significance.
Correlation of State Occupancy Time to Cognitive Function
As PWH spent significantly less time in State 1, we examined the relationship between occupancy time and neuropsychological performance. We found that time in State 1 for PWH was negatively correlated with executive functioning (r = -0.177, n = 125, p = 0.048) and motor (r = -0.190, n = 125, p = 0.034) domains, as well as the global score (r = -0.211, n = 125, p = 0.018). We did not find any significant correlation in State 1 for PWoH and neuropsychological performance. These analyses were exploratory in nature, and the reported associations did not survive correction for multiple comparisons across cognitive domains.
Discussion
The present study is to our knowledge the first to utilize HSMM to investigate dynamic resting-state functional connectivity in PWH. By focusing on the DMN, SN, and ECN of the triple network model, we identified six distinct brain states. Our primary findings revealed that PWH spent significantly less time in a highly integrated, strongly activated State 1 compared to PWoH. Based on the triple network model framework,21 State 1 can be characterized as a task-positive state. Occupancy time in State 1 had negative correlations with performance in the domains of executive functioning and motor, as well as global performance for PWH, while no correlations existed in PWoH.
The community structure analysis of State 1 revealed that it was comprised of four distinct communities: two integrating DMN and ECN regions, one consisting of primarily DMN regions, and one primarily containing SN regions. State 1 was characterized by higher activity in the SN and ECN regions compared to the other states, as indicated by positive mean z-scored BOLD activity in these regions. The SN is known for attentional switching between the DMN and ECN, while the ECN underlies executive processing.22 Further, we found below average activity of core DMN regions in State 1, specifically the precuneus and posterior cingulate cortex. This configuration marked by ECN/SN engagement and the suppression of core DMN hubs represents the biological signature of the brain transitioning from internal reflection to external cognitive demand.21 This reduced activity at rest aligns with task-based findings,64,65 suggesting that dysfunction of the DMN in PWH is not just a task-related issue, but persistent at the network level. Graph theory metrics analysis indicated that State 1 is characterized as highly integrated. Prior studies report that PWH who have neurocognitive impairment exhibit a loss of network segregation characterized by reduced modularity, suggesting an inefficient reorganization of functional networks.66 Together, these patterns suggest that State 1 represents a flexible, highly connected state that facilitates cross-network communication, but efficiency may be compromised in the HIV population. In contrast, other states identified in our study represented different neurofunctional configurations, such as the canonical DMN segregation (State 4), characterized by high modularity and DMN cohesion, or a salience-dominant configuration (State 5), dominated by SN activity.21,67
We found no group difference in dwell time, but PWH showed significantly lower occupancy time in State 1. This pattern indicates that once PWH transition into State 1, they maintain it for a typical duration; however, they enter the state less frequently. The reduced occupancy time therefore reflects diminished recurrence of this highly integrated network configuration. This alteration in temporal dynamics adds to the existing literature by demonstrating a disruption in how often PWH access a functional network state thought to support efficient cognitive operations. This dynamic profile of reduced occupancy aligns with prior reports of diminished functional connectivity of the triple network model in PWH, highlighting that weakened communication undermines the neural stability required to maintain a highly integrated state.19,20,23,24,26,68 The lower occupancy of this task-positive state may reflect a deficit in the SN mediated triple network switch required to trigger integrated, task-ready states.21,67 Together, these findings suggest that while State 1 represents a high-functioning configuration, PWH may struggle with temporal stability in these networks due to underlying connectivity deficits.
Within State 1, exploratory analyses revealed small negative associations between occupancy time and executive functioning, motor functioning, and global neurocognitive performance in PWH, whereas no significant associations were observed in PWoH. Prior studies have reported that HIV disease is associated with increased connectivity between the SN and DMN, a pattern linked to executive dysfunction.68 Although the observed correlations were modest and did not survive correction for multiple comparisons, their direction is consistent with evidence suggesting that alterations in large-scale network organization may be associated with cognitive dysfunction in HIV. Research on asymptomatic neurocognitive impairment has similarly shown that functional reorganization within the ECN and DMN is associated with deficits in motor performance and global neuropsychological functioning.69 Consequently, the observed relationships should be interpreted cautiously and viewed as preliminary evidence warranting further investigation. Nevertheless, consistent with prior studies based on static functional connectivity, our findings suggest that alterations in the triple network model may be relevant to cognitive functioning in HIV. By incorporating dynamic functional connectivity, the present study extends this work by capturing temporal variations in network organization, specifically the dynamic flexibility required to transition into task-positive states that are not reflected in traditional static connectivity measures.
Our findings suggest that dynamic functional connectivity may provide a sensitive marker for HIV-related brain dysfunction. Specifically, reduced occupancy of a highly integrated brain state and its association with neurocognitive performance indicate that alterations in large-scale network dynamics may capture aspects of neural dysfunction that are not readily detected by static connectivity measures alone. These findings highlight the potential of dynamic network metrics to provide sensitive indicators of cognitive vulnerability in PWH. Future longitudinal studies are needed to determine whether these measures can predict cognitive decline, monitor disease progression, or serve as targets for intervention.
Several limitations should be acknowledged when interpreting these findings. First, the estimated states are conditional on the 49 DMN, ECN, and SN regions included in the model and should therefore be interpreted as dynamic configurations of the triple network model rather than universal whole-brain states. Expanding the analysis to a whole-brain atlas could preserve some broad patterns of integration and segregation among these networks, but exact state definitions and participant-specific temporal metrics would not necessarily remain unchanged. Additional brain systems could subdivide existing states, alter their separability, or reveal configurations not observable within the restricted network set. Furthermore, computational and statistical demands increase rapidly with the number of input nodes because each state requires estimation of a node-specific mean vector and a full covariance matrix. The current 49-node model required 1,225 unique covariance parameters per state, whereas use of the full 100-node Schaefer atlas would require 5,050 per state. Given the current sample size and scan duration, unrestricted whole-brain covariance estimation would likely be unstable, particularly for less frequently occupied states. Future studies incorporating whole-brain connectivity, larger samples, longer scan durations, or regularized covariance-estimation approaches will be important for evaluating the reproducibility and generalizability of these findings in a whole-brain context. Second, graph metrics derived from dynamic functional connectivity are sensitive to fluctuations in network density across brain states. While these density variations are an inherent feature of dynamic network organization, they introduce an important caveat when interpreting changes in graph metrics and thus should be interpreted with appropriate caution. Third, the cross-sectional design constrains conclusions about causality or the temporal progression of network changes. Longitudinal studies are necessary to evaluate the stability and evolution of these patterns over time and to determine whether dynamic connectivity measures have prognostic value for neurocognitive outcomes. Fourth, although HIV disease characteristics and several medical comorbidities were available, measures of body mass index, immune activation, and systemic inflammatory biomarkers were not collected. Consequently, we could not directly examine the potential contribution of chronic inflammation and immune dysregulation to the observed network dynamics. Future studies integrating neuroimaging with inflammatory and immune biomarkers are needed for clarifying the biological mechanisms underlying HIV-related changes in brain network dynamics. Finally, the sample size may have limited statistical power to detect subtle effects, particularly in the exploratory correlational analyses. Larger cohorts with longitudinal follow-up will be critical for validating the observed findings, improving the precision of effect estimates, and determining their robustness across diverse samples.
Conclusion
In summary, this study provides novel evidence that PWH spend significantly less time in a highly integrated connectivity state at rest, despite showing no deficits in state stability. Exploratory analyses revealed that occupancy time in State 1 was negatively associated with neurocognitive functioning, suggesting that alterations in dynamic network organization may be relevant to cognitive outcomes in this population. By applying a HSMM to resting-state data, we extend prior static connectivity findings and demonstrate the added value of dynamic approaches for characterizing HIV-related neural changes. Our findings suggest that HIV may be associated with disruptions in large-scale network communication, contributing to cognitive deficits even in the context of effective cART. Together, these results highlight the potential of dynamic connectivity metrics to provide sensitive indicators of cognitive vulnerability in PWH and support their further investigation in longitudinal studies.
Data and code availability
Data can be made available upon request with appropriate Institutional Review Board approval and data use agreements. Code can also be made available upon request without any restrictions.
Funding
This work was supported by grants from the National Institutes of Health R01-DA045565, T32-AA007565, and K25-EB032903-01.
Conflict of Interests
The authors declare that they have no conflicts of interest.
Human Ethics and Consent to Participate
This study was approved by the Duke University Health System Institutional Review Board. All participants provided written informed consent before participation.