
Introduction
Whole brain and regional volume changes over the lifespan are the foundational measurement used for estimating the effects of aging,1–5 and constitute an important imaging-based biomarker of neurodegenerative6–15 and psychiatric16–20 disease, as well as other conditions.21 Measuring brain volume typically is done using conventional 1.5 or 3T magnetic resonance imaging (MRI), which has strengths in spatial resolution and soft tissue contrast relative to other widely-available methods of imaging the brain.22–24 However, traditional MR scanners are associated with high direct and indirect costs both up front and over time. They require patients to present at dedicated imaging facilities, which often presents logistical challenges as patients age, especially those aging with neurodegenerative conditions affecting cognition. Despite many advances, some individuals with implants still cannot safely receive 1.5 or 3T MRI. Because of these limitations, there are gaps in the knowledge of how the brain changes over the extended disease course among patients with barriers to receiving specialized neuroimaging.
While the earliest instances of human MR imaging in the 1970s all relied on < 1T, increases in field strength have been a key focus of innovation in the decades since, reflecting a desire for finer and finer spatial resolution.25 Recently, ultra-low-field portable MR scanners (<100 mT) have been re-introduced to the research and clinical literature complemented by machine learning software to produce images purportedly comparable to 1.5 or 3T T1- and T2-weighed scans. With lower up front and maintenance costs, a 64 mT scanner may produce images with a spectrum of comparable clinical utility to those from a conventional 1.5T scanner. These scanners are a crucial potential gateway to knowledge of disease and development in lower and middle income countries, where MR technology is less accessible.26,27 Early applications for the detection of hematoma after traumatic brain injury28 and white matter hyperintensities,29 monitoring of critical care patients,30,31 determination of time since stroke,32 and better understanding the relationship between brain volume changes and cognition33 have spurred on enthusiasm for the accessible technology. The portability of ultra-low-field scanners also is uniquely suited for longitudinal observations of clinical populations who have difficulty traveling to receive neuroimaging, resulting in difficulty evaluating new or worsening symptoms. Research on these conditions often faces high attrition of the most severely affected individuals, rendering the resulting samples less representative of the full range of patients. Reduced image resolution and signal-to-noise ratio, concerns about the retention of subtle clinically meaningful elements through largely opaque and non-modifiable in-machine processing, and artifacts related to low fields’ greater vulnerability to distortions have remained limitations to clinical utility and the applications of some conventional neuroimage processing pipelines.34,35
Arguably, the most important facet of ultra-low-field structural scans for the purpose of convenient longitudinal observation is the test-retest stability of key neuroimaging biomarkers. Volumetrics present an important potential use for ultra-low-field MRI. There is no single foundational ground truth to volumetric estimates from magnetic resonance imaging. Instead, values are considered accurate if they are qualitatively similar to those derived from more sophisticated instruments, often 3T traditional MRI acquisitions. However, as combining results across scanners is not straightforward even in conventional applications, the most pragmatically important quality is the highly stable reproducibility of estimates, allowing for the identification and quantification of changes over time.
While multiple contemporary low field systems now are marketed for clinical use spanning 0.55-0.064T, qualitative similarities between conventional MRI and the Swoop 64 mT portable MRI system (Hyperfine, Guildford, CT, USA) have been explored rigorously in a number of prior investigations, since its clearance with the US Food and Drug Administration in 2020. In 2021, Deoni et al. compared 64 mT and 3T MRI in the ability to quantify brain volume in children.34 They found that whole brain white matter, grey matter, and intracranial volumes they observed were largely in agreement with past developmental data, but with larger confidence intervals ascribed to higher signal to noise ratios. They were among the first to note that available conventional MRI processing software packages had considerably different levels of success when analyzing 64 mT images available at the time. In early 2025, Váša and colleagues examined inter-scanner reproducibility and the relationship between values derived from conventional 3T scanners and those derived from 64 mT Swoop system36 pre-processed using SynthSeg.37 The authors parcellated the volumes into 98 structures, then considered them separately, as well as when combined these to calculate total cortical grey matter, subcortical grey matter, white matter, and cerebrospinal fluid (CSF). T2-weighted scans were associated with the highest inter-scanner reliability (median intraclass correlation [ICC] = 0.96) and correspondence to 3T scans (median r = 0.94). However, the authors noted that 64 mT scans remained of appreciably lower visual quality (lower resolution, reduced contrast between tissue types, increased noise). They also demonstrated the considerably poorer reliability within the amygdala and extra-cortical CSF. Moreover, the authors noted that T1-weighted sequences resulted in non-zero CSF signal and partial-volume signal voids at tissue interfaces. These were thought to contribute to the lower correspondence of T1- versus T2-weighed scan-derived volumes with those derived from conventional 3T MRI. The authors conclude with a recommendation that future protocols utilize thick-slice T2-weighted scans in three orthogonal orientations, then combined these into a single isotropic scan using multi-resolution registration, a process previously described in the literature.38
Test-retest stability of Swoop MRI system also previously was examined using an earlier scanner software release. Within the context of Swoop systems, software versions refer to the entire device software that runs on the host computer, as well as the firmware that runs on the scanner itself. Thus, software versions control the sequence acquisition and reconstructions. Hsu et al.39 compared the test-retest reliability of volumes derived from 64 mT Swoop MRI system to within-subject test-retest reliability of volumes derived from conventional MRI; however, the scans were acquired using a range of scanner software versions (8.2.0-8.6.1). The scans were subject to the previously-described registration process38 and segmented automatically using SynthSeg.40 The authors agreed with the findings of Váša et al. that T2-weighted 64 mT scans resulted in volume estimates more comparable to 3T scans versus 64 mT T1-weighted scans. Test-retest analysis demonstrated that the coefficient of variation for macrostructural volumes was smaller for T2-weighted versus T1-weighted scans (0.60-3.04 versus 1.86-4.44), largely reproducing prior work addressing these dimensions in even earlier software versions.34,41 However, results were not consistent across volumes.
These investigations highlighted two open questions regarding the use of 64 mT Swoop MRI system for volumetric analysis: whether contemporary acquisitions from ultra-low-field MRI have sufficient test-retest stability to permit interpretation of volumetric analysis (that is, comparable test-retest stability to that achieved by conventional 1.5-3T MRI) and whether there remain limitations associated with combining analyses across software releases. These questions have crucial implications for routine clinical care and research.
The aim of the present work was to examine the question of test-retest reliability and external validity of key macrostructural volumes. We also planned an exploratory analysis to move beyond volumetrics of large structures like whole brain or total white or grey matter, as performed before, and describe the test-retest stability of volumetrics for finer cortical segments for the first time. We limited our analysis to the recent Swoop scanner software updates, versions 8.8.1 and 9.0.0, and described preliminary observations of software version related changes.
Methods
Participants
Twenty prospectively recruited neurologically typical English-speaking adult volunteers were recruited at Johns Hopkins University School of Medicine. All participants provided written informed consent. All activities were subject to review by the Johns Hopkins University Institutional Review Board and were part of an approved protocol (NA_00042097). Sixty-four mT MRI scans were acquired on a Swoop MRI system (Hyperfine, Guilford, CT), hardware version 1.8, using an 8-channnel linear head coil.
Exclusion criteria included pregnancy, severe claustrophobia, cardiac non-MRI compatible pacemaker or ferromagnetic implants, prior history of neurological disease affecting the brain, known hearing loss, and uncorrected visual loss. Each participant was scanned twice, no more than 1 week apart, and received T1-weighted images (T1-WI), T2-weighted images (T2-WI) and fluid-attenuated inversion recovery (FLAIR). They also received diffusion-weighted imaging with apparent diffusion coefficient map in the first session. Ten participants underwent scans using software version 8.8.1 and ten using software version 9.0.0. Participants scanned with the software version 9.0.0 additionally underwent a fast T2-WI. Each image session lasted less than 30 minutes. Images were reviewed by a neurologist to confirm the absence of known pathology prior to analysis.
Per the manufacturer, the major areas of improvement between the 8.8.1 and 9.0.0 software versions were: (1) improved eddy current and hysteresis correction, (2) sequence changes, (3) improvements to the artificial intelligence (AI) reconstruction model and the AI de-noising model, and (4) the addition of an AI model to up-sample after reconstruction. While sequence changes were subtle, they included the addition of flow suppression to FLAIR sequences in 9.0.0, which reduces flow artifact and makes venous blood dark. Echo times for FLAIR and T2-WI scans were slightly shortened to increase signal-to-noise ratio in the brain parenchyma. Additional details regarding the changes to AI models are proprietary. All models are rigorously validated to ensure accurate representation of acquisition data prior to release.
The second dataset used in this study was the Multi-Modal MRI Reproducibility Resource, public in NITRC, which consists in repeated 3T scans of healthy volunteers, including 11 repeated T1-WIs and 18 repeated T2-WIs.42 These data were introduced not to provide a direct comparison of resulting raw volumetric estimates (as they are not acquired from the same individuals), but purely to provide a comparator of reproducibility or stability of these measurements within the same system, for potential longitudinal studies.
Image processing
All post-scanner processing within the pipeline was completed in FreeSurfer version 8.43,44 FreeSurfer morphometric procedures have been demonstrated to show good test-retest reliability across scanner manufacturers and across field strengths.45,46 Segmentation of the low field scans was completed using the SynthSeg function from within FreeSurfer37,40 with the options “-parc -robust”. This function outputs volumes from 101 regions of interest, at different granular levels. For completeness, we present and discuss test-retest reliability results for both a low-granularity parcellation with large volumes of interest (intracranial volume, total grey and white matter, subcortical grey matter, ventricles, CSF, left and right hemispheres, telencephalon, and cerebellum) and a finer parcellation with smaller volumes of interest (e.g., cortical parcels and deep grey nuclei).47–49
Statistical analysis
We investigated the test-retest reproducibility of the volume measurements derived from T1- and T2-WIs, at 64 mT (with scanner software versions 8.8.1 and 9.0.0) and 3T MRI using ICC(3,1). For each brain region, scan-rescan repeatability was evaluated separately for version 8.8.1 and version 9.0.0, using absolute and percent differences between repeated acquisitions. An ICC of 0.9 and above was considered to have excellent test-retest stability.50 Our aim was not to compare volumetric measures across scanner field strengths. There is no single ground truth for MRI volumetric analysis; instead, reproducibility is the key requirement for in vivo volumetric studies. Reproducibility is well-established for 3T MRI, and here we assess whether 64 mT imaging achieves comparable reproducibility. Additionally, the estimates of brain volume from 64 mT and 3T were plotted on known normative growth curves based upon nearly 100,000 individuals, available in BrainChart.io,51 to explore external validity of their values.
Two participants were scanned both using software 8.8.1 and 9.0.0 to facilitate an exploratory comparison of within-subject scan-rescan bias within each software version and across version bias. One participant underwent two scan-rescan sessions before and two after the upgrade. Given this single-subject repeated-measures design, analyses are descriptive and focused on measurement stability rather than population-level reliability. Upgrade-related effects were assessed by comparing mean regional volumes before and after the upgrade and expressing these differences relative to within-version scan-rescan variability.
Results
Participant characteristics
Participant characteristics are described in Table 2.
Test-retest stability of brain volumes
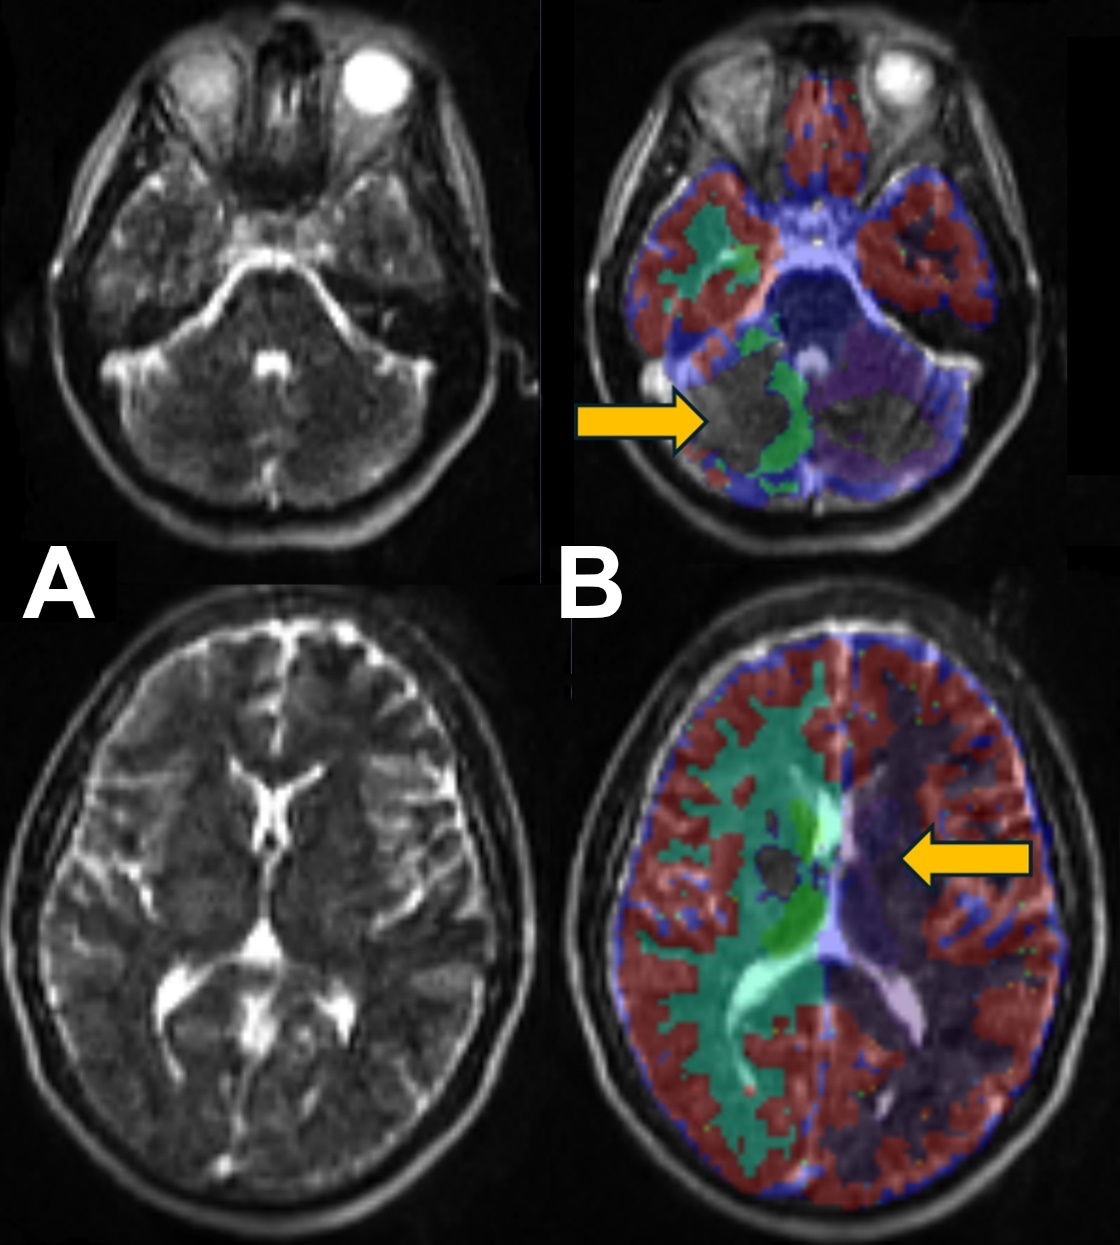
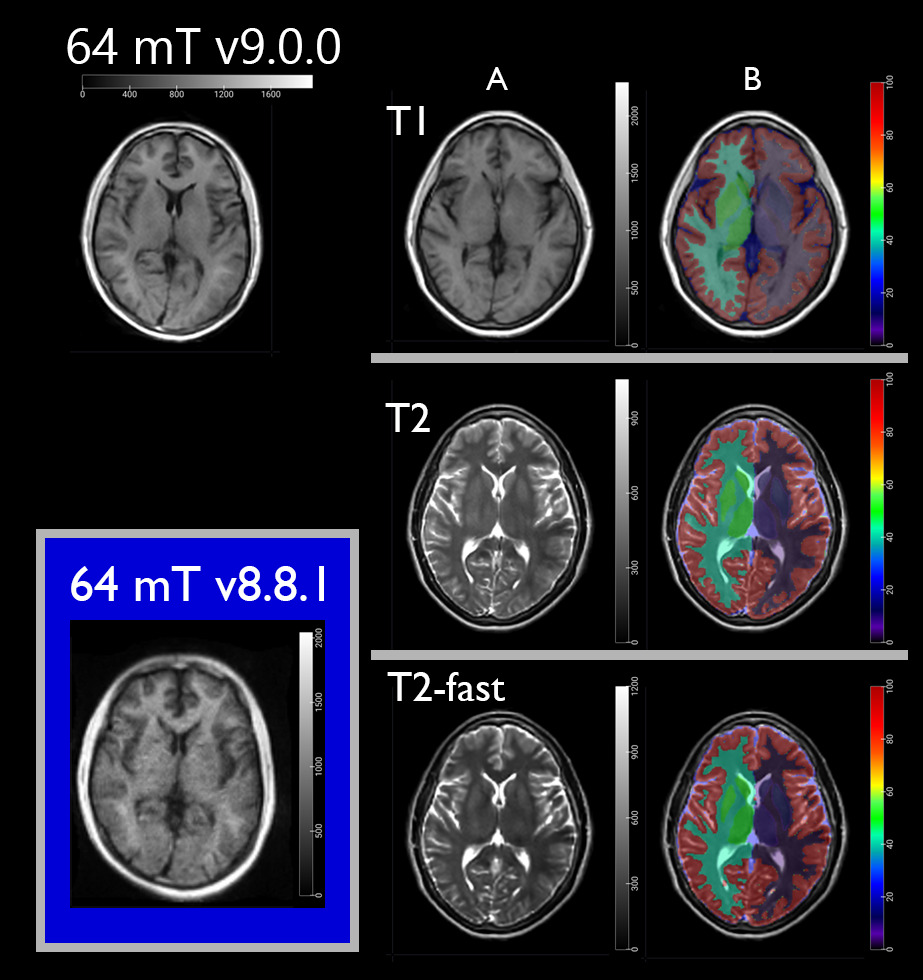
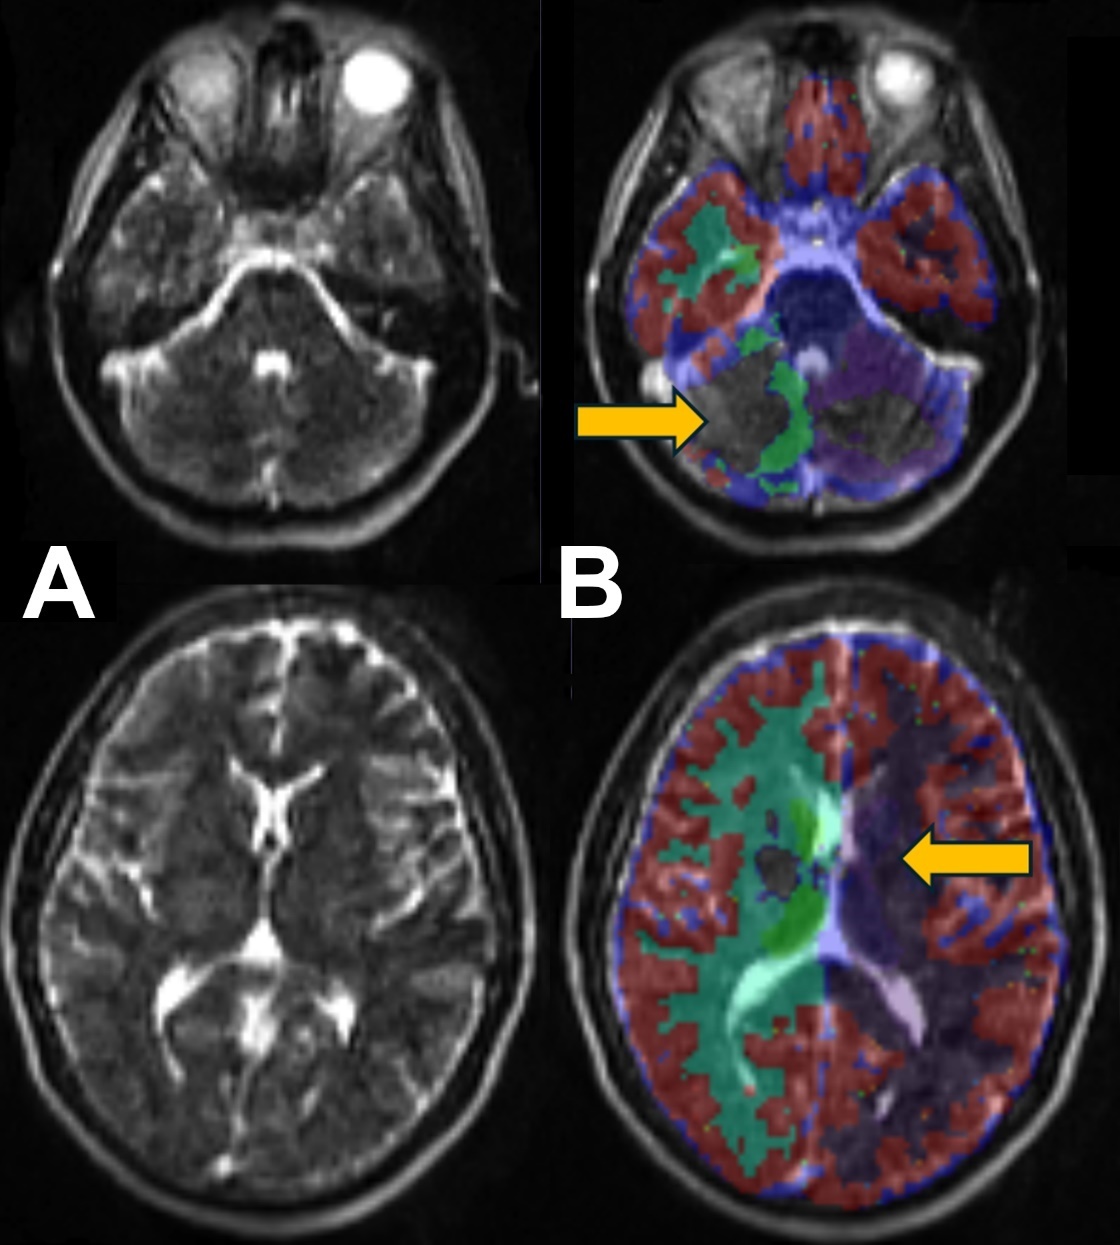
As anticipated, ICCs between test-retest volumes were consistently excellent for scans acquired using a 3T. They also were in general excellent using 64 mT scans (Table 3). Exceptions to this were a notable dip in ICC for the volume of the cerebellum whether using T1- or T2-WI scans and slights dips below the threshold (ICC > 0.9) in subcortical grey matter on T1-WI scans and in white matter on T2-WI scans observed on acquisitions using the 8.8.1 software. These results likely were related to signal loss and inhomogeneity in the basal and posterior areas, as well as deep grey matter, which are sources of inaccuracy for the segmentation, as depicted in Fig. 1. Bland-Altman plots also were produced, which demonstrated strong agreement between repeated measurements (Supplement A). Nearly all observations fell within the 95% limits of agreement, and there was no clear evidence of systematic bias. The noted lower ICC values from 64 mT volumes resolved in version 9.0.0, and image quality is appreciably improved on visual inspection (Fig. 2). Additional quality control statistical descriptions are provided in Supplement B.
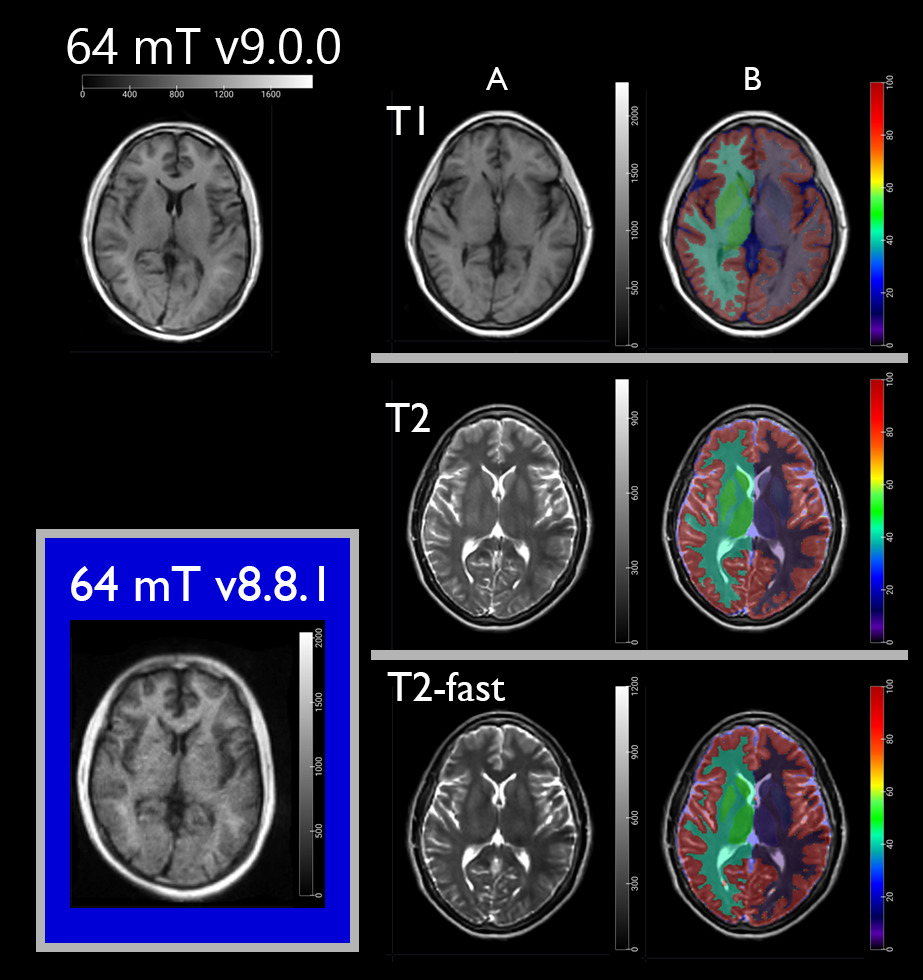
Given the high test-retest reliability of 64 mT scans following the 9.0.0 update, test-retest reliability for fine cortical and subcortical regions was explored in these participants (Table 4) and again demonstrated high ICCs. The ICCs were linearly correlated with the volume of the parcel (see Supplement C for plots), for both T1- and T2-based segmentation (R2 = 0.26 and 0.23, respectively), as expected, since agreement metrics are influenced by the number of voxels and larger parcels tend to yield higher ICC values.
External validity of brain volumes derived from T1-WIs
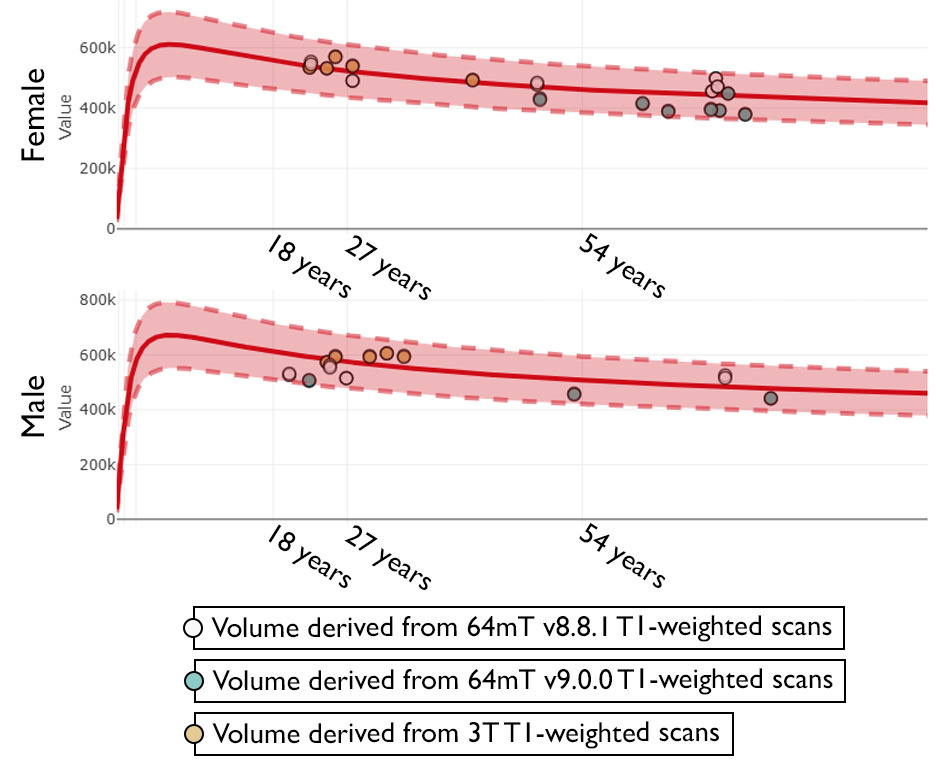
Brain volumes derived from 64 mT and 3T scans were compared with established sex-specific growth curves in BrainChart. BrainChart includes volumes from approximately 100,000 individuals and provides reproducible visualization of lifespan brain volume trajectories along with normalized centile scores for new data. Because no ground truth exists for validating extracted brain volumes, our goal was to assess whether the obtained volumes were consistent with exceptions for age and sex. All volumes fell within the normal range for the corresponding age and sex groups (Fig. 3), suggesting that 64 mT pMRI volumes derived using SynthSeg are comparable to volumes obtained from high-field scans processed with conventional MPRAGE-based pipelines.
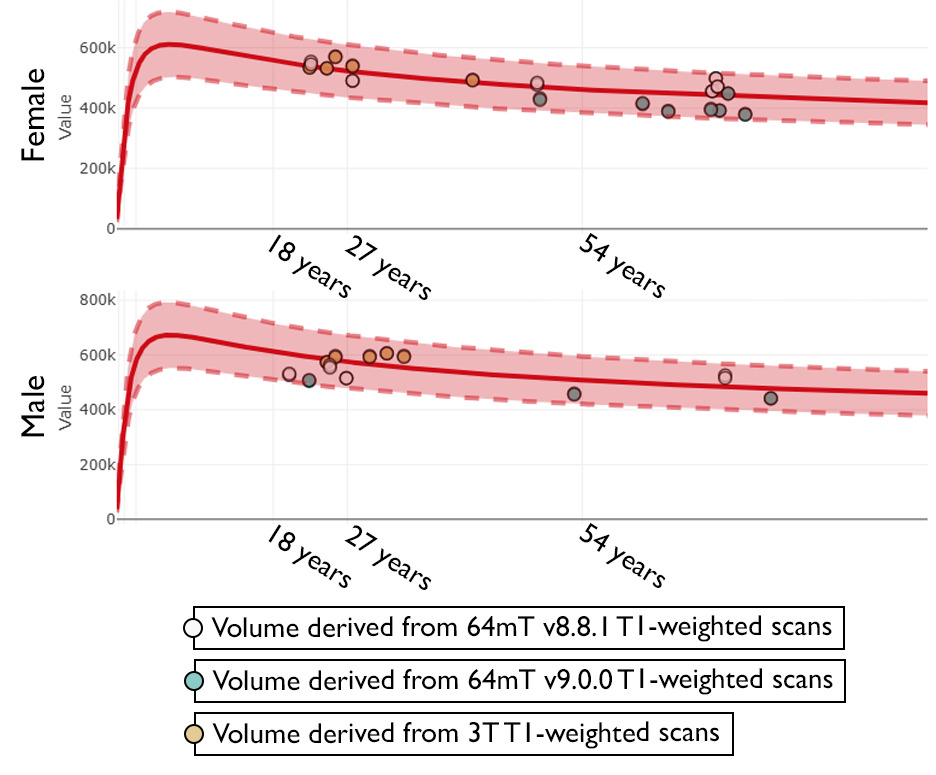
Volumes derived from both 64 mT and 3T scanners fell within the normal range for individuals of that age and sex. Figure generated in https://brainchart.shinyapps.io/brainchart/
Volumetric stability across software versions
Volumes obtained with pre-software upgrade (version 8.1.1) and post-software upgrade (version 9.0.0), in the two subjects who were scanned pre- and post-upgrade, were extremely well correlated (mean R² = 0.998). However, post-upgrade volumes were lower than pre-upgrade volumes for most brain regions (Supplement D). The cerebellum was an exception, showing higher volumes post-upgrade, which is attributable to signal loss pre-upgrade that led to partial and inaccurate segmentation of this structure.
Across regions, the volume shift between software versions was consistently larger than the corresponding within-version scan-rescan differences, indicating an upgrade-related effect that exceeded measurement repeatability. Although this suggests that measurements from different software versions should not be combined without adjustment, the systematic nature of the bias across supra-tentorial regions is consistent with a global scaling effect, implying that harmonization using simple scalar adjustments may be feasible. This is speculative and should be evaluated in a larger sample. The complete table of percentage bias between software versions across brain regions is provided in the Supplement E.
Discussion
The aim of the present work was to examine the stability and external validity of volumetric measurements derived from Swoop 64 mT portable MRI. Central to the appraisal of volumetric analysis feasibility in 64 mT MRI was the use of the SynthSeg pipeline47,48 for low-field MRI scans.49
Volume measurements generally demonstrated excellent test-retest stability. Notable exceptions to this trend were in the stability of macrostructural volume estimates for subcortical grey matter and the cerebellum derived from T1- and T2-weighted scans acquired with software version 8.8.1, which fell below the 0.9 threshold, whereas stability of 3T MRI was consistently high across all macrostructural volumes. The 9.0.0 Swoop system software likewise provided excellent stability across all macrostructural volumes. The 64 mT scans acquired with software version 9.0.0 are a comparably stable means of estimating brain volumes to those derived from 3T conventional MRI, and in some cases, the confidence intervals were modestly improved upon in the low field estimates. Additionally, the brain volumes obtained from 64 mT scans were comparable to those established in brain growth charts containing more than a hundred thousand brains. These results provide a substantial evidentiary foundation for utilizing this technology in longitudinal designs.
Given the high reproducibility of volumes from large brain structures of 64 mT scans processed with the 9.0.0 software, volumetric measurements taken from finer structures also were examined for volumetric stability. While finer volumetric measurements’ stability was high when obtained from both T1- and T2-WIs, lower stability was noted when structures were too central or too caudal, such as the pallidum and amygdala. For small, deep structures, it is not clear whether further innovation will improve the performance of 64 mT MRI or whether these represent true limitation of the technology.
On the other hand, signal lost in the cerebellum and low posterior areas may reflect differences in positioning relative to the low-field MRI radio frequency coils. Traditional MRI allows technicians to clearly see and optimize the patient’s head position inside the coil, using close-fitting coil structures and extensive padding to stabilize the head and body. In 64 mT MRI, the head position cannot be directly observed, and patients must enter the scanner by lifting themselves with a grab bar or being assisted by staff. Positioning is checked only through a brief structural scan. Limited padding allows patients to shift forward, especially at the chin or hips, affecting head position. However, anecdotally, while holding a stiff neck posture improves cerebellar volume stability, it still does not achieve test-retest stability of values seen for cerebral measures, suggesting residual effects from field inhomogeneity also plays a significant role.
A final crucial observation was the suggestion that volumes derived from different software versions differ significantly and should not be directly combined. This is unsurprising: combining data across conventional high field MRIs also is an activity that is fraught with challenges and limitations. Volumes derived from the more recent 9.0.0 give lower estimates than from 8.8.1. The systematic bias suggests that relatively simple scalar harmonization may be feasible if future investigative teams need to combine data across software versions. However, this possibility remains speculative and should be critically evaluated in a larger dataset and additional conventional comparators. In addition, our observation is specific to the two tested versions, and there is no evidence that it applies to future upgrades.
These observations suggest that current software and hardware on the Swoop 64 mT MRI system has resolved some of the negative observations of volumetric properties reported in previous investigations. Larger confidence intervals for volume measurements of brain white matter, grey matter, and intracranial volume that Deoni et al. ascribed to higher signal-to-noise ratios appear all but resolved.34 In fact, the confidence intervals for all three were slightly smaller than those observed here using a representative sample of patients scanned repeatedly using conventional 3T MRI. Though we were unable to assess correspondence of values to those derived from 3T scans directly (i.e., the same patients did not receive scans on both devices and the method was not designed for this purpose), test-retest stability using both 8.8.1 and 9.0.0 improved upon ICCs on large regions found by Váša et al.36 though these changes were fine-grain given the already high values reported using software version 8.6.0. An additional reason for this improvement might be the use of the latest version of SynthSeg-FreeSurfer (version 8), which is further trained and better optimized for low-field MRI segmentation. Finally, our work suggests that the decision made by Hsu et al. to combine data across a wide range of software versions (8.2.0-8.6.1) in their investigation may need to be interpreted with caution.39
An important limitation of our approach was the small sample size, which could limit generalizability, particularly of the results of regional analyses, for which large confidence intervals likely were influenced by small sample size. Moreover, those scanned across scanners and versions were separate samples, which could potentially introduce a source of variability across comparator absolute values, though there was no reason to anticipate variability as a function of measurement stability within a given individual measured at a given timepoint. Finally, software updates between system versions include proprietary AI-based reconstruction components that are not fully transparent to end users, and raw data are not accessible for independent reprocessing. This limits the ability to attribute observed differences in quantitative metrics to specific algorithmic changes. As a result, caution is required when comparing results across software versions, and longitudinal studies should ideally be performed within the same system version whenever possible.
These findings constitute a crucial foundation for the use of 64 mT MRI in monitoring brain volume loss over time, as is applicable to neurodegenerative diseases. This application of portable, accessible MR technology has a high potential to improve our understanding of the relationship between acute neurological conditions and chronic neurodegeneration as well as later stages of neurodegenerative disease. Ultra-low field scanners can improve patients’ ability to access traditional MR facilities, resulting in lower attrition from many clinical investigations.
Data and code availability
Tabulated data and code will be made available through the Vivli repository, https://doi.org/10.25934/PR00012002. The limits of our informed consent and ethical banking do not permit the banking of images.
Funding sources
Data were acquired through support from NIH/National Institute on Deafness and Other Communication Disorders (NIH/NIDCD) R01 DC05375 and by Hyperfine, Inc. MDS, AVF, VN, IDC, and AEH are supported by NIH/National Institute on Deafness and Other Communication Disorders (NIH/NIDCD): P50 DC014664 and R01 DC05375. AVF is supported by NIH/NIBIB P41 EB031771.
Conflicts of interest
AEH receives compensation from the American Heart Association as Editor-in-Chief of Stroke. MDS, AVF, VN, IDC, and AEH receive salary support from NIH (NIDCD) through grants.