
1. Introduction
This work addresses a central question in neuroimaging: how are functional interactions between brain regions supported by the structural architecture of the brain? Functional interactions can be studied with functional MRI (fMRI),1–3 whereas diffusion-weighted MRI (dMRI) provides sensitivity to tissue microstructure and white-matter organization.4–6 However, the common practice of representing the brain as a parcellation-level graph imposes an inherent limitation: structural connectivity is reduced to connections between predefined regions, even though the underlying anatomy is continuous, spatially extended, and locally organized at a much finer scale. This work proposes a way to use the voxel-level structural information in investigation of the functional connections.
The structural connectome is often estimated using dMRI tractography, but streamline reconstructions are sensitive to modelling assumptions and may contain substantial false-positive and false-negative pathways.7–10 This is particularly problematic for parcellation-level function-structure analyses: a functional relationship between two regions is not necessarily supported by a single direct reconstructed tract between the same parcels. Instead, functional connectivity may reflect indirect, polysynaptic, distributed, or spatially extended structural support.11–16 Together, these issues motivate complementary uses of dMRI in which the diffusion-derived brain microstructure is modelled more directly, rather than first reduced to a parcel-wise tractography connectome.
A relevant lineage of dMRI methods is graph-based modelling. Early graph-theoretical tractography represented the brain as a voxel-wise graph, with voxels as nodes and local diffusion information defining edge weights between neighbouring voxels.17,18 Related fast-marching, geodesic, and global tractography frameworks similarly used diffusion information to define local costs, transition probabilities, or optimization problems over the image domain.19–23 While these methods were mainly designed to recover anatomical pathways, they were based on a more universal idea: dMRI can define a voxel-wise structural graph. Their limited subsequent use likely reflects the dominance of streamline tractography and parcel-wise connectomics as more practical and interpretable summaries of dMRI data, rather than a failure of the voxel-wise graph idea itself.
The present work reopens this voxel-wise diffusion-graph view with a new purpose. Rather than searching the graph for the most likely or shortest dMRI pathways, I propose to use it as a structural network on which resting-state fMRI-derived functional coupling values are imposed as boundary conditions. This allows structural support to be modelled before it is compressed into parcel-wise edges, reducing the problem of indirect structural links between large brain parcels.
The proposed method should not be seen as another path-reconstruction algorithm as the computational objective is to solve a constrained field over the graph rather than to reconstruct a streamline trajectory. This distinction applies to the solving step, not to the reliability of the graph itself. The structural graph remains diffusion-derived and inherits uncertainty from fibre orientation distribution (FOD) estimation, partial-volume effects, crossing-fibre ambiguity, limited spatial and angular resolution, registration, and the absence of explicit anatomical boundary constraints.7 Tractogram-like displays derived from the solved current field are therefore secondary visualizations rather than the primary output.
This study builds on my previous constrained-Laplacian formulation of brain function-structure coupling.24 In that work, functional relationships were imposed as constraints on a structural graph obtained from dMRI tractography, producing edge-centric estimates of how functional coupling is supported by structural connectivity. The present method extends this idea from regional structural connectomes to voxel-level. Instead of starting from a parcel-wise structural connectivity matrix, the whole-brain graph is constructed from FODs and uses the functional coupling to condition the resulting structural field. A Python implementation of the proposed method is available at https://github.com/vilsaira/fscpy.
2. Theory
The voxel-wise function-structure coupling (FSC) formulation follows the constrained-Laplacian FSC terminology introduced previously,24 but replaces the regional structural connectome with voxel-wise dMRI-derived structures. The structural network is represented as an undirected weighted graph
\[G = (V,E,W),\tag{1}\]
where is the set of voxels (nodes), is the set of neighbouring voxel interfaces (edges), and is the weighted adjacency matrix. This voxel-wise graph representation follows earlier dMRI graph formulations in which voxels are treated as graph nodes and local diffusion information defines edge weights between neighbouring voxels.17,18,25–27
To create this graph representation, fibre orientation distributions (FODs) derived using constrained spherical deconvolution9,28 are used. In contrast to graph-based tractography, the FOD-derived weighted adjacency matrix defines the structural conductances on which the constrained FSC problem is solved instead of finding purely structural routes.
Mathematically, FOD can be defined as in voxel evaluated in direction Because spherical harmonic FODs may contain small negative values, only the positive component is used:
\[F_i^{+}(\mathbf{u}) = \max\left(F_i(\mathbf{u}),0\right).\tag{2}\]
To suppress non-directional FOD amplitude, an orientation-selective support function is defined by subtracting the local isotropic component,
\[\begin{align} s_i(\mathbf{u}) =& \max\left(F_i^{+}(\mathbf{u})-\alpha\bar{F}_i,\ 0\right), \\ \bar{F}_i =& \frac{1}{4\pi}\int_{\mathbb{S}^{2}} F_i^{+}(\mathbf{v})\,d\mathbf{v},\end{align}\tag{3}\]
where controls the suppression of isotropic support. The default choice retains directional FOD amplitude above the local isotropic baseline.
For neighbouring voxels and is the unit direction between voxels, and is the corresponding physical edge length. The voxel-interface weight can then be defined as bidirectional endpoint support,
\[w_{ij} = \frac{1}{\ell_{ij}}\sqrt{s_i(\mathbf{u}_{ij})s_j(-\mathbf{u}_{ij})}.\tag{4}\]
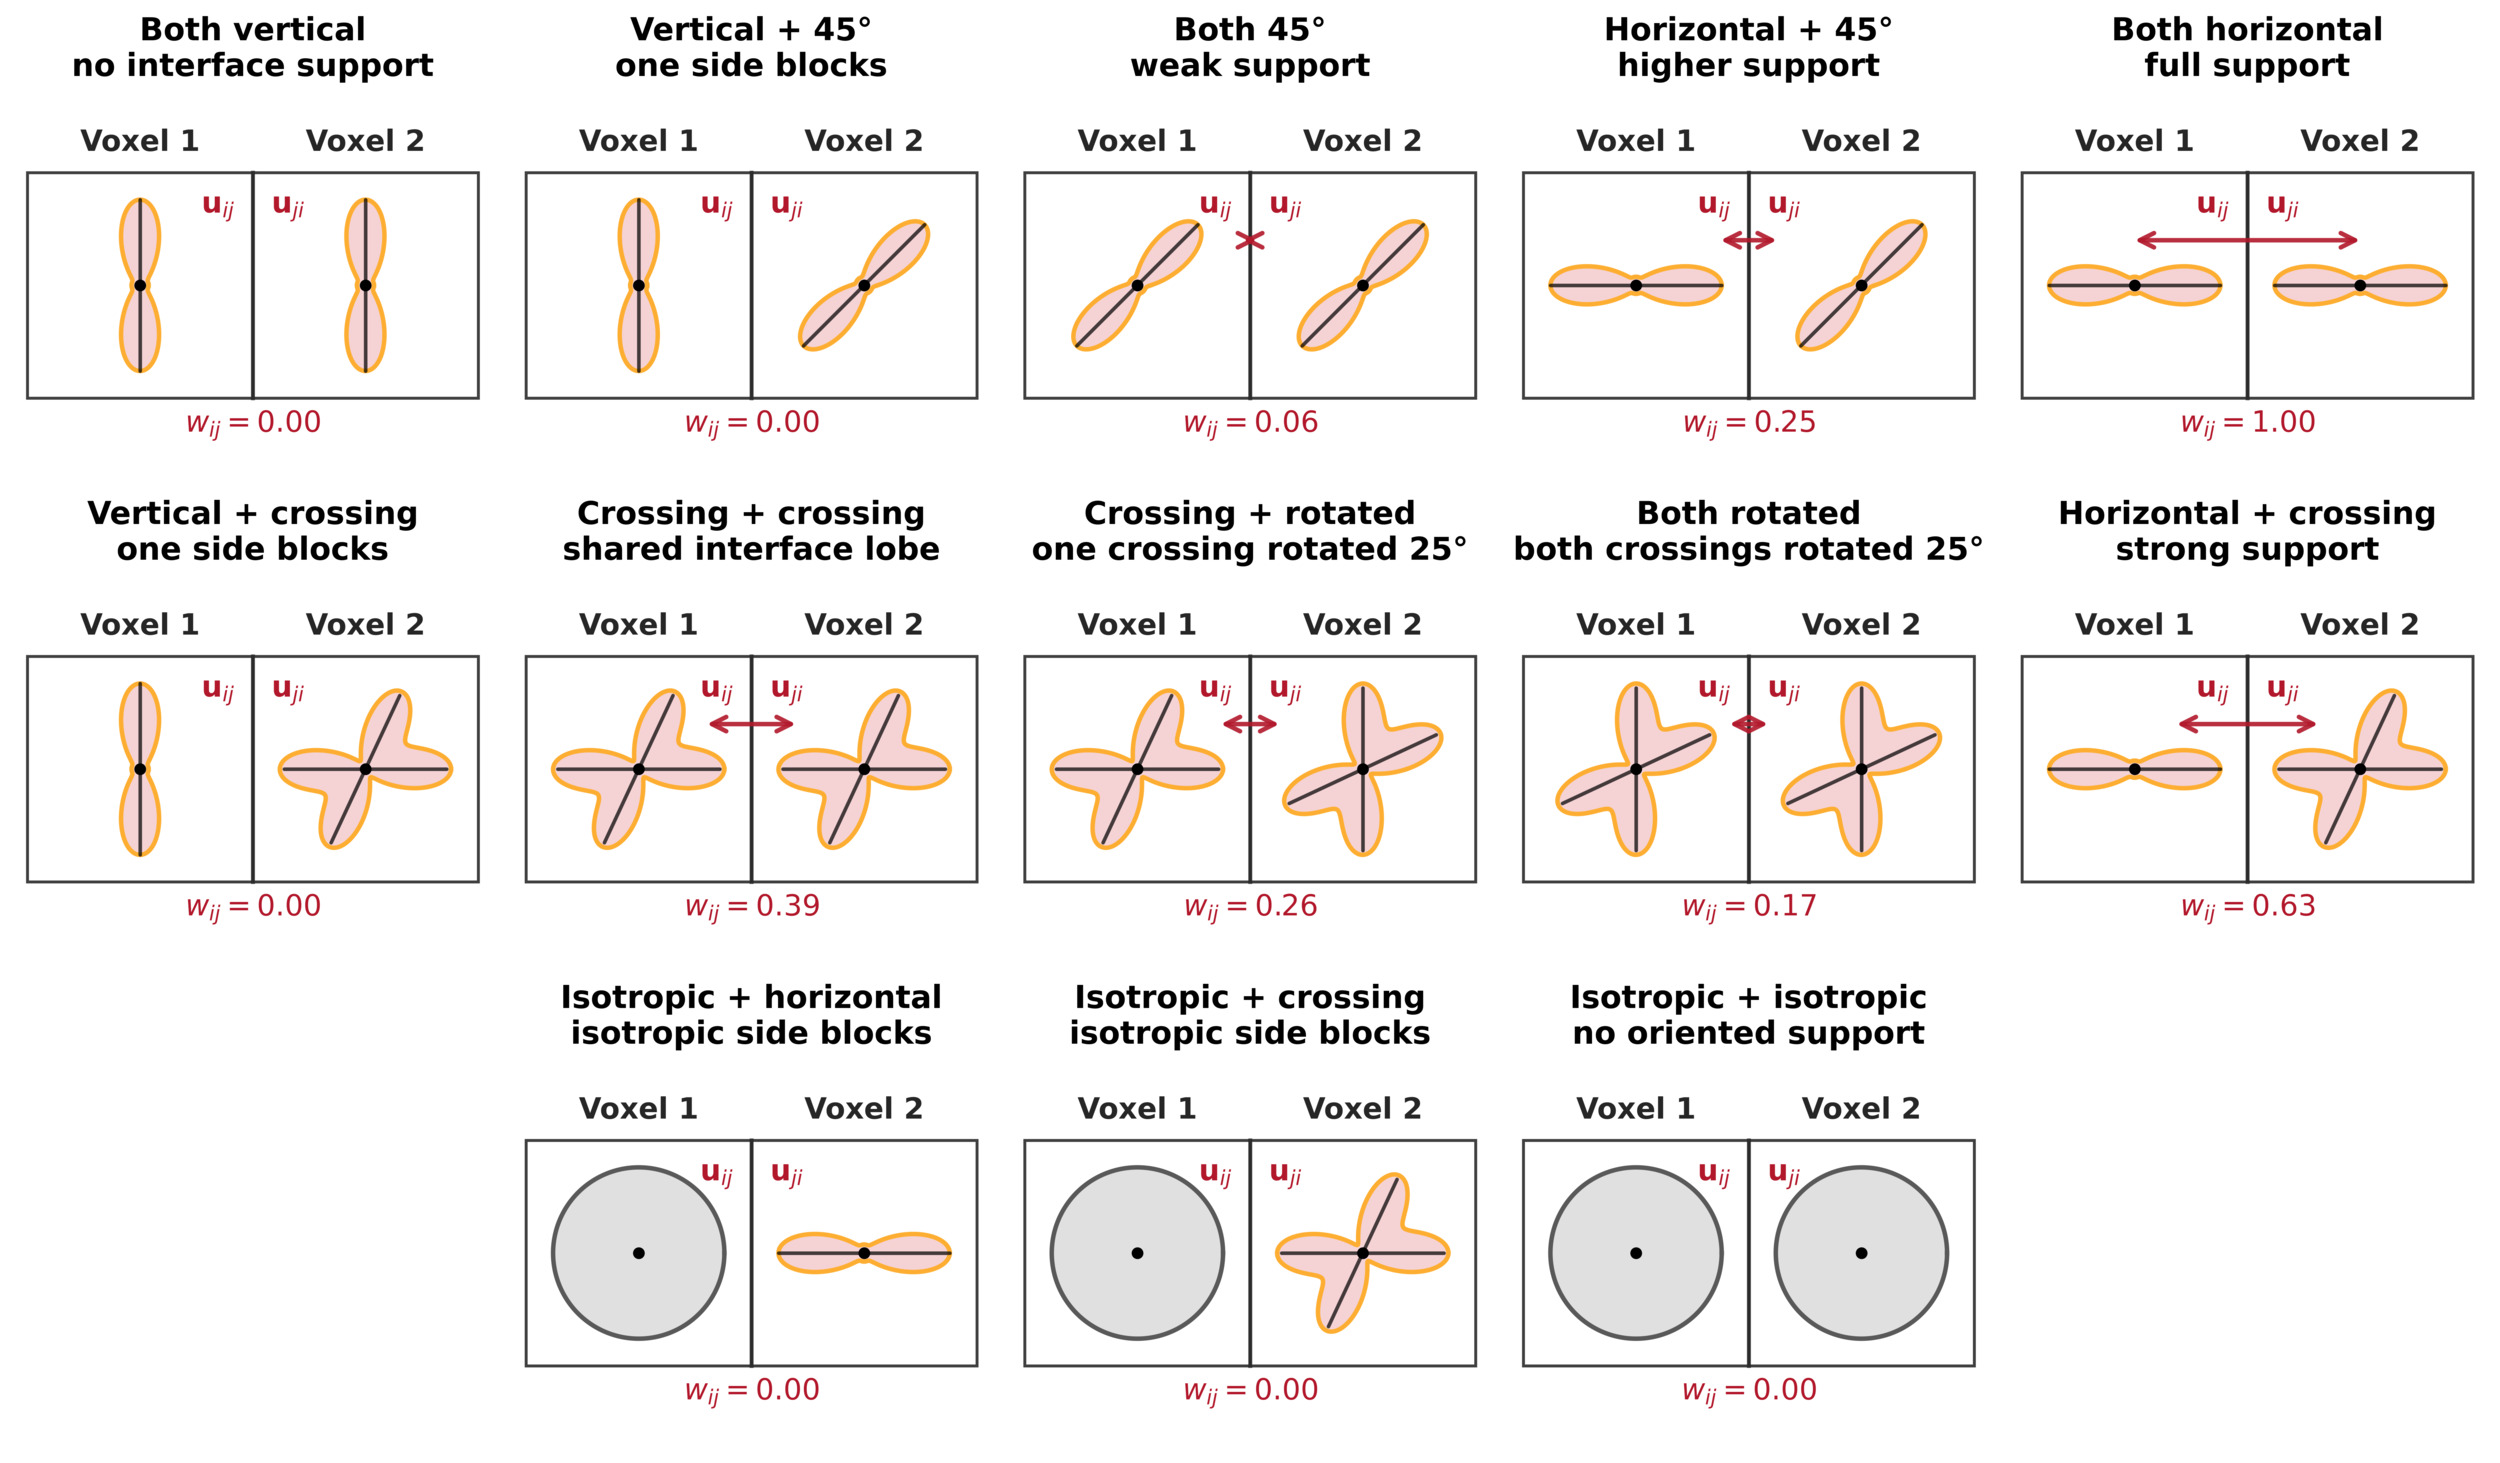
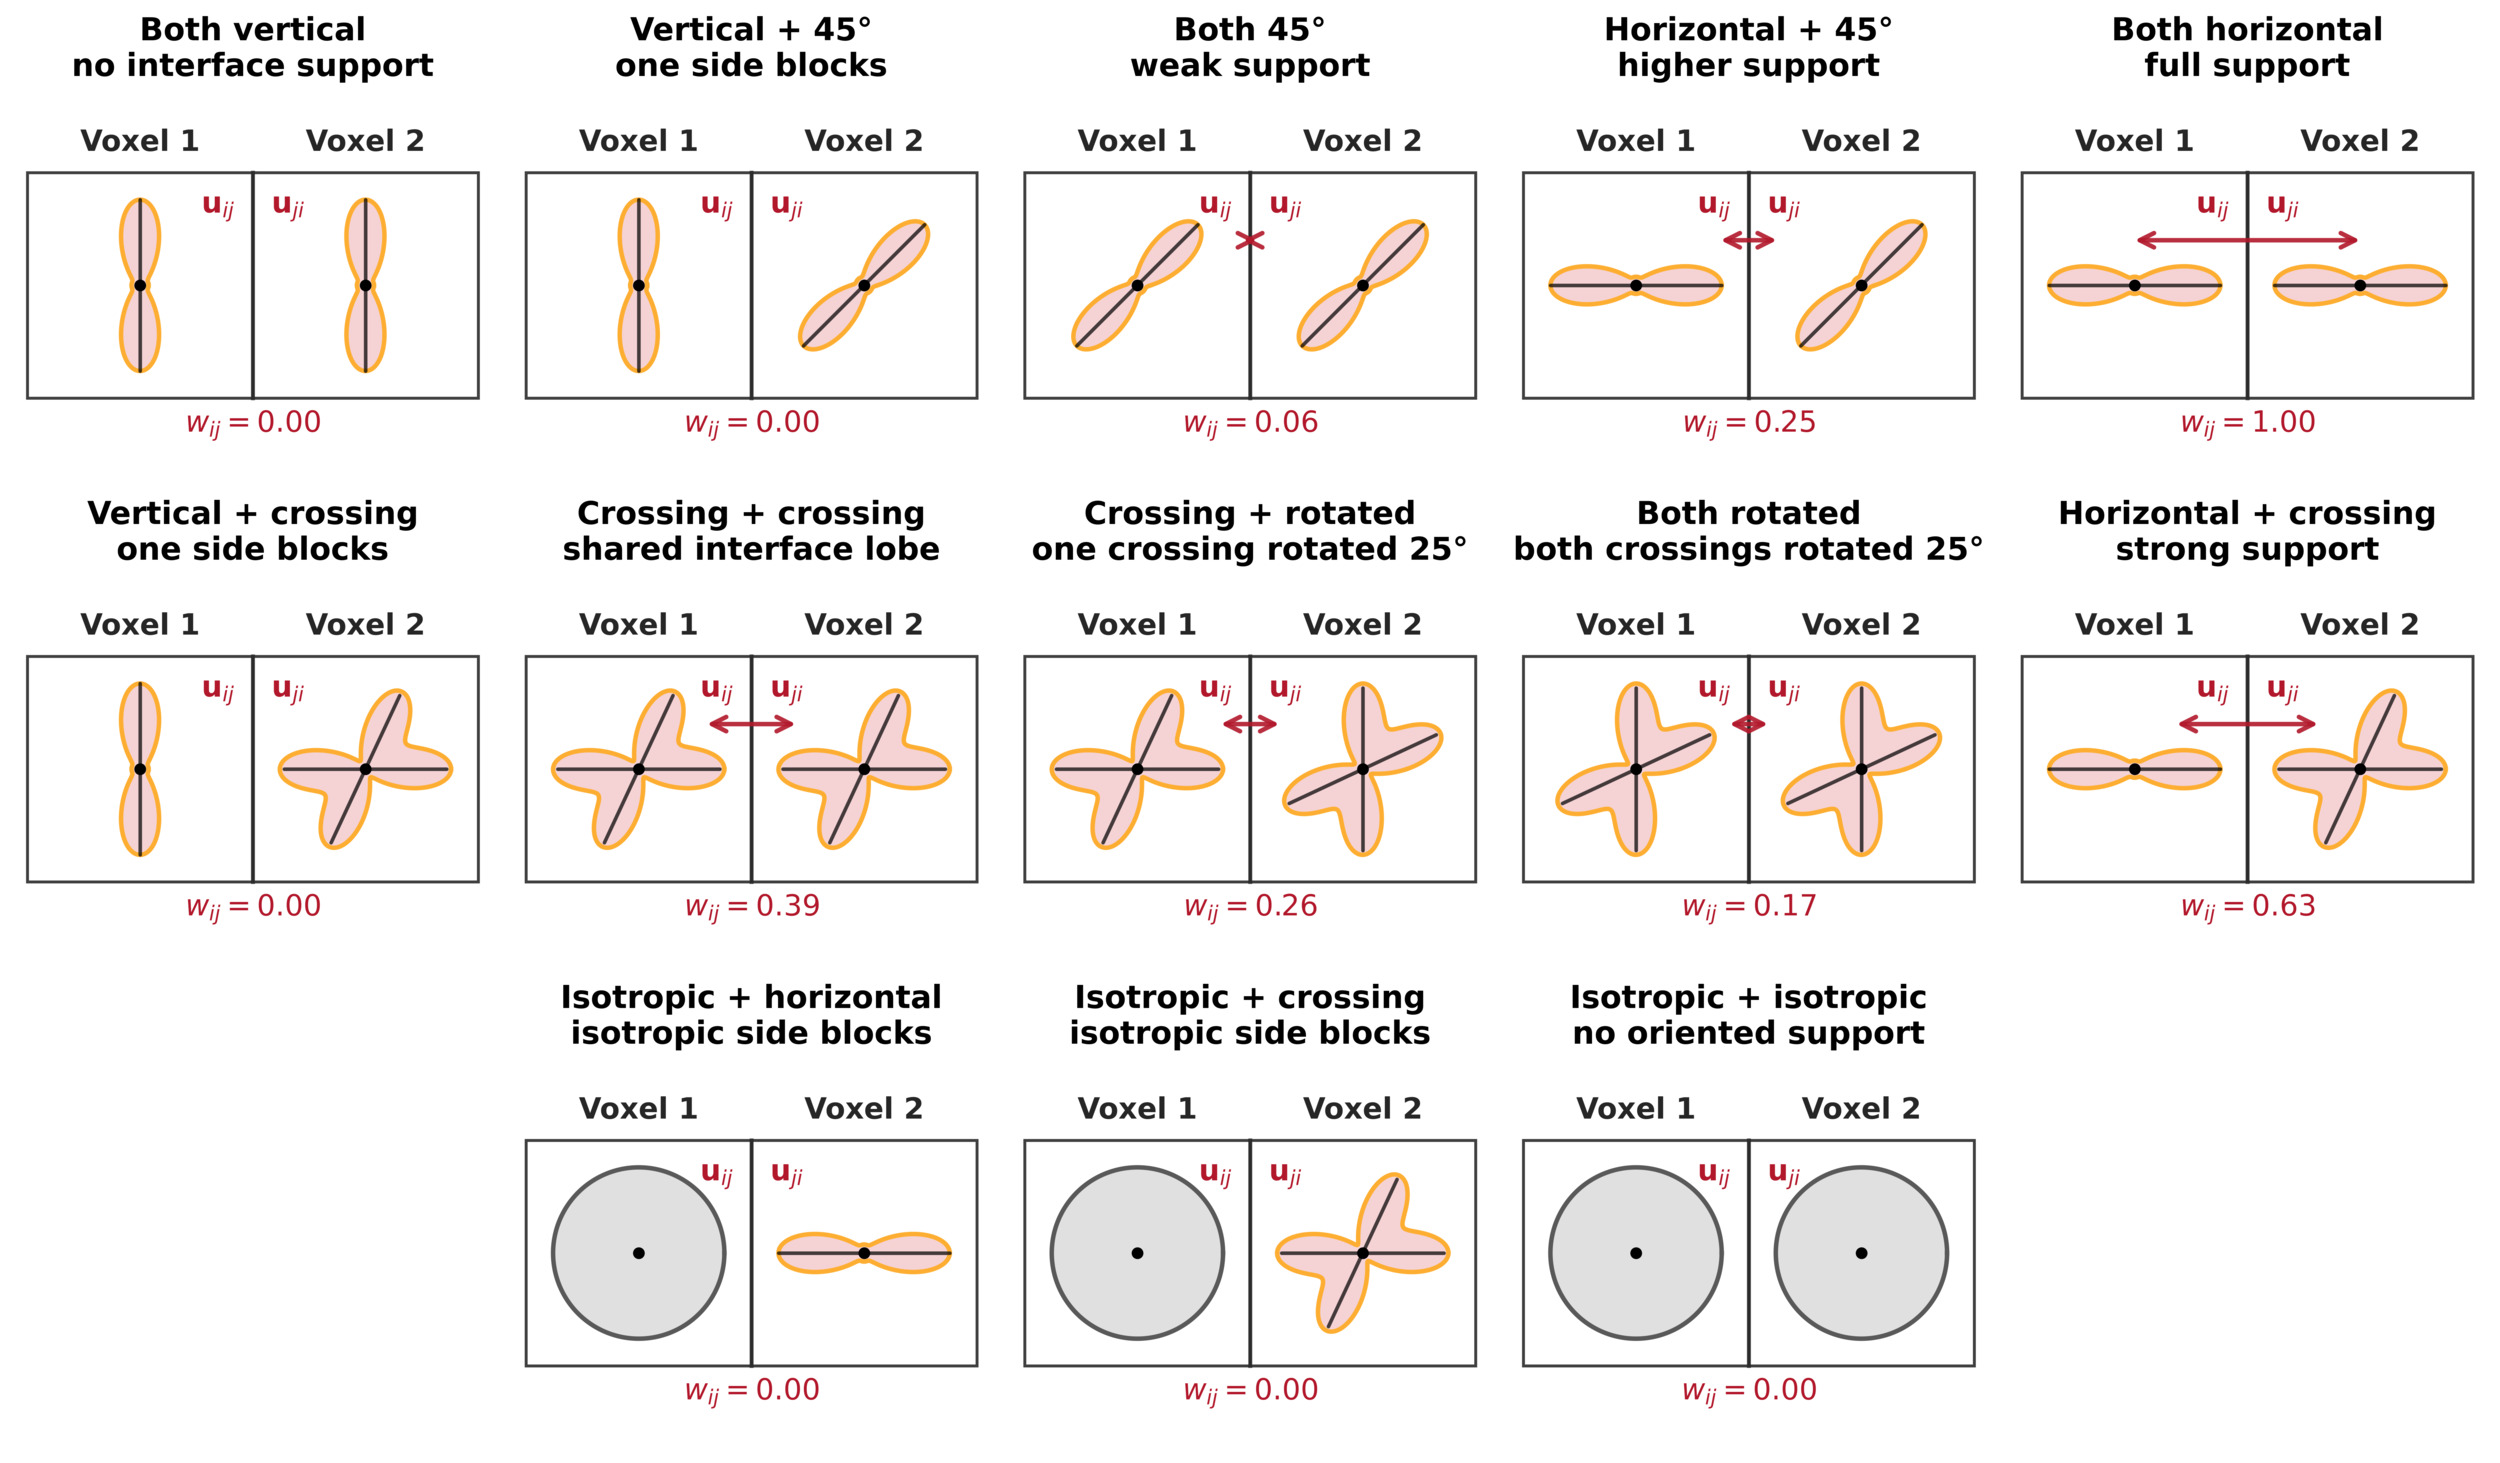
This formulation ensures that an interface receives high conductance only when both adjacent voxels provide oriented support for the interface direction. The geometric mean acts as a bottleneck rule: high support at one endpoint cannot compensate for absent support at the other. Simple toy examples to illustrate this are shown in Figure 1.
Although voxel-wise FODs are usually antipodally symmetric, the bidirectional evaluations on voxel interfaces are conceptually distinct because the edge represents a region between two neighbouring orientation fields. This neighbourhood-aware view is related to the broader observation that adjacent voxels contain information about local fibre geometry that is not fully captured by purely voxel-wise symmetric representations.29 The present method does not require asymmetric FODs, but it uses both sides of the voxel interface when assigning structural support.
The weighted adjacency matrix is defined by for and otherwise. The graph is undirected, so and the formulation does not infer directed or source-to-target influences. The degree matrix and graph Laplacian are
\[D = \mathrm{diag}\left(\sum_j W_{ij}\right), \qquad \mathcal{L}=D-W.\tag{5}\]
Equivalently, using the edge-incidence representation,24
\[\mathcal{L}=B_G C_G B_G^{\top},\tag{6}\]
where is the oriented incidence matrix of the voxel graph and contains the voxel-edge conductances. This follows standard spectral graph theory and graph signal processing notation.30,31 The subscript distinguishes the voxel-graph incidence matrix from the functional-constraint incidence matrix defined next.
To impose functional coupling (FC) values as potential difference constraints, define which contains the imposed coupling values, and which is the functional-constraint incidence matrix whose columns define the constrained node pairs. The empirical constraints are
\[B_{\mathrm{fc}}^{\top}\mathbf{\phi}=s_{\mathrm{fc}},\tag{7}\]
where contains the voxel-wise graph potentials. Using modified nodal analysis,24,32,33 these constraints are solved jointly with the voxel-wise Laplacian system as
\[\begin{bmatrix} \mathcal{L} & B_{\mathrm{fc}} \\ B_{\mathrm{fc}}^{\top} & 0 \end{bmatrix} \begin{bmatrix} \mathbf{\phi} \\ i_s \end{bmatrix} = \begin{bmatrix} 0 \\ s_{\mathrm{fc}} \end{bmatrix},\tag{8}\]
where are auxiliary source currents enforcing the imposed functional constraints.
Once nodal potentials have been solved, voxel-edge flows or currents are obtained by applying the graph gradient and weighting it by the voxel-edge conductances:
\[f = C_G B_G^{\top}\mathbf{\phi}.\tag{9}\]
For an individual voxel interface this corresponds to
\[I_{ij}=w_{ij}\left(\phi_i-\phi_j\right).\tag{10}\]
The sign of depends on the arbitrary orientation assigned to the edge, whereas indicates how strongly the imposed functional constraints use that local structural interface. A voxel-wise support map is obtained by summing the magnitudes of all edge currents incident on each voxel,
\[J_i = \sum_{j \in \mathcal{N}(i)} |I_{ij}|,\tag{11}\]
where is the set of graph neighbours of voxel
The resulting potentials, edge flows, and support maps retain the edge-centric constrained-Laplacian interpretation of the previous FSC model,24 but the structural network is now a voxel-wise FOD-derived graph rather than a regional tractography-derived connectome. This also connects voxel-wise FSC to broader Laplacian and connectome-harmonic approaches in which structural graph operators constrain functional organization.12,14,34,35 The implicit circuit analogy remains mathematical rather than biophysical: potentials and currents describe how the structural graph accommodates imposed statistical relationships, not causal neural signal transmission.
The interface conductances should be interpreted as FOD-derived model weights rather than measurements of anatomical connection strength, axonal density, or fibre cross-sectional area. Baseline subtraction and geometric-mean weighting require directional support at both sides of an interface, but do not establish that the interface represents a genuine anatomical fibre continuation. The current formulation contains no global conductance-calibration step equivalent to tractogram-weighting approaches such as SIFT2.36
3. Methods
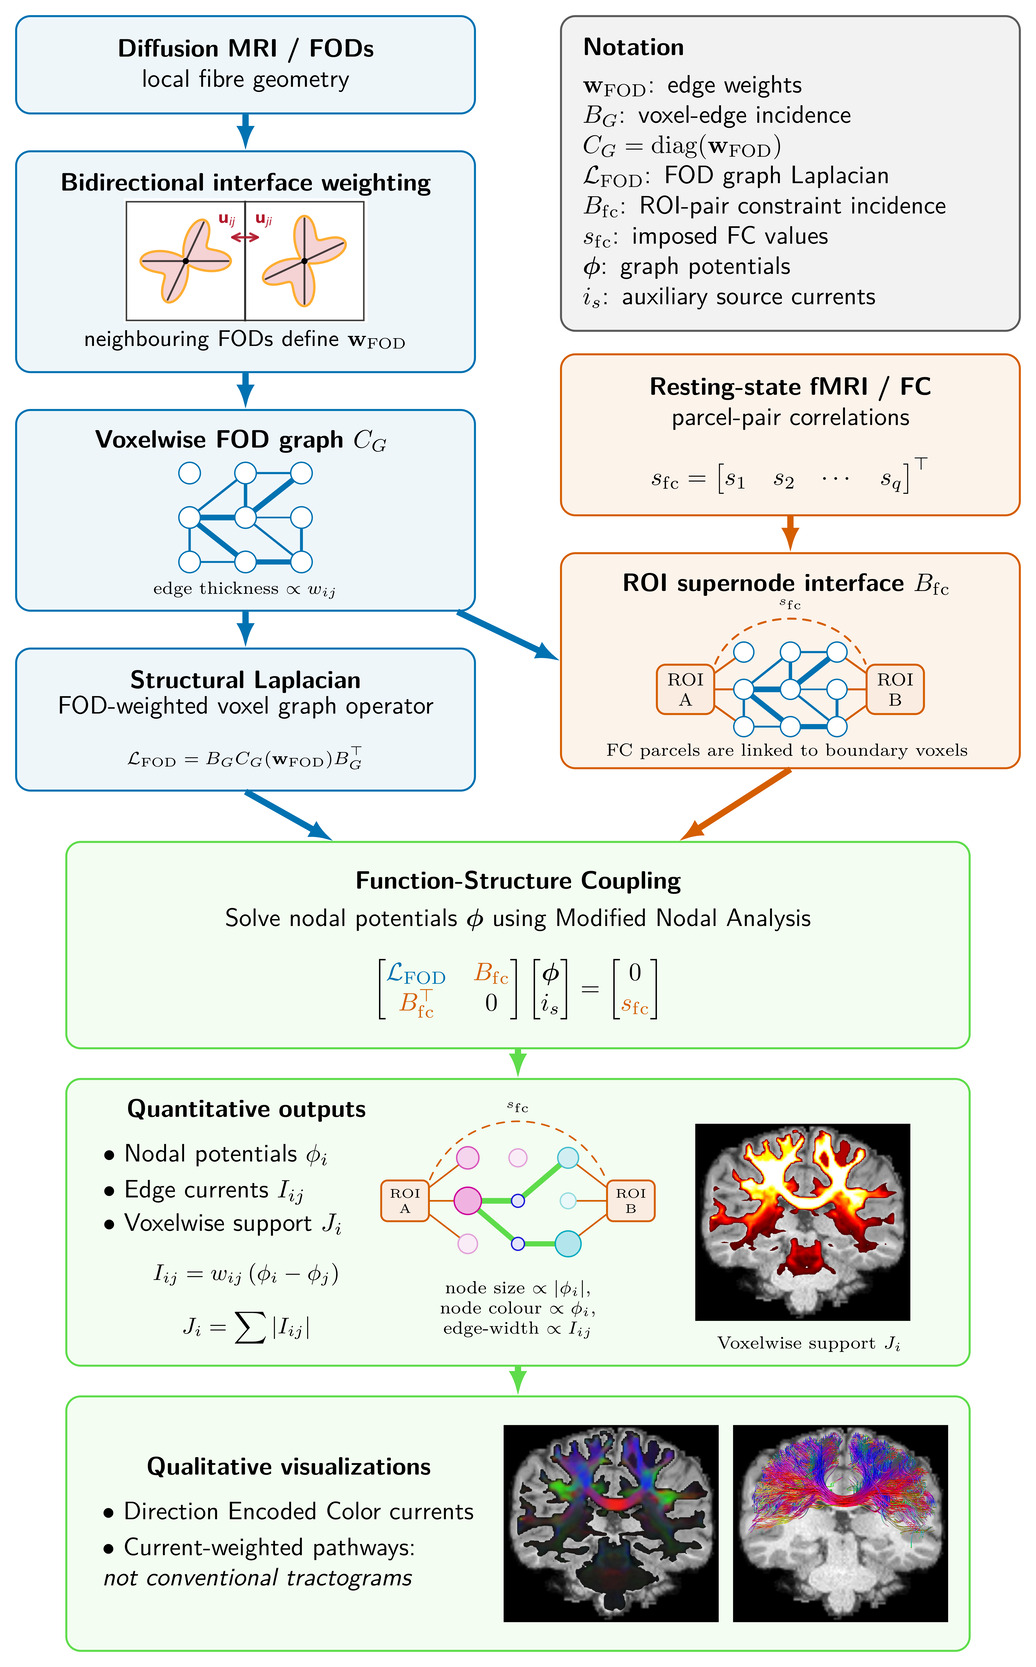
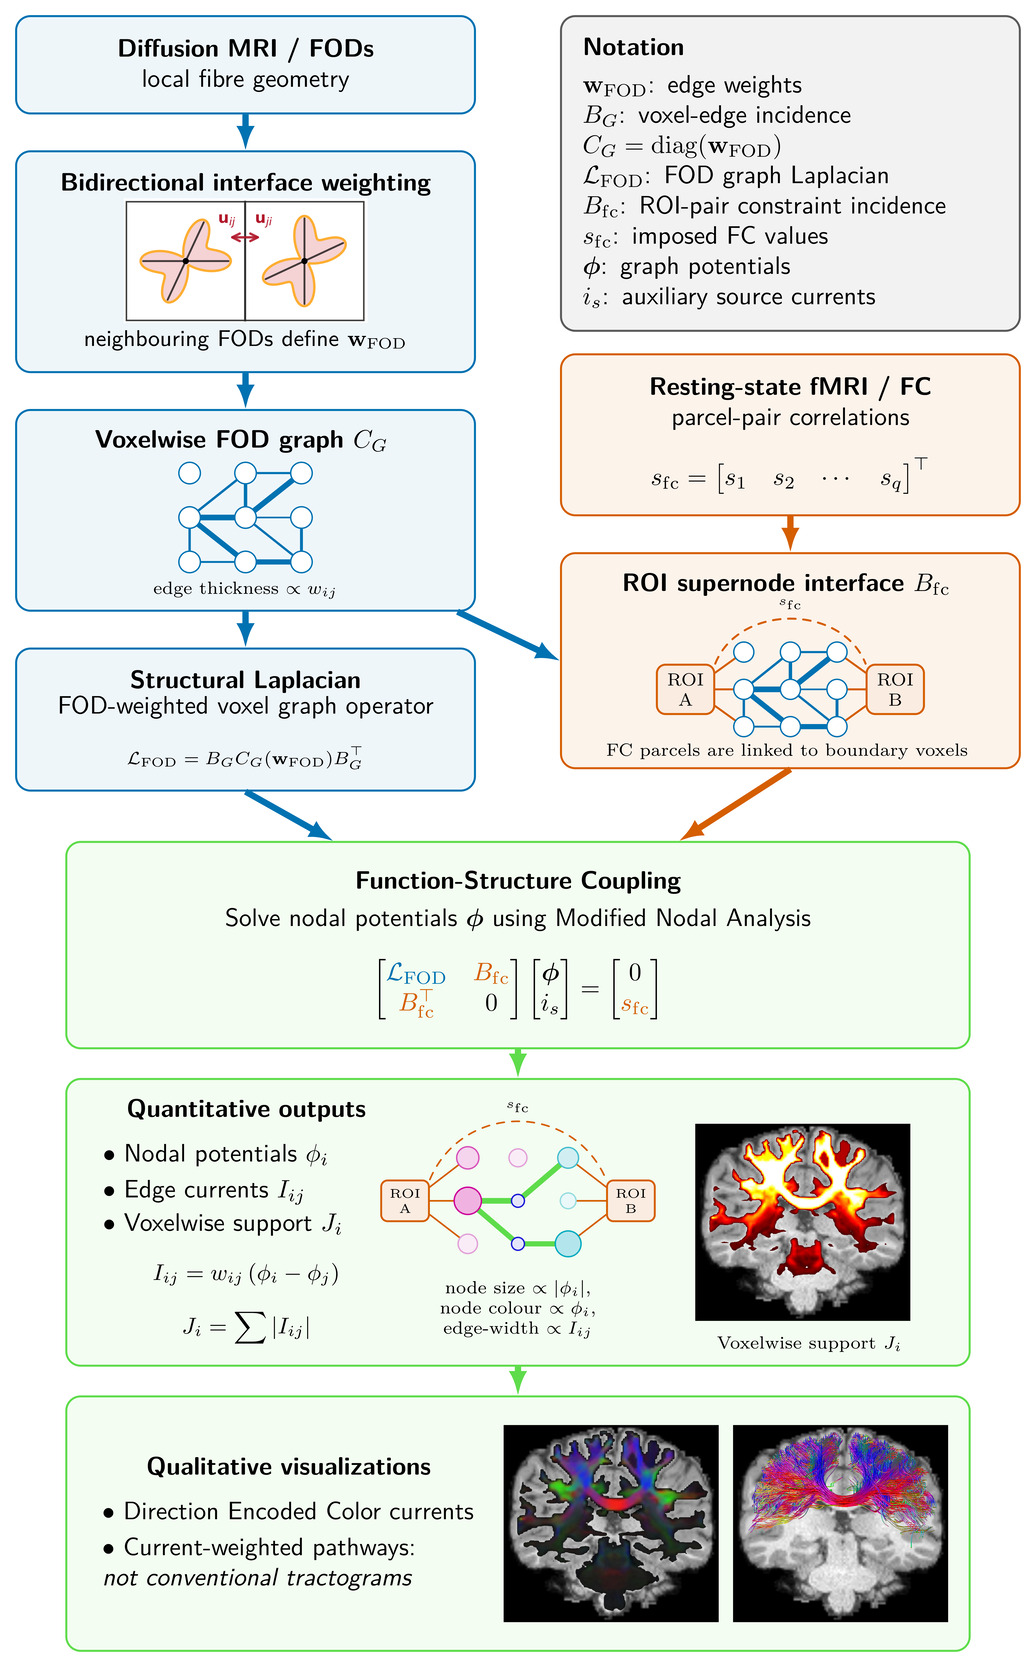
The evaluation consisted of six complementary stages. First, an in-silico FiberCup experiment was used as an implementation-level sanity check of graph construction, constraint encoding, and support extraction on a known synthetic structure (Section 3.1). Second, voxel-wise FSC was applied to HCP data using the Schaefer200 parcellation37 to evaluate the method at a finer functional scale, generate seven-network support maps in all three subjects, and compare voxel-wise FSC with tractography-style displays (Sections 3.2 to 3.4). Third, random permutations of FC-pair labels were performed in all three subjects to measure how strongly support-map organization depended on the anatomical placement of the functional constraints (Section 3.5). Fourth, the analysis was repeated with the 68-region Desikan-Killiany parcellation38 to match the original region-level FSC study24 (Section 3.6). Fifth, Schaefer parcellations containing 100-1000 regions were evaluated to separate effects of parcel scale from differences between atlas construction schemes. Sixth, within-subject test-retest reproducibility was assessed using matched phase-encoding directions (Section 3.7). An overview of the voxel-wise FSC workflow is shown in Figure 2.
3.1. In-silico FiberCup sanity check
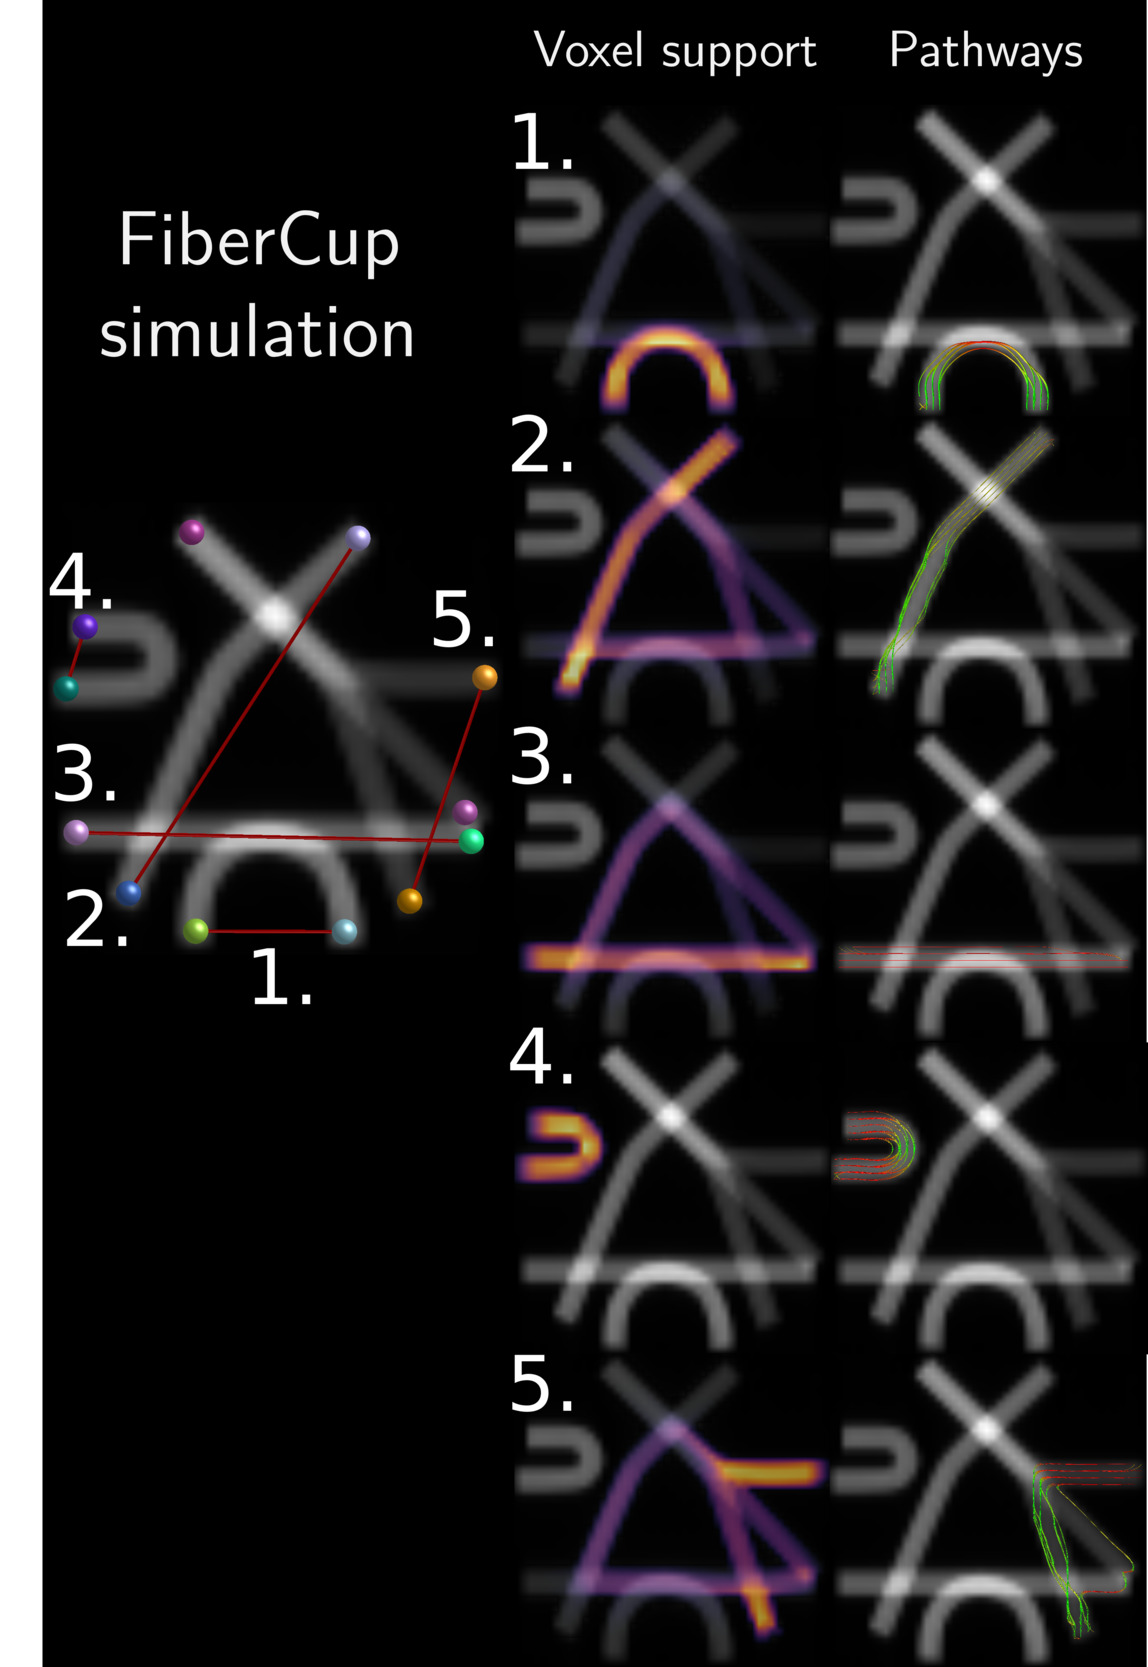
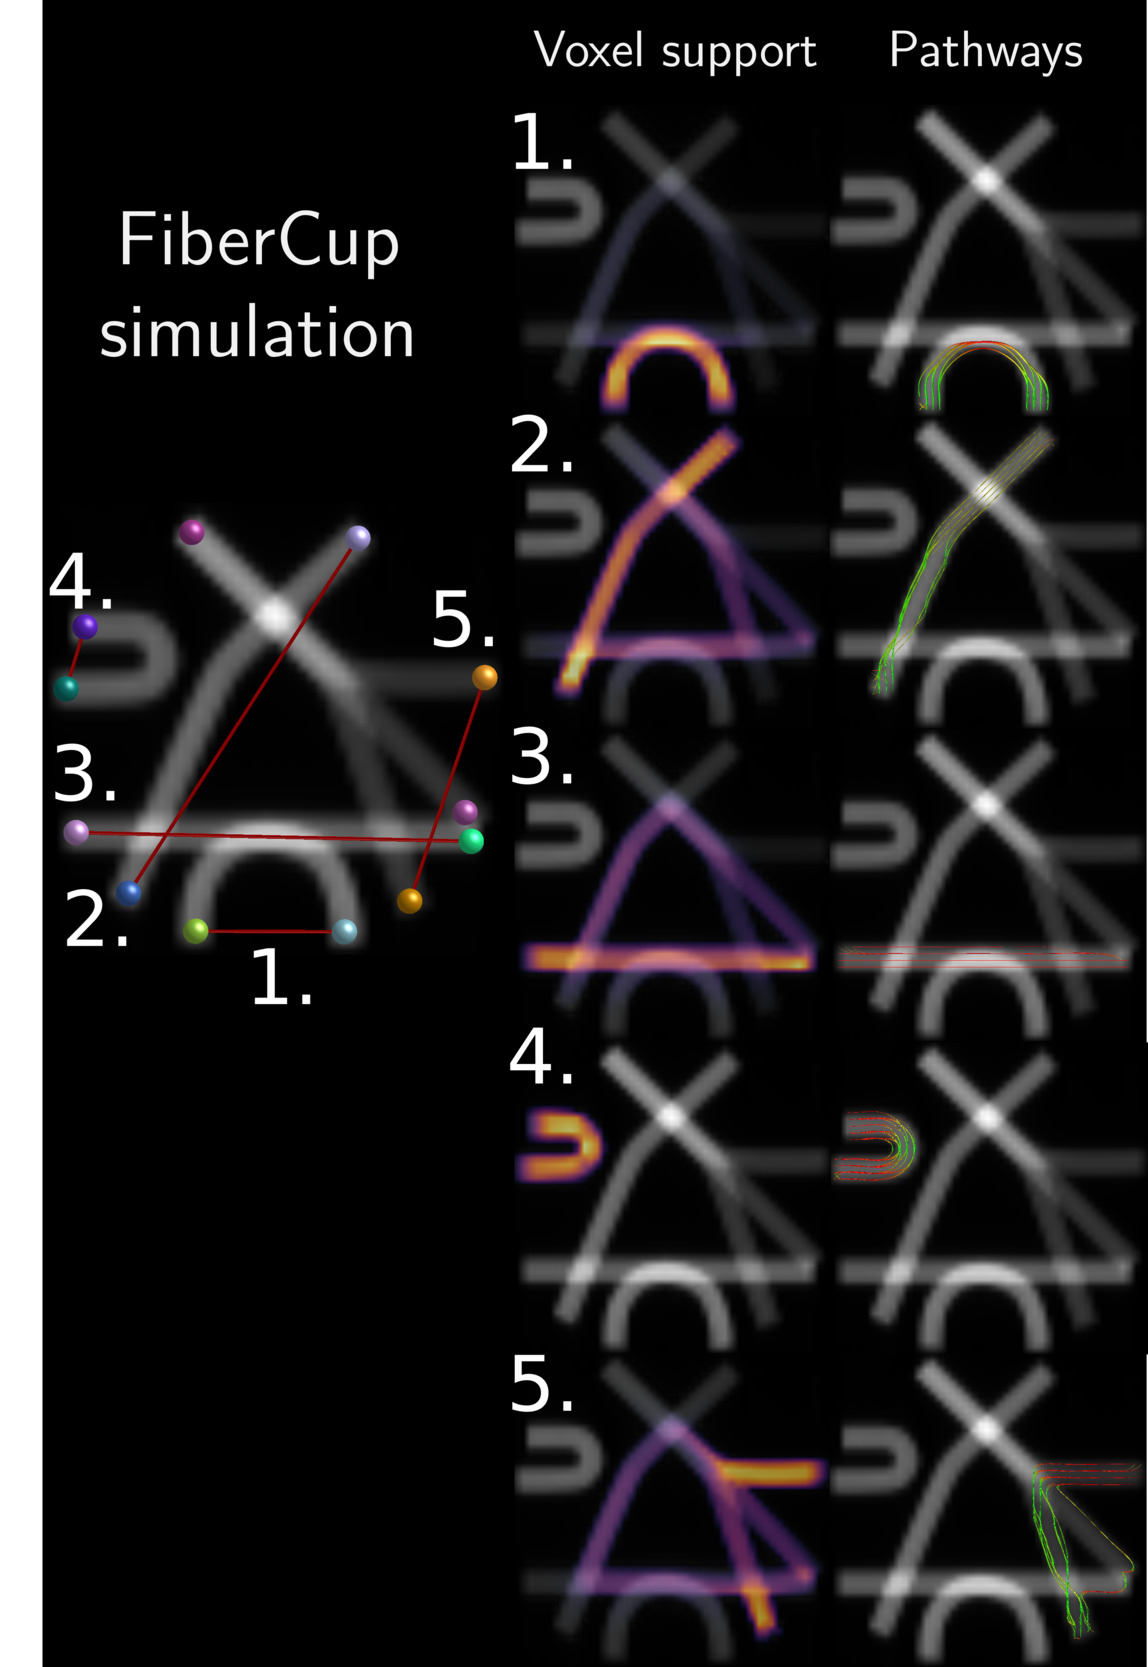
The voxel-wise FSC implementation was evaluated using the FiberCup diffusion phantom, which provides a controlled synthetic structure with known fibre configurations.39–41 The aim was not to establish biological validity, but to provide an implementation-level sanity check showing that imposed functional relationships could be mapped onto a known FOD-derived fibre architecture and that the problem would be numerically solvable.
The in-silico functional simulation followed the FiberCup experiment described in my previous work.24 In that experiment, regional functional connectivity was generated from simulated node dynamics on a tractography-derived structural graph. Five functional relationships were retained as imposed constraints. Four of these corresponded to direct structural connections in the original graph, whereas the fifth was indirect meaning that the regions were not connected by a single tractography bundle but required one intermediate node.
In the present analysis, the same functional constraints were imposed on a voxel-wise graph constructed directly from the FiberCup FOD image. Voxels were treated as graph nodes, and neighbouring voxel conductances were derived from bidirectional FOD support across each voxel interface. The resulting current-magnitude maps and pairwise path summaries were inspected to test whether direct relationships followed the expected fibre bundles and whether the previously indirect relationship behaved consistently with the structural possibilities of the voxel-wise FOD network. Failure to produce plausible support patterns would indicate a problem in graph construction, constraint encoding, or path extraction.
3.2. HCP data and voxel-wise graph construction
Voxel-wise FSC was evaluated in three Human Connectome Project (HCP) subjects: 130013, 106824, and 419239.42–44 For each subject, resting-state fMRI data were used to calculate functional connectivity (FC) matrices and dMRI data were used to estimate voxel-wise fibre orientation distributions. The acquisition and preprocessing followed the HCP pipelines described in the original analysis.24
Qualitative tractography comparison was done with MRtrix3 using multi-shell, multi-tissue constrained spherical deconvolution, the unsupervised response-function approach, and probabilistic second-order integration over FODs (iFOD2).45,46 Anatomically constrained tractography was used for the human HCP data.47 One million streamlines were generated with minimum and maximum lengths of 5 and 250 mm and a normalized white-matter FOD cutoff of 0.05. All other iFOD2 tracking parameters were left at the MRtrix3 defaults and no tractogram filtering or weighting36,48 was applied. Structural connectivity was summarized by counting streamlines connecting each pair of cortical regions. The tractogram was retained only as a qualitative representational comparison and not as a current-best-practice quantitative benchmark.
For voxel-wise FSC, each FOD image was converted into a voxel-wise structural graph using the conductance definition described in the Theory section. Graph nodes were FOD-supported voxels, and graph edges represented neighbouring voxel interfaces weighted by bidirectional FOD support. Cortical parcels were represented as ROI supernodes connected to adjacent graph boundary voxels, allowing regional FC constraints to enter the voxel-wise structural graph through multiple parcel-graph interfaces rather than through a single regional edge. This ROI-to-voxel graph interface is illustrated in Figure 2.
For each HCP analysis, observed resting-state FC values were imposed on the subject- and voxel-wise FOD graph using the constrained formulation described in the Theory section. The primary voxel-wise outputs were the solved graph potentials, voxel-edge current fields, and derived voxel-wise support maps.
3.3. Schaefer200 analysis
The main HCP voxel-wise analysis used the 200-region Schaefer cortical parcellation.37 This parcellation was used because it provides a finer functional scale than Desikan-Killiany and includes parcel labels that assign each region to one of the canonical Yeo intrinsic functional networks.49 The Schaefer200 atlas was transformed to each subject’s native HCP diffusion space using the HCP standard-to-native registration warp with nearest-neighbour interpolation, preserving integer labels. The warped atlas was used to define ROI supernodes and their interfaces with the voxel-wise FOD graph.
Schaefer200 functional connectivity matrices were computed from the four HCP resting-state runs corresponding to 1LR, 1RL, 2LR, and 2RL. Regional time series were extracted using the Schaefer200 atlas, Fisher transformed, scaled, and used as functional constraints in the voxel-wise FSC model. Voxel-wise FSC was then solved on the subject-wise FOD-derived graph using the graph construction and ROI-interface rules described above.
3.4. Network visualization
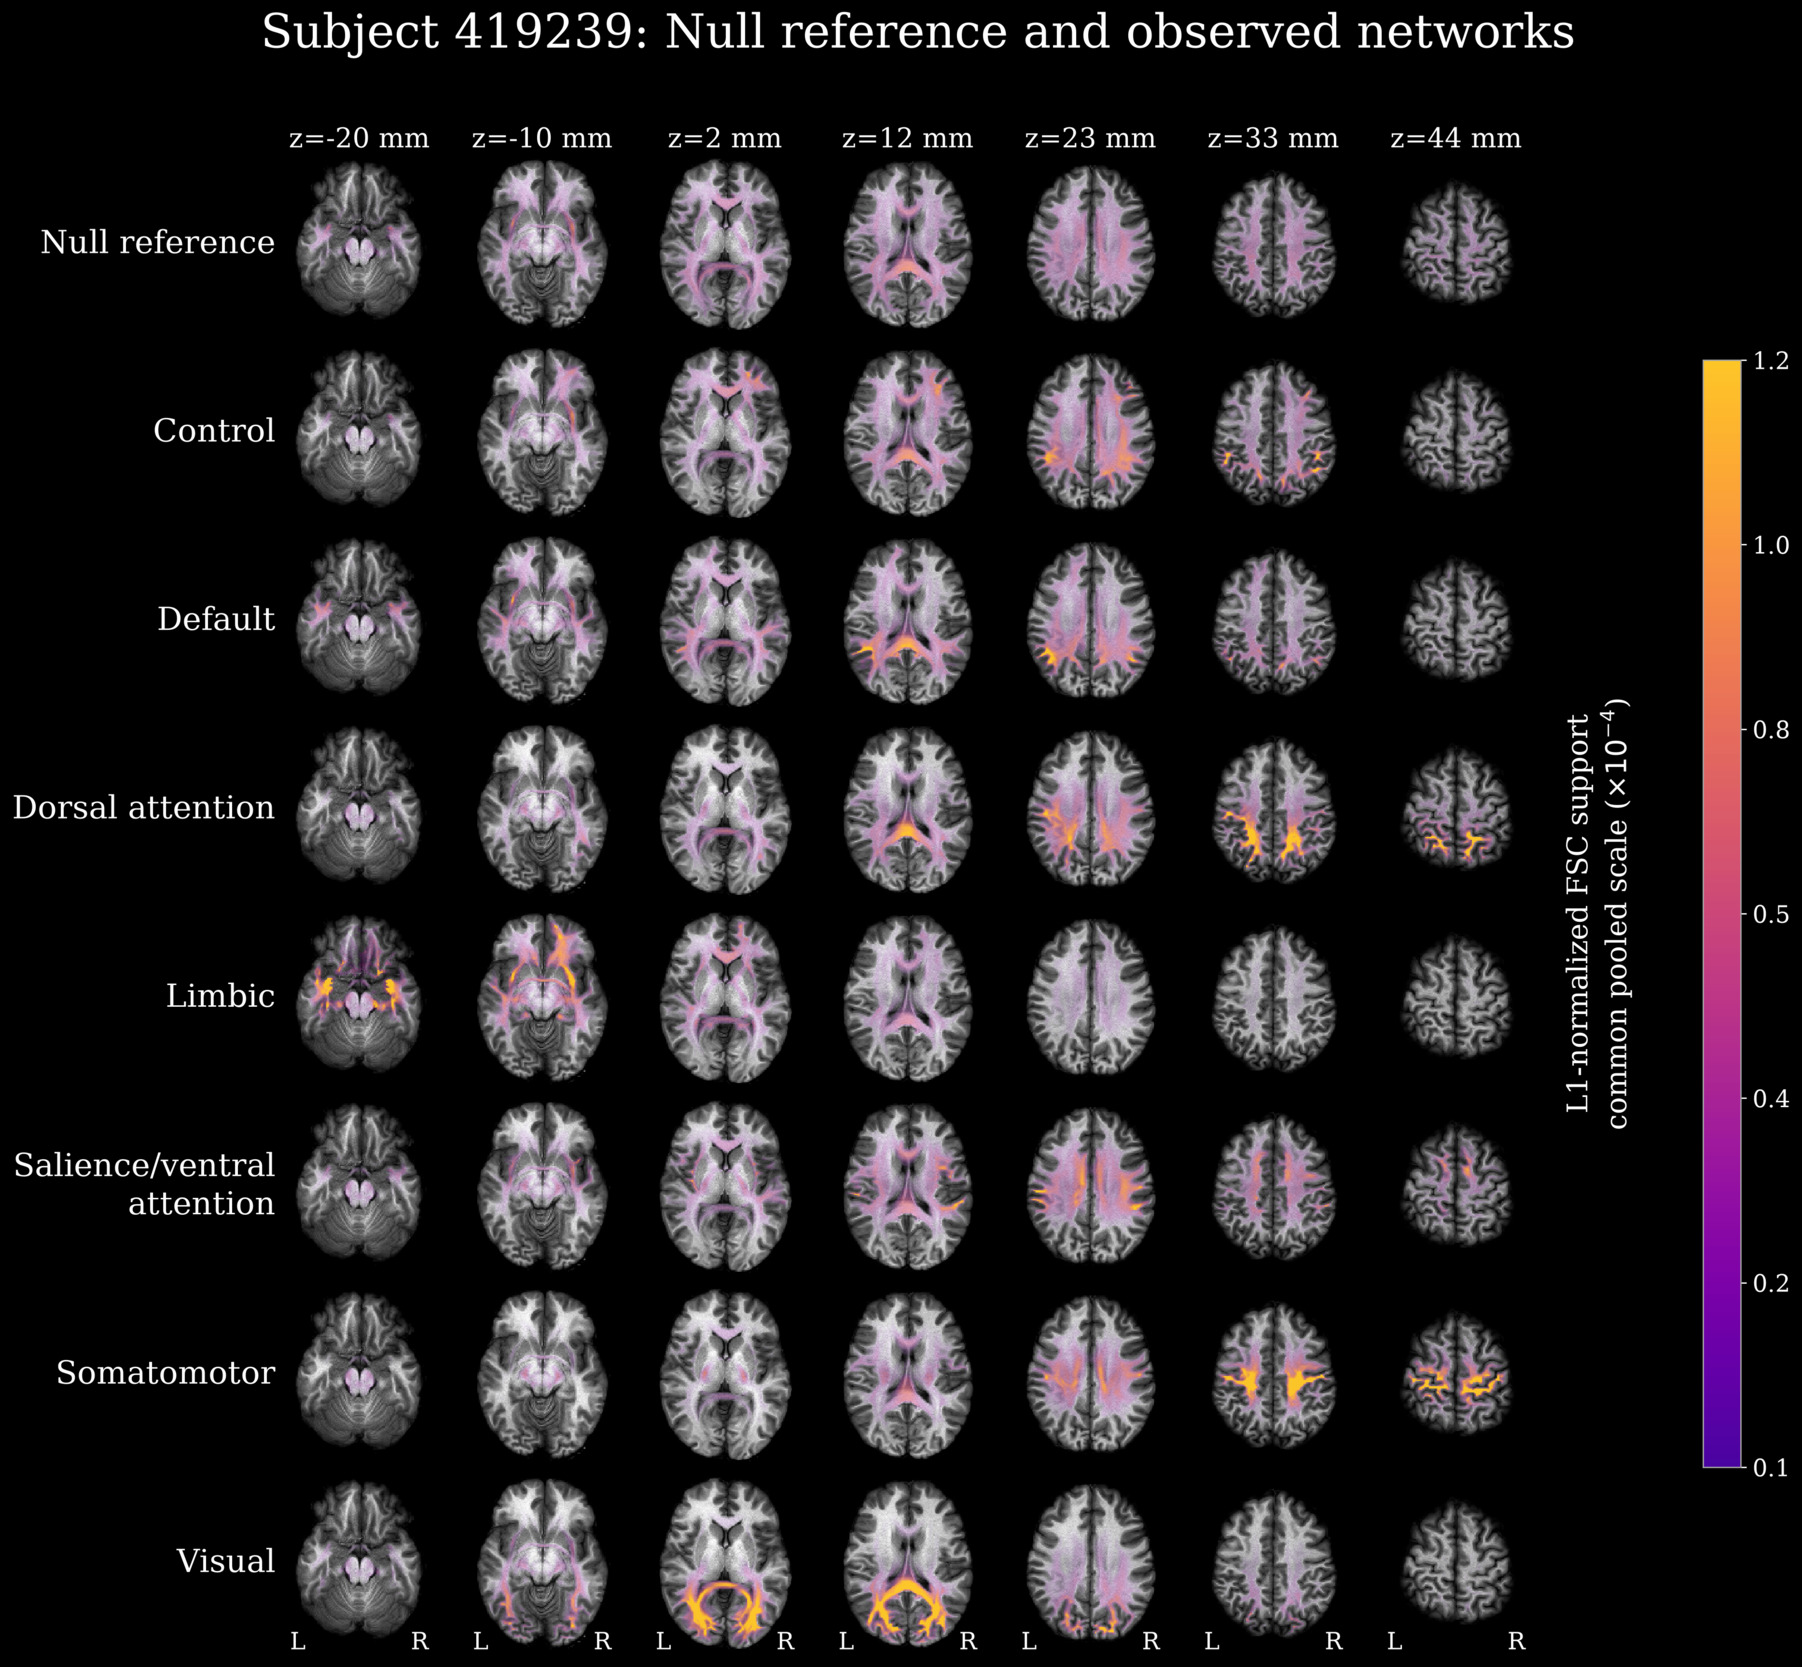
Using the Schaefer200 parcellation and Yeo’s network assignments, network-level voxel-wise support maps were generated separately for the three subjects. Within each network, the 50 strongest finite positive Fisher-z FC values were selected. Pair selection was based solely on FC magnitude and was not constrained or balanced by hemisphere. The hemispheric distribution of the selected connections was therefore determined by the observed FC values rather than imposed by the analysis. The fixed count gave every network the same number of pairwise contributions and it was a design choice for aggregation rather than a biological or statistical threshold. Each selected value was imposed on the subject-specific FOD graph, the resulting pairwise current magnitudes were accumulated within network, and voxel support was calculated as defined in the Theory section.
For the visualization, each complete three-dimensional network support map was L1-normalized by its total positive support to preserve comparisons of the relative spatial allocation of support while avoiding the full saturation produced by independently scaling every network.
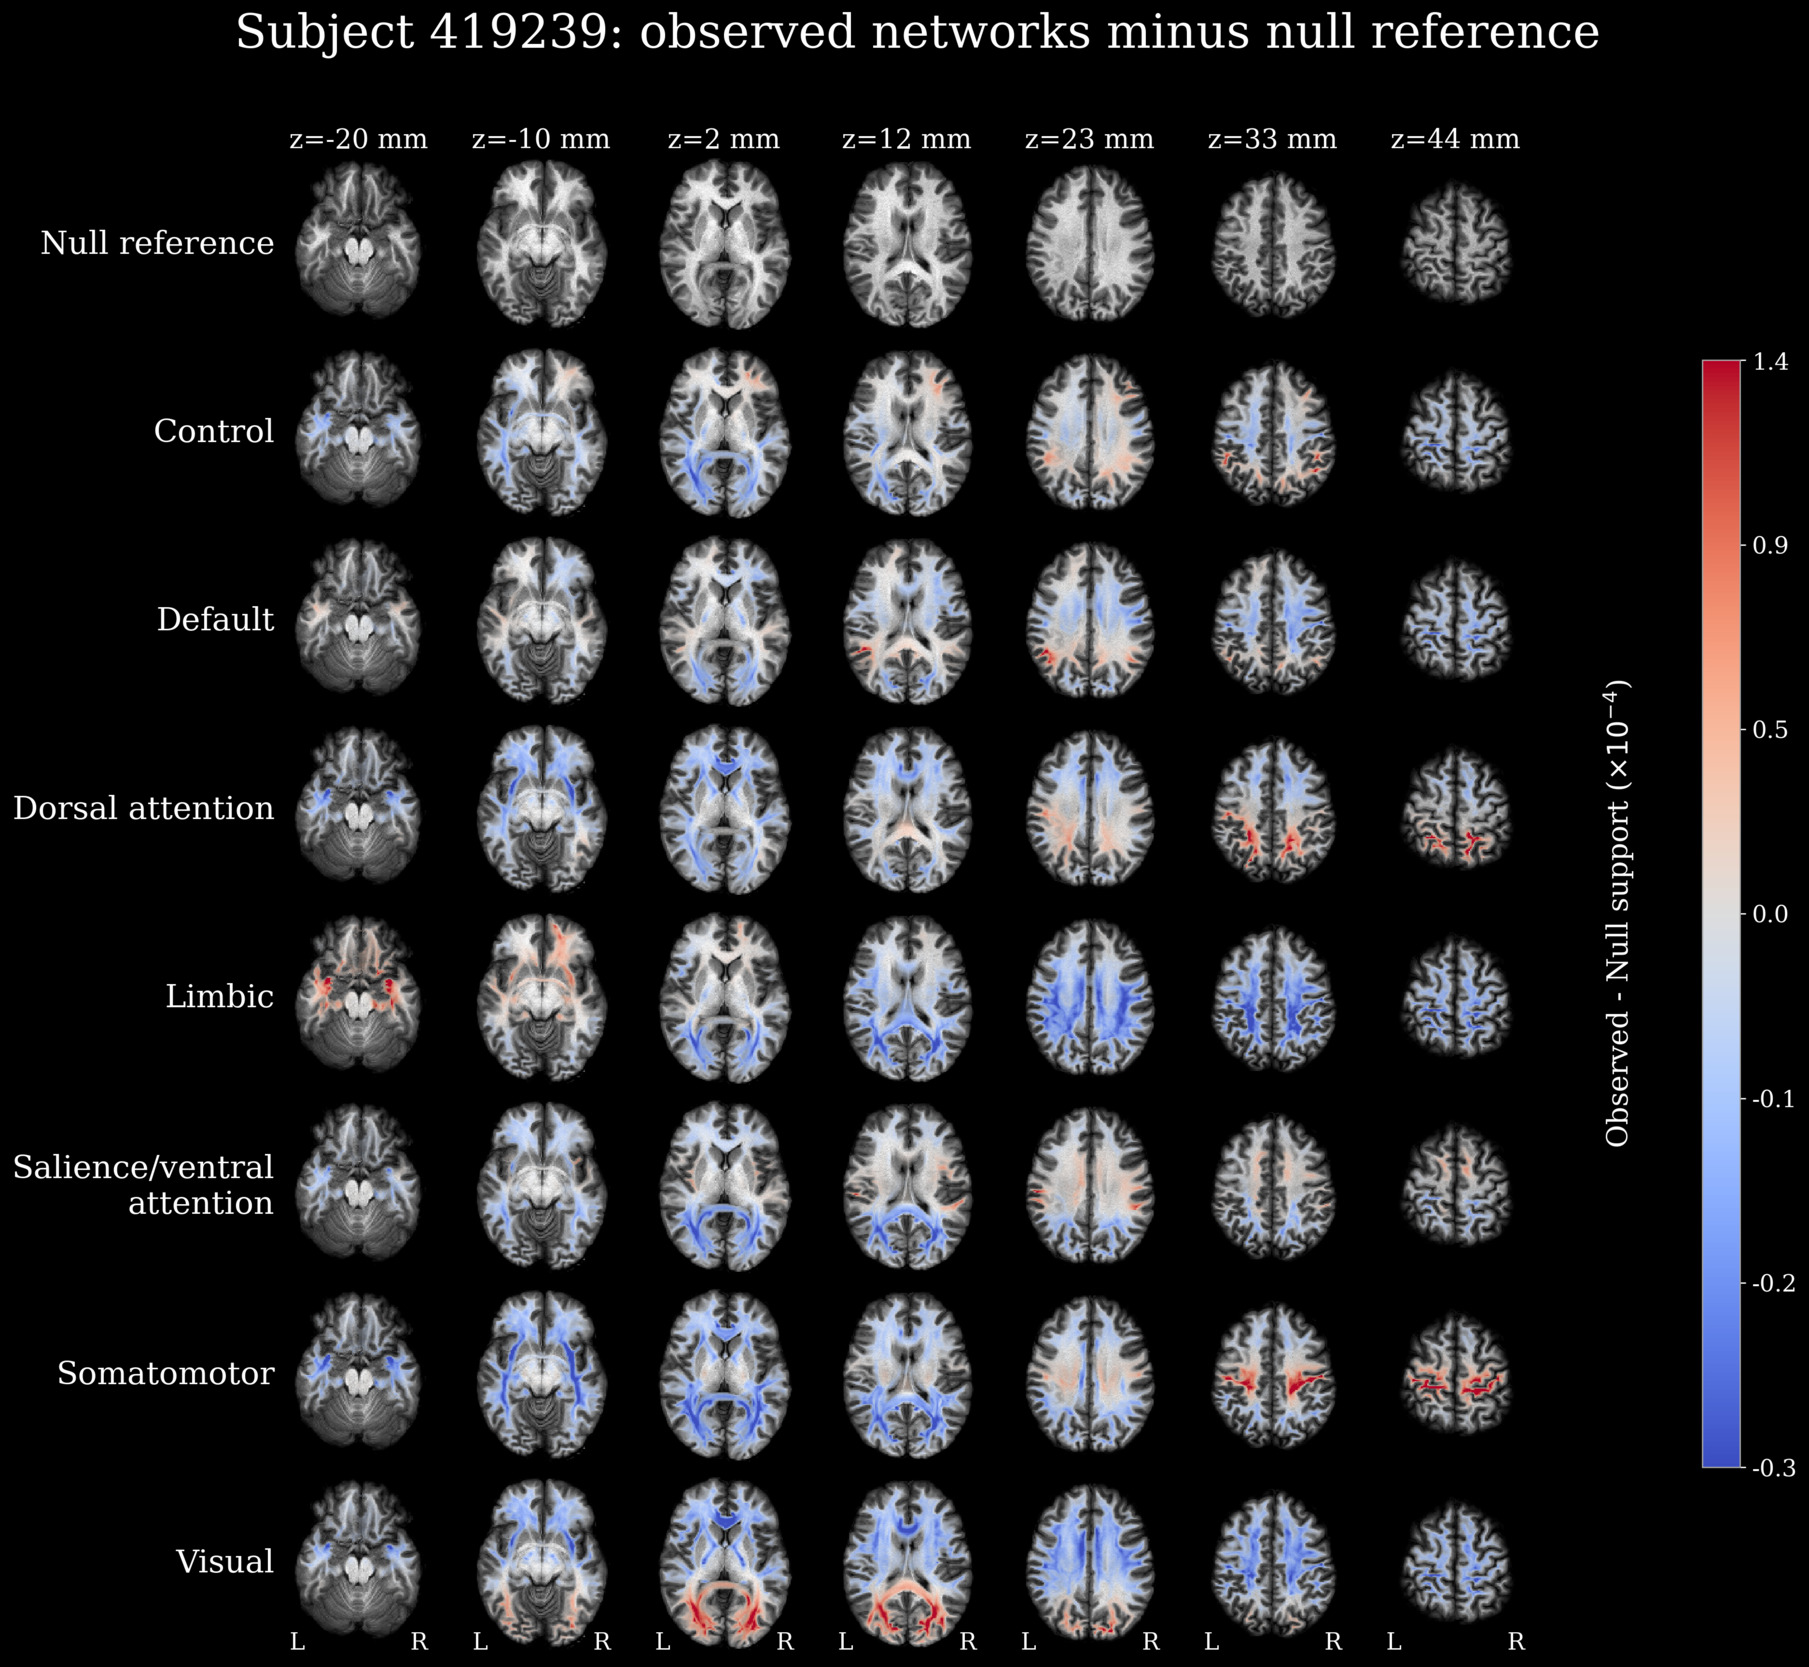
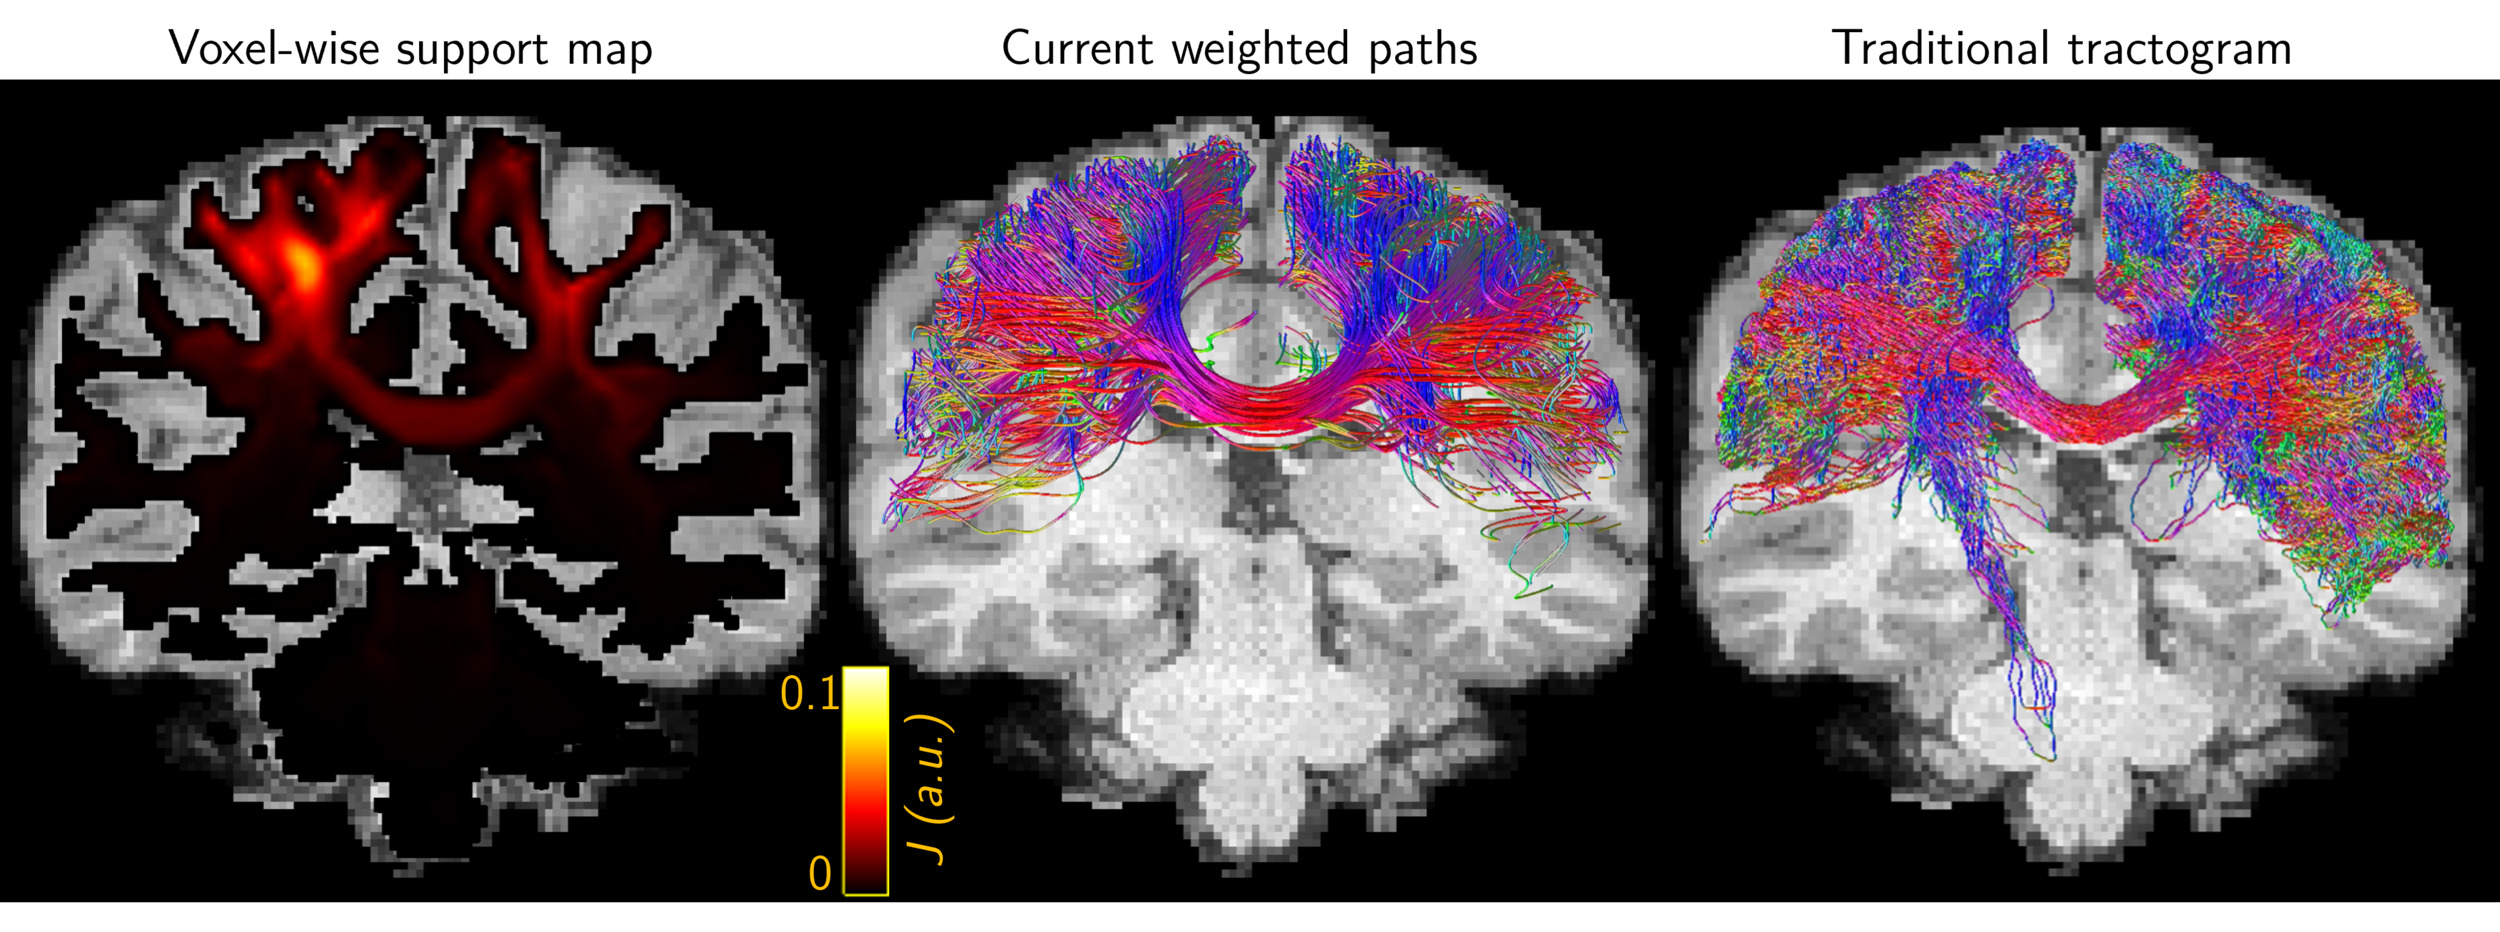
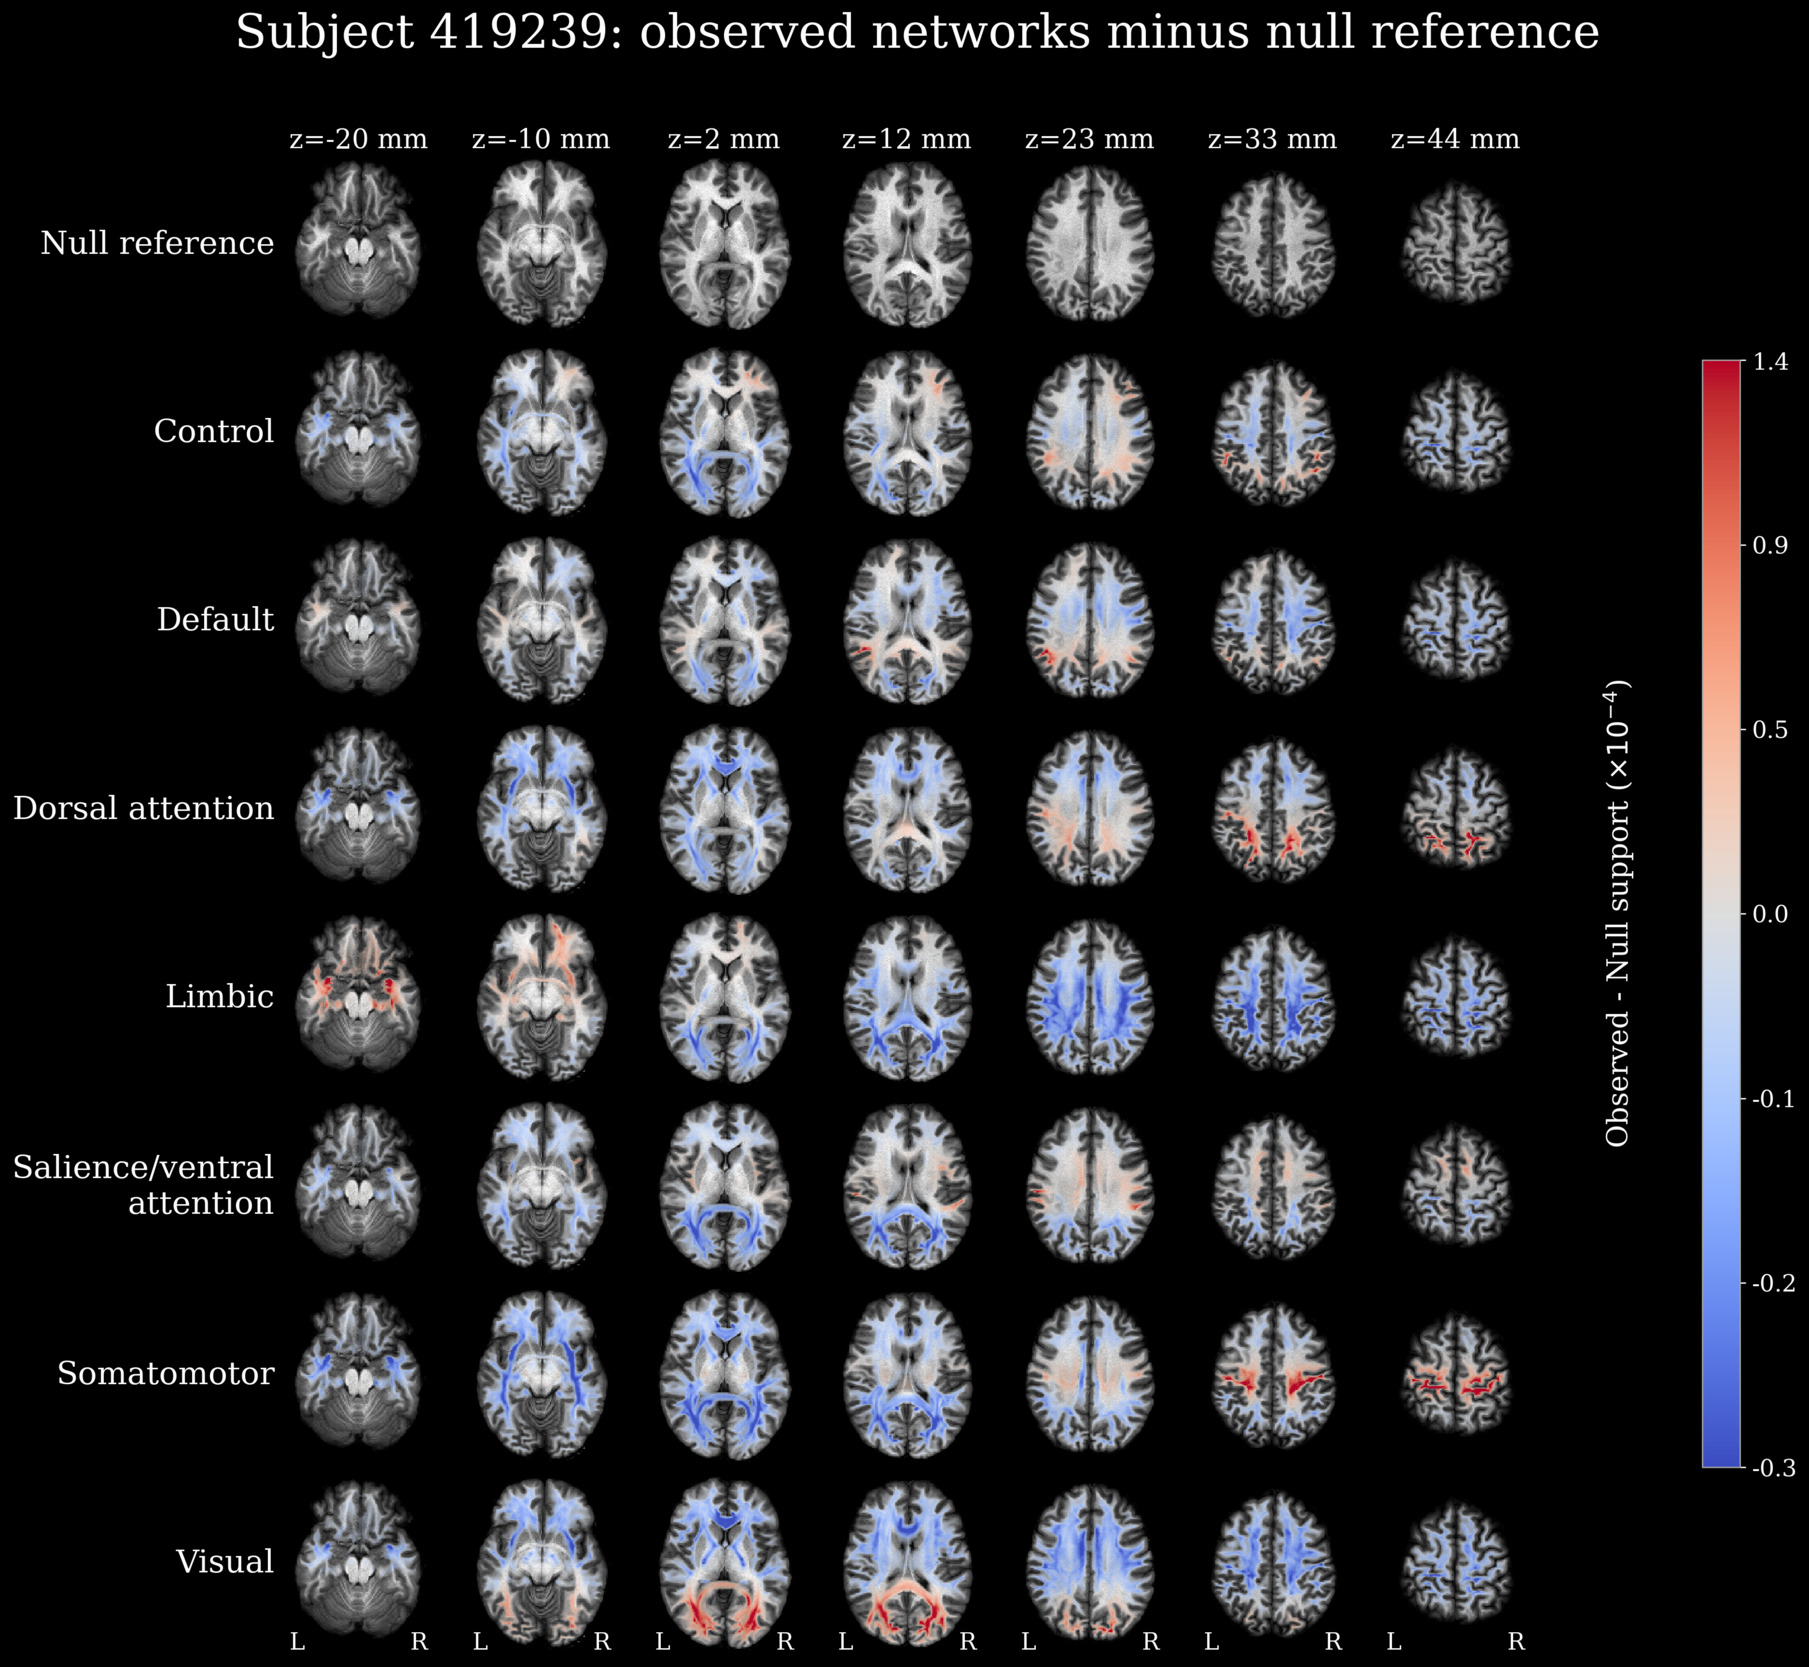
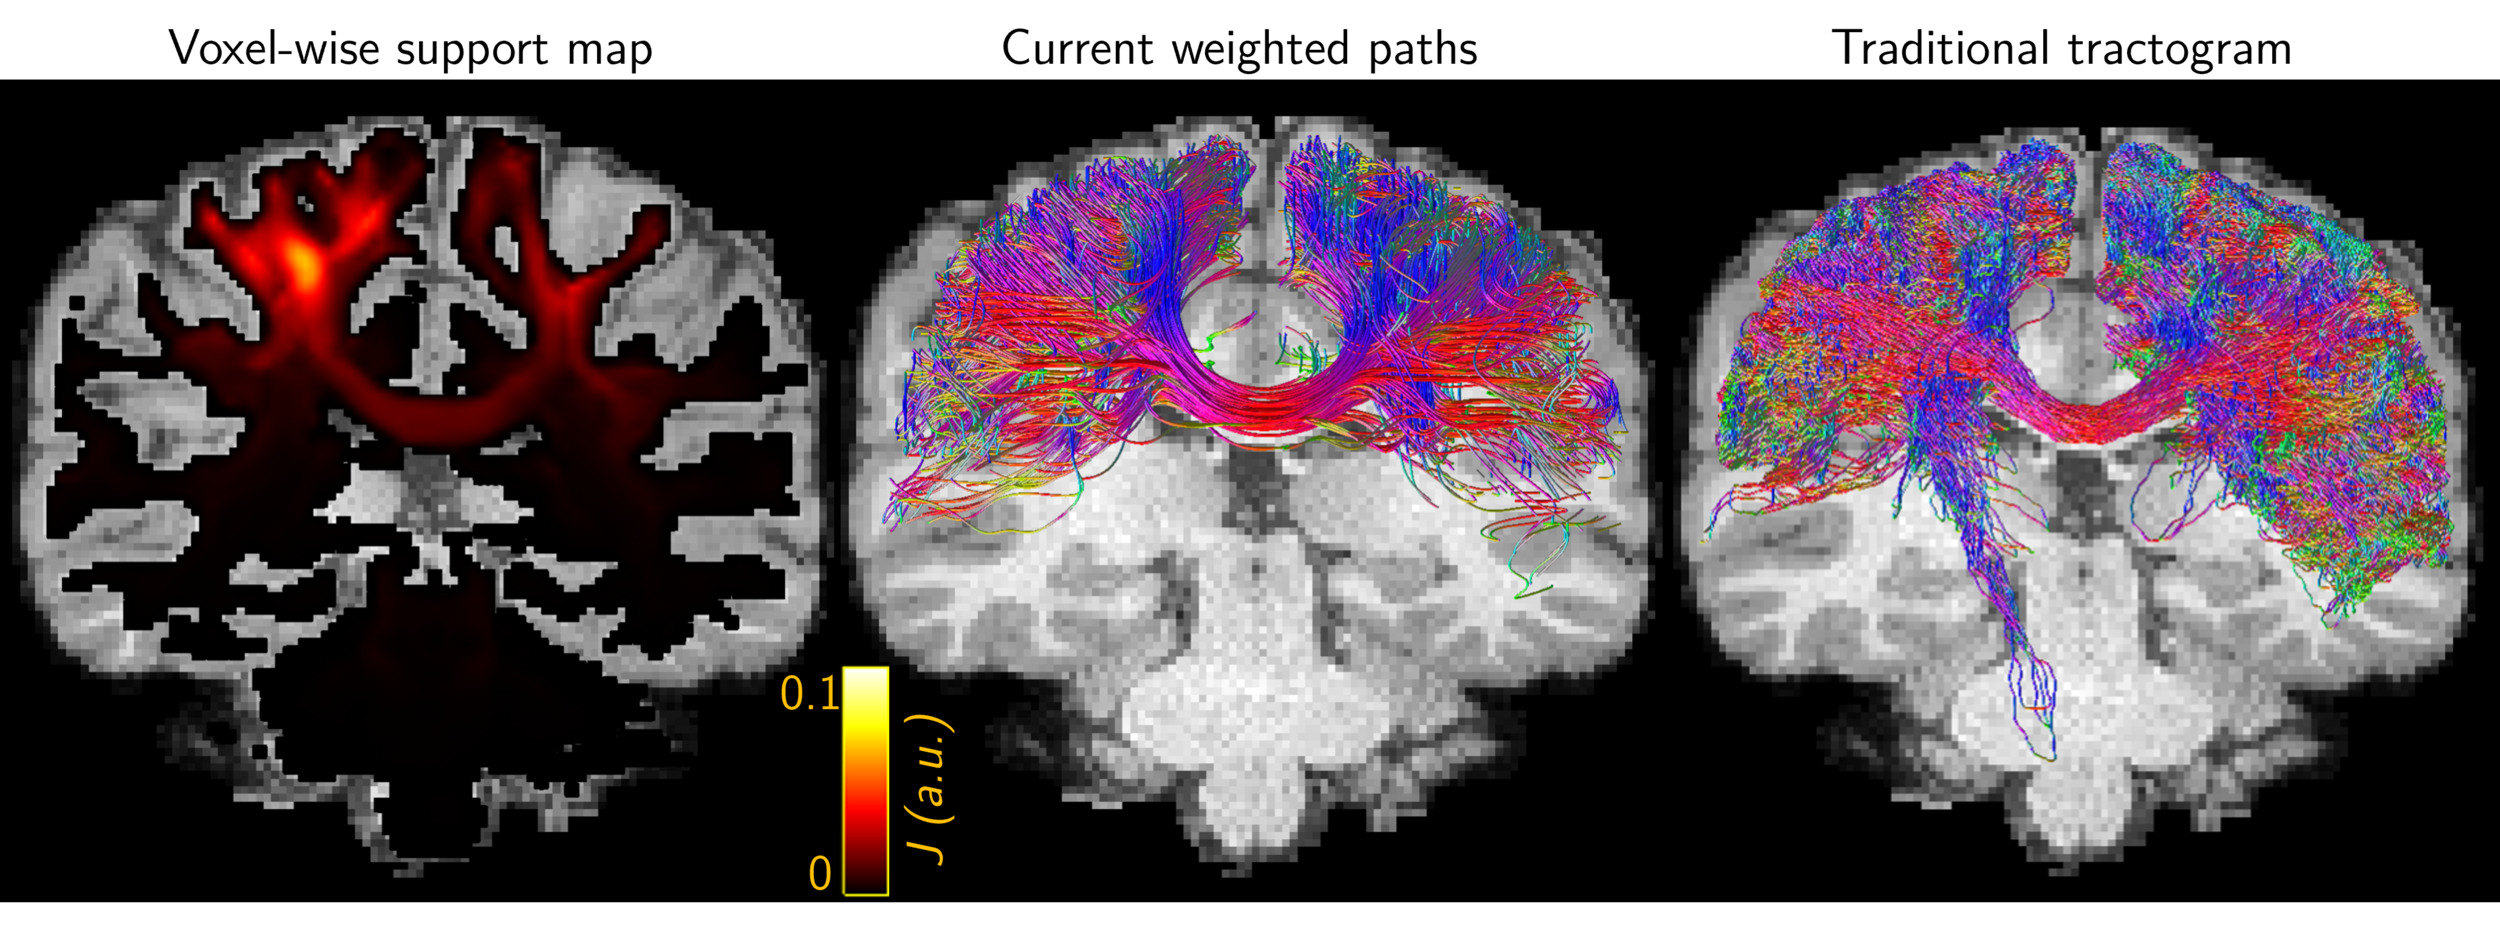
The expected unrestricted null backbone was calculated from the mean unit-pair support over all 19900 unordered Schaefer200 parcel pairs and was L1-normalized in the same manner as the observed maps. Residual maps were obtained by subtracting this null reference from each L1-normalized observed network map. Positive and negative residuals therefore balance over the complete volume. The somatomotor network was additionally visualized as a voxel-wise FSC support map, a current-guided path-like summary of the same solved edge-current field, and a conventional tractogram selected using the same network masks. The path-like display was included only to illustrate a possible secondary representation of the solved field not to compare FSC derived pathways to current state-of-the-art tractography methods.
3.5. FC label permutation test
An unrestricted pair-label reassignment analysis was performed independently for each subject to determine how strongly the spatial placement of the functional constraints influenced the voxel-wise support maps. The selected 350 weights (50 from each network) retained their magnitudes and network grouping, while their anatomical endpoints were randomly permuted. In each permutation, 350 destination labels were sampled uniformly without replacement from all unordered Schaefer200 parcel pairs. Destination pairs could connect parcels anywhere in the brain. No network or anatomical stratification was imposed, and destination pairs were not matched to the observed pairs by distance or hemispheric class.
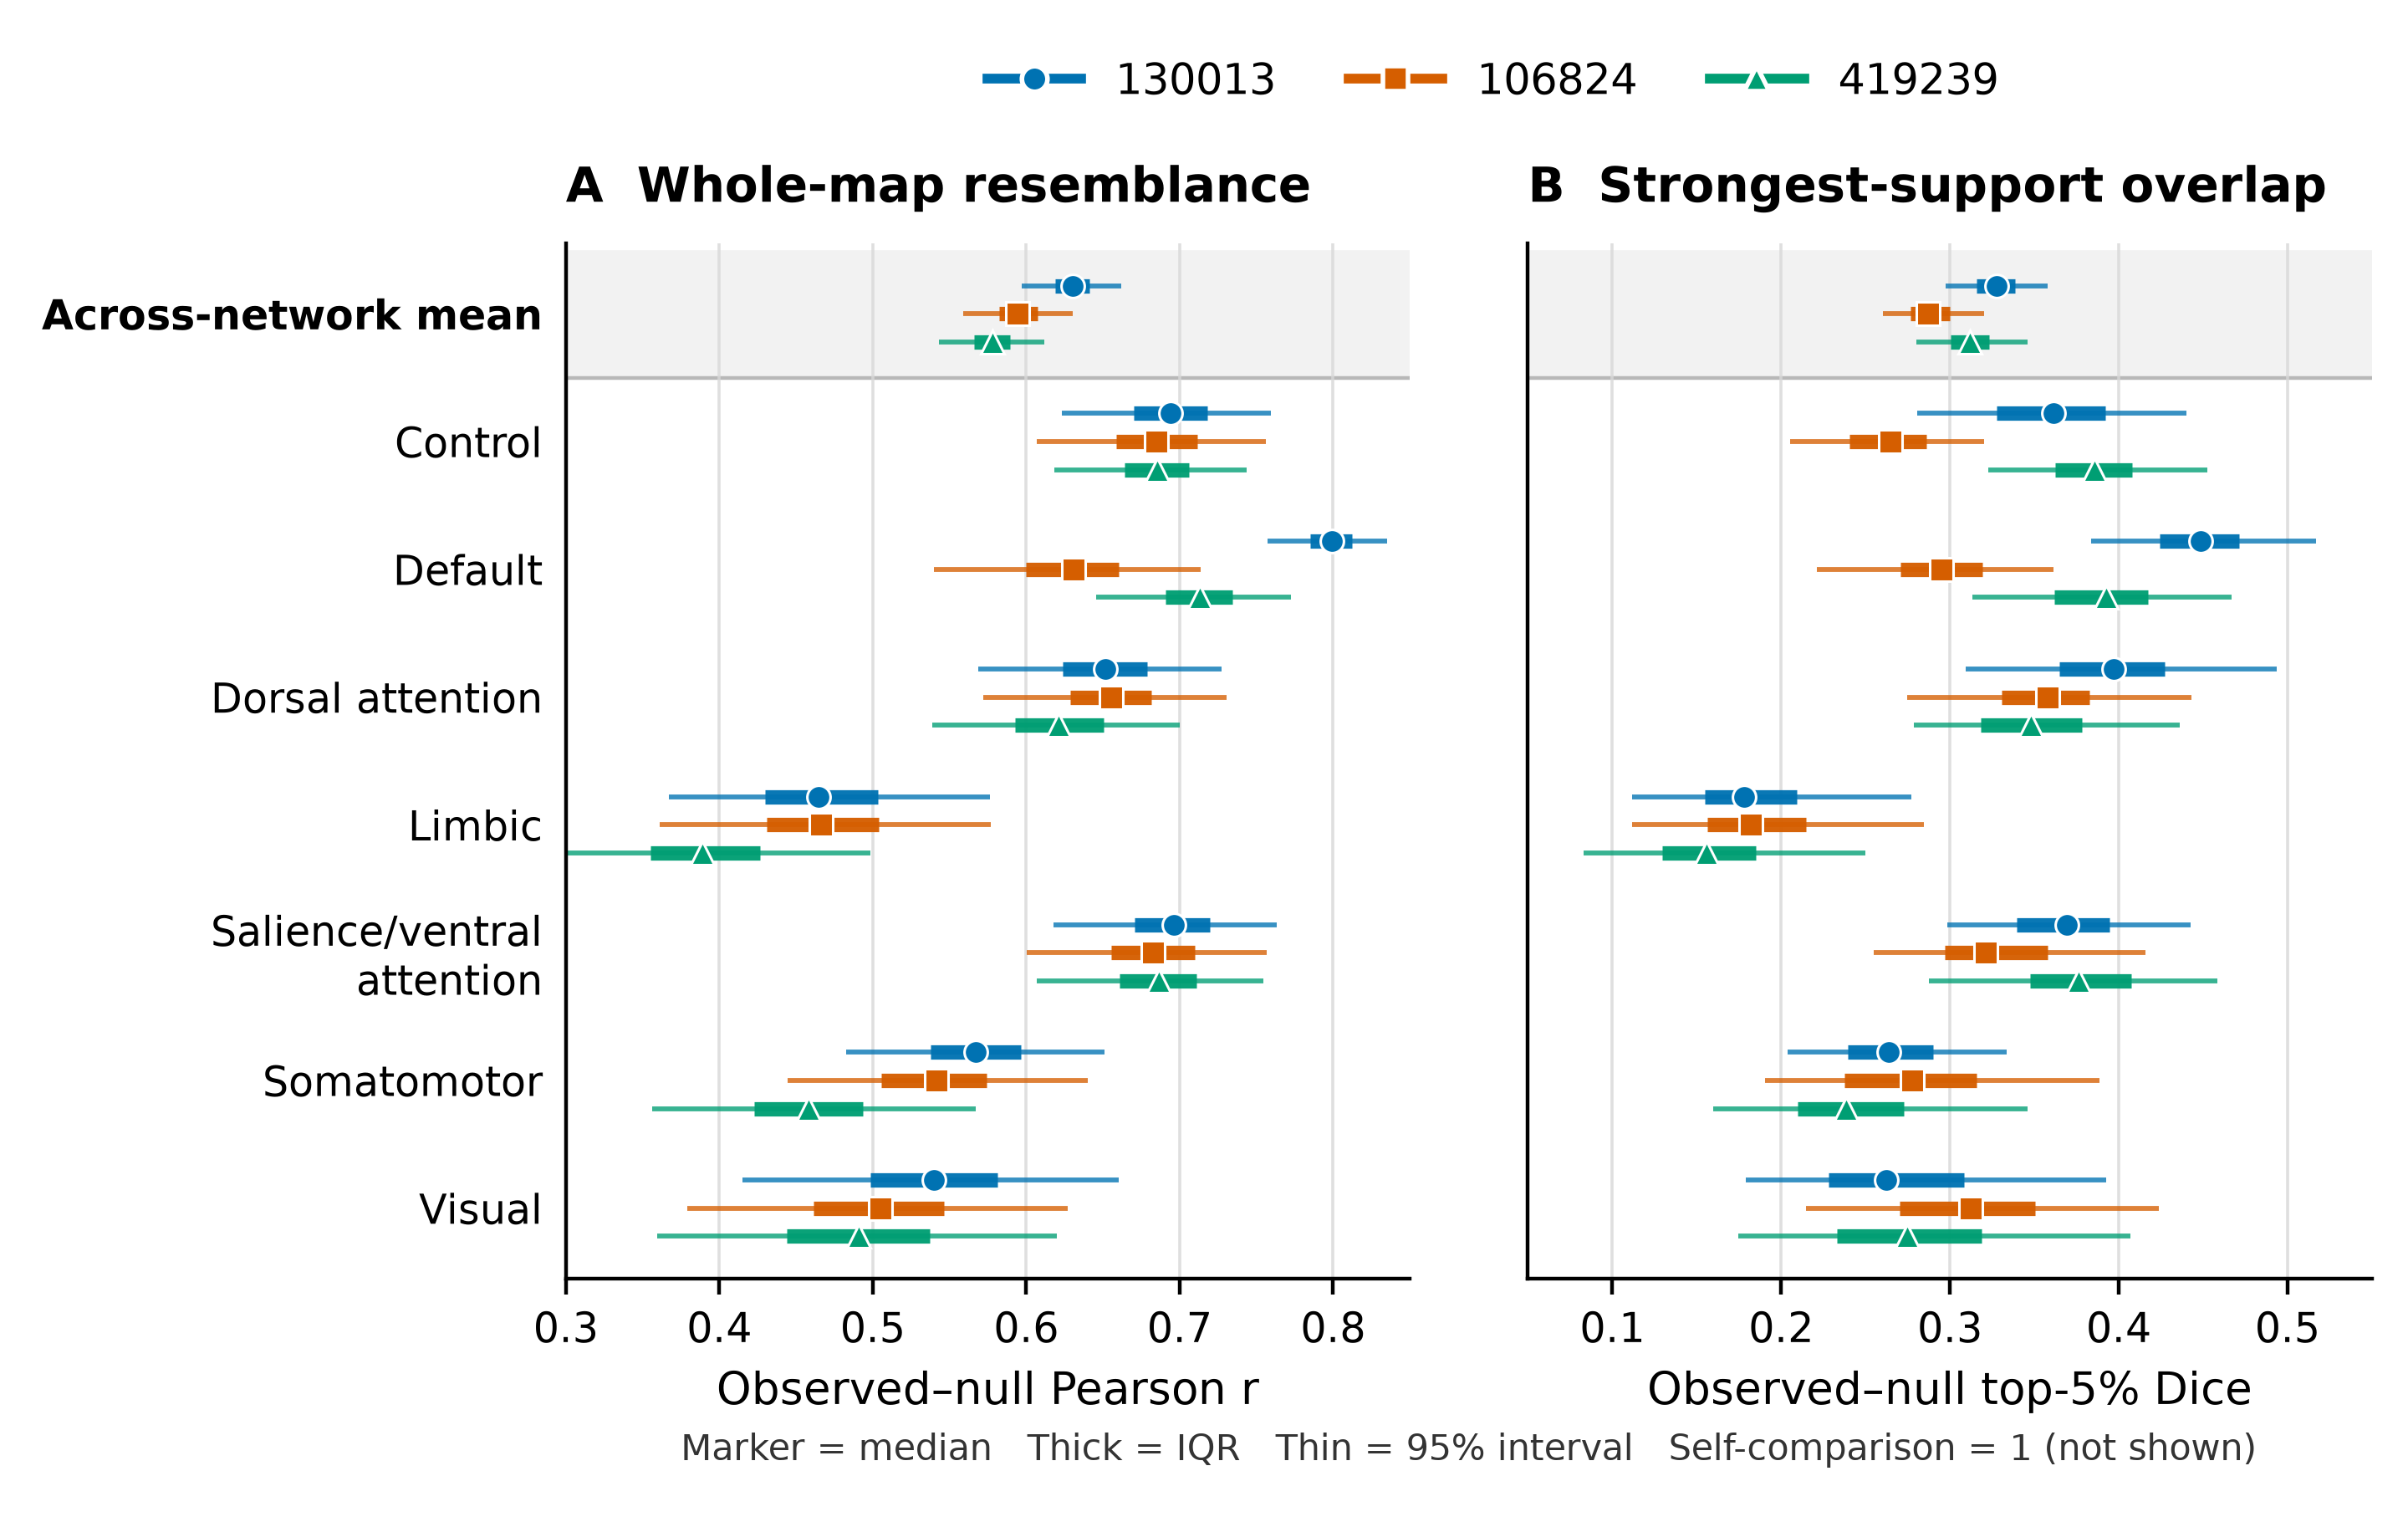
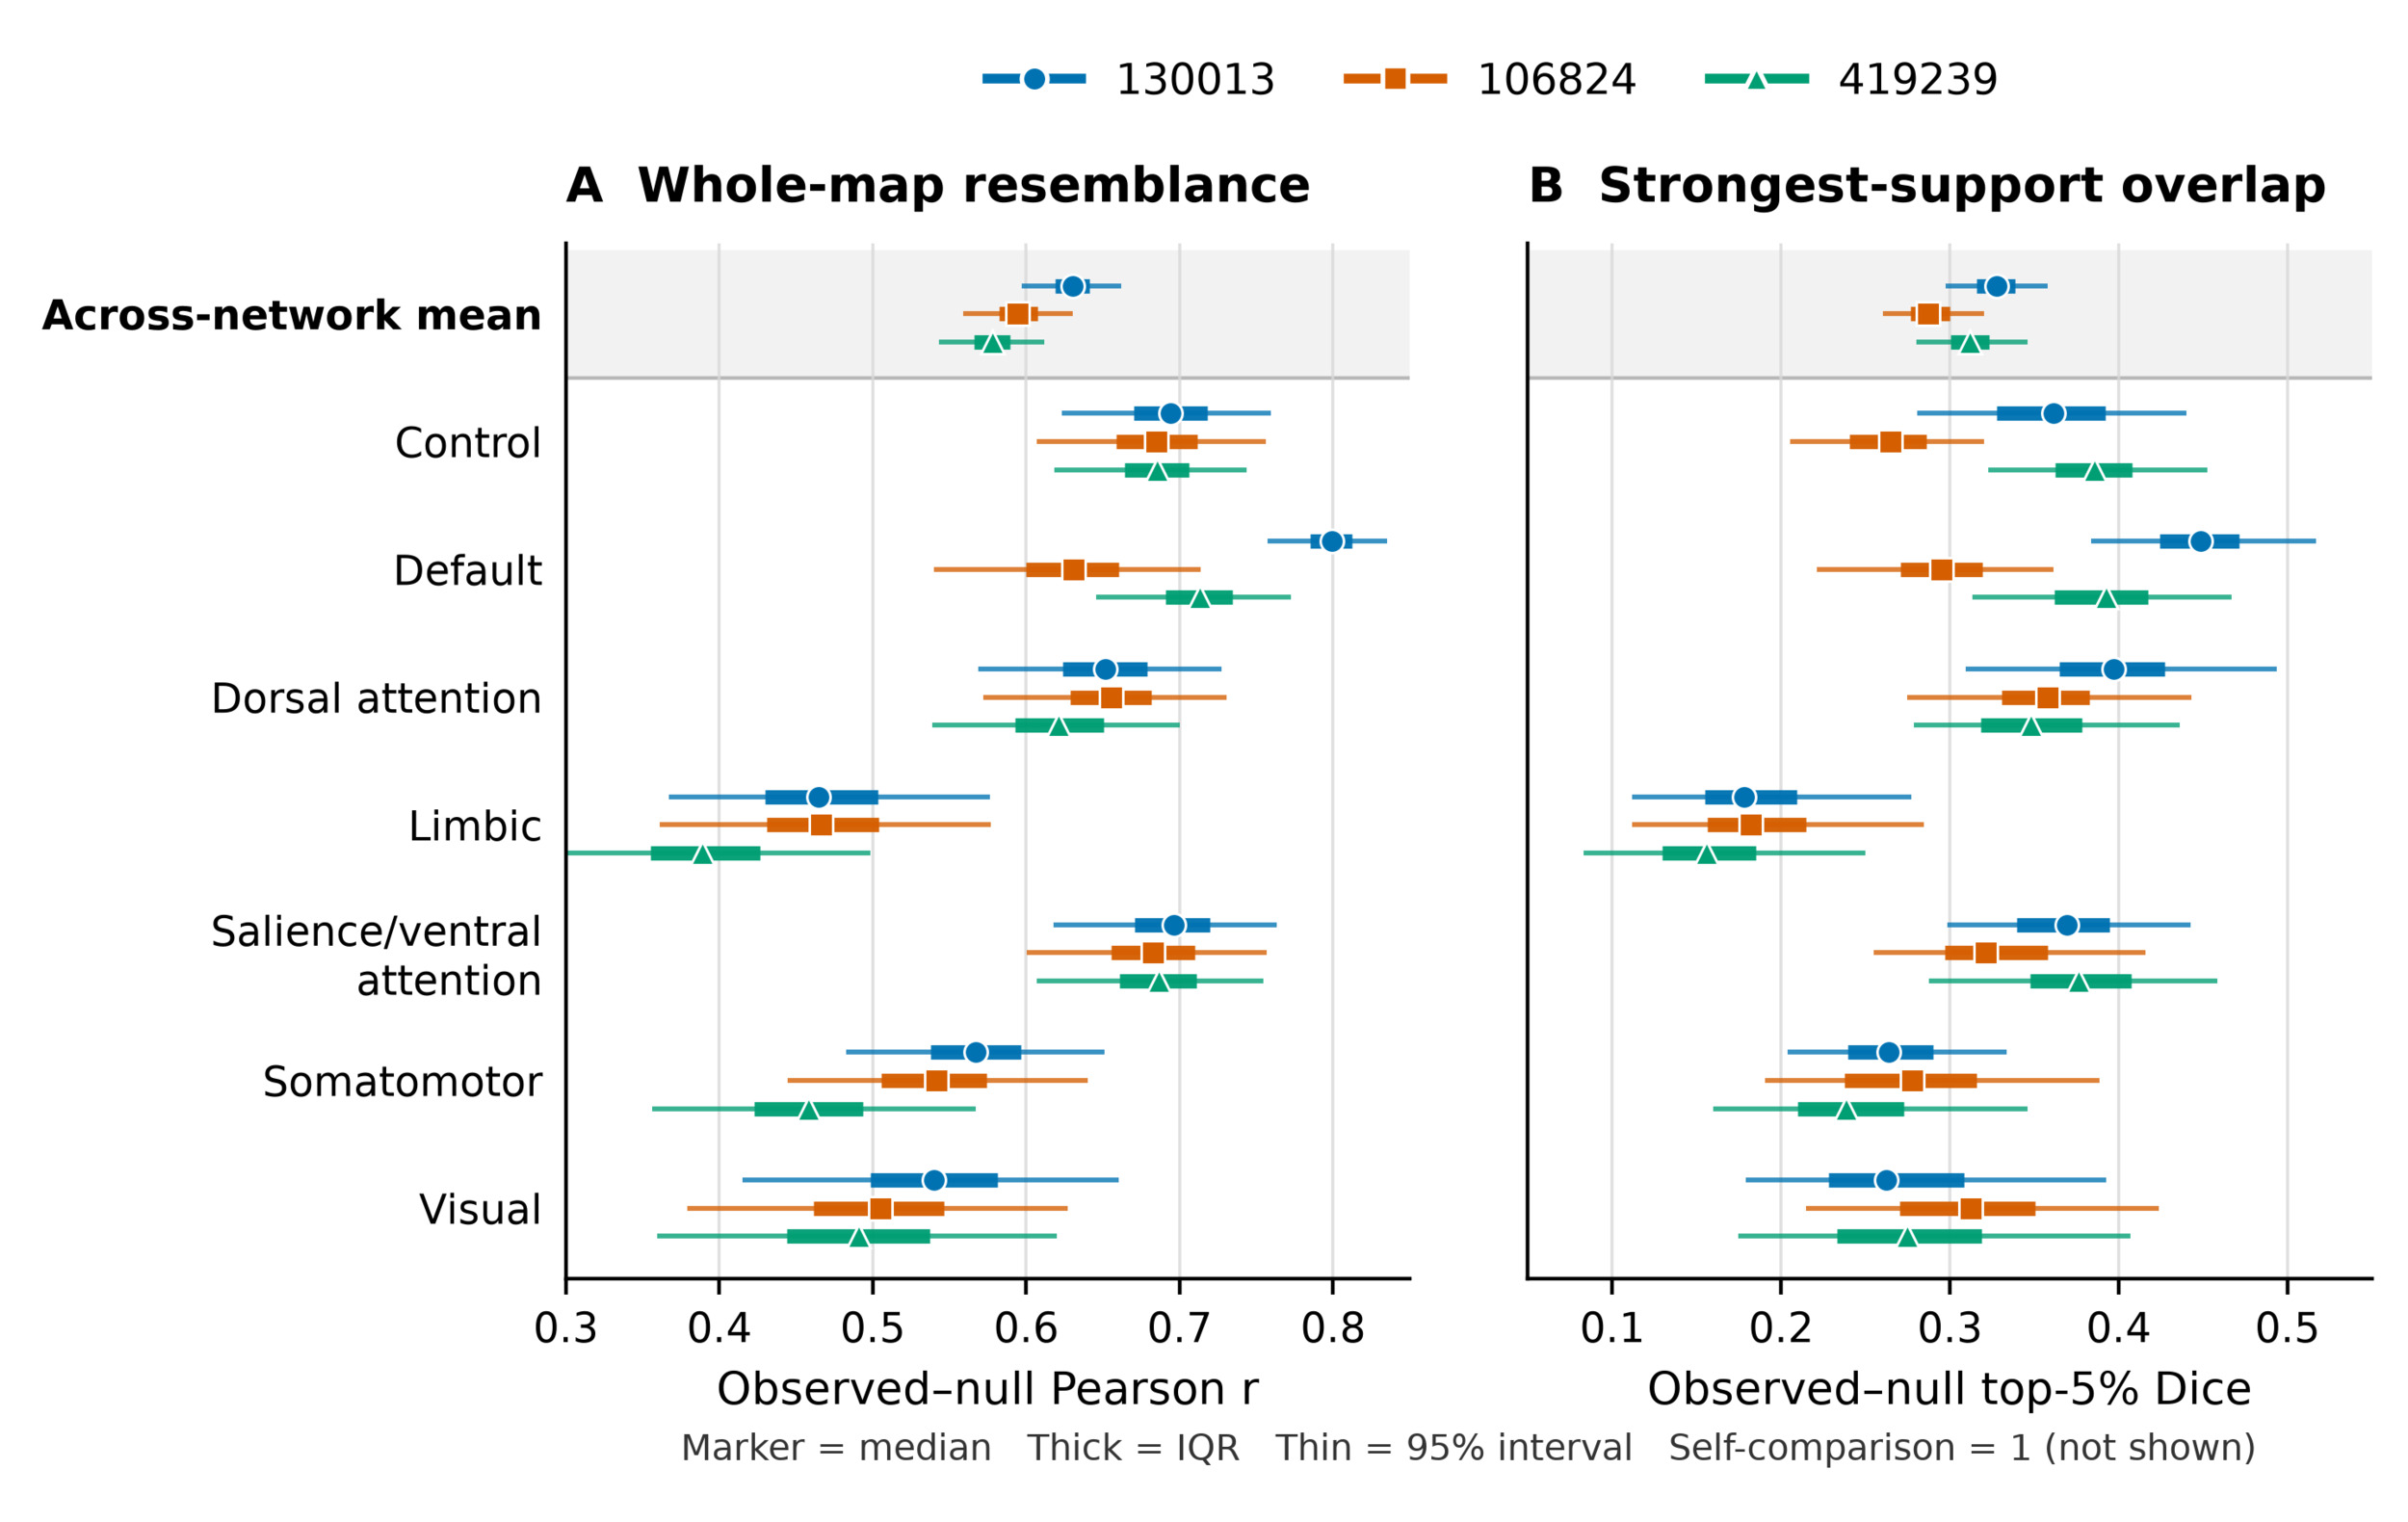
Whole-map resemblance was quantified for each network using the Pearson correlation between observed and permuted support values across graph nodes. Spatial correspondence of the strongest support was evaluated by selecting the highest-valued 5% of graph nodes in the observed and permuted maps and calculating their Dice overlap. Dice was calculated for the first 500 permutations. Distributions were summarized by the median, interquartile range, and 2.5th-97.5th percentiles. The across-network summary was the mean of the seven network-wise values within each permutation.
These reassignment distributions were treated as descriptive, subject-conditional sensitivity analyses rather than population-level hypothesis tests. Observed-map self-comparison equals one by definition and was therefore not treated as an independently estimated observed statistic, a rejection threshold, or a conventional permutation-test value. The reported percentile intervals describe variation across seeded reassignments conditional on each subject’s fixed structural graph and selected FC weights and not confidence intervals across subjects.
3.6. Desikan-Killiany comparison with original FSC
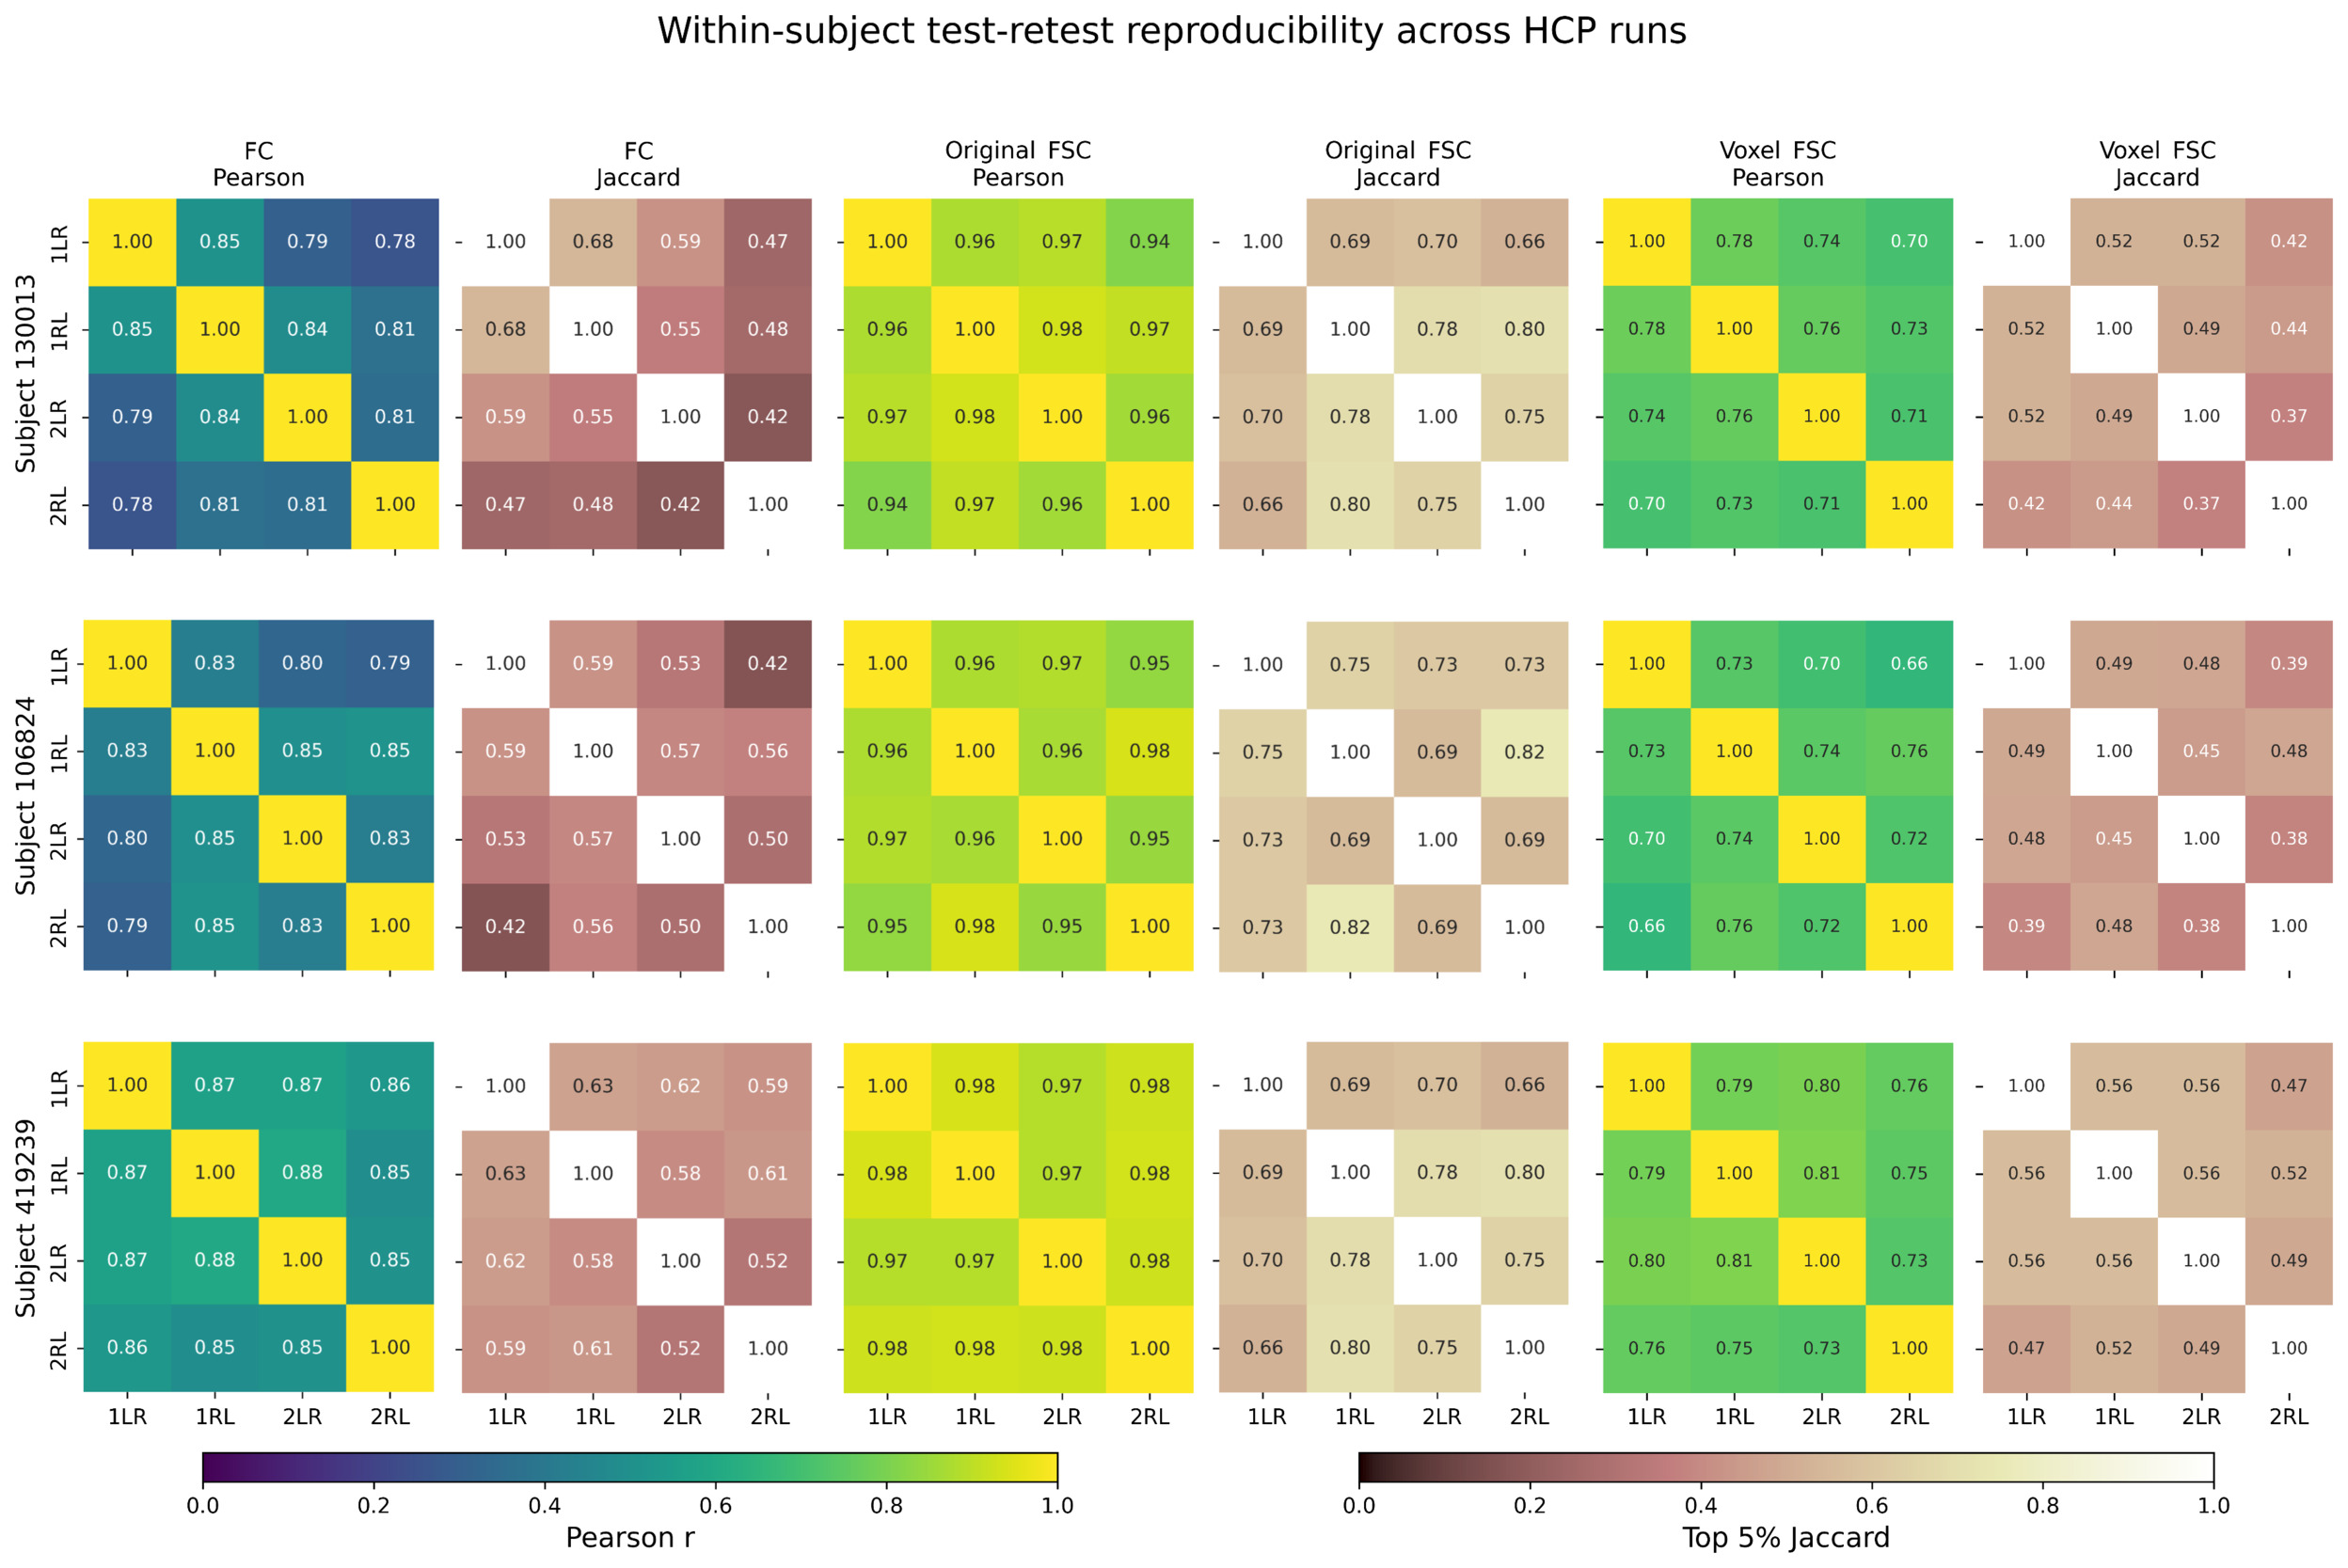
To compare voxel-wise FSC directly with the previous region-level FSC framework,24 the HCP analysis was repeated with the Desikan-Killiany parcellation restricted to 68 cortical regions.38 This parcellation was used because it matched the original FSC study, allowing the voxel-wise formulation to be evaluated using the same regional definition and resting-state test-retest setting as the previous constrained-Laplacian analysis.
For each subject and resting-state run, Desikan-Killiany FC matrices were used as functional constraints on the subject- and voxel-wise FOD graph. In the original FSC framework, the constrained-Laplacian problem was solved on a regional tractography-derived structural connectome. Here, the same regional FC constraints were imposed on a voxel-wise FOD-derived conductance graph instead. This analysis therefore tested whether voxel-wise FSC preserved the behaviour of the original FSC framework when the regional parcellation was held fixed, while replacing the structural network with a voxel-wise diffusion-derived graph.
3.7. Combined test-retest analysis
Within-subject test-retest reproducibility was evaluated using both the Schaefer200 and Desikan-Killiany analyses across the four HCP resting-state runs: 1LR, 1RL, 2LR, and 2RL. Comparisons were restricted to matched phase-encoding directions: 1LR versus 2LR and 1RL versus 2RL in each of the three subjects, giving six comparisons per parcellation and method. Voxel-wise FSC was reduced to the corresponding parcellation scale by extracting one scalar response value for each imposed FC pair, producing a matching ROI-pair response vector. This reduction was used only for reproducibility analysis. The primary outputs remained the solved graph potentials, voxel-edge current fields, and support maps.
Reproducibility was quantified using Pearson correlation between complete ROI-pair vectors and the Jaccard index between the strongest 5% of ROI-pair values. In the Schaefer200 analysis, FC and voxel-wise FSC were evaluated at the finer parcellation scale. In the Desikan-Killiany analysis, FC, original region-level FSC, and voxel-wise FSC were evaluated in the same 68-region space, allowing direct comparison with the original FSC framework.24 Results were summarized descriptively by the median and interquartile range across the six matched comparisons.
To examine whether the difference between Desikan-Killiany and Schaefer200 could reflect atlas construction rather than parcel number alone, the same test-retest analysis was repeated with the Schaefer 7-network atlas at 100, 200, 400, 600, 800, and 1,000 parcels. All three subjects and four resting-state runs were analysed, using the same matched-direction comparisons, full-vector Pearson correlation, and top-5% Jaccard overlap.
4. Results
4.1. In-silico FiberCup sanity check
The in-silico FiberCup experiment showed that the voxel-wise FOD graph produced spatially plausible support patterns for the imposed functional relationships (Figure 3). The four relationships that were direct in the original tractography-derived FiberCup graph produced support along the expected fibre structures. The spatially isolated fourth relationship provided a specificity check: its support remained confined to the corresponding isolated bundle, indicating that the voxel-wise solution did not spread through unrelated parts of the phantom.
The fifth relationship illustrates an important difference between the previous region-level simulation and the present voxel-wise formulation. In the original FSC FiberCup experiment, this relationship was treated as indirect because the corresponding regions were not connected by a single edge in the tractography-derived regional structural graph.24 In the voxel-wise FOD graph, however, the same relationship was supported through a shorter route enabled by the local crossing-FOD architecture visible in the phantom. This was not interpreted as a failure of the voxel-wise method. Instead, it shows that the structural possibilities available to voxel-wise FSC are defined by local FOD-supported voxel interfaces, not by the direct edges of the earlier region-level tractography graph.
This result highlights a limitation of using a region-level FiberCup graph as the reference for a voxel-wise FOD-graph method. A connection that is indirect in a region-level tractography graph may be locally feasible in the underlying FOD field. However, such a shortcut can have two different interpretations: it may reflect a genuine local crossing configuration that provides structural support at the voxel scale, or it may arise because the spatial or angular resolution of the phantom data is insufficient to separate nearby fibre structures. The latter is likely relevant in the FiberCup example, where the voxel-wise graph can exploit local FOD support that is not represented as a direct connection in the labelled region-level graph.
4.2. Local graph construction followed FOD geometry
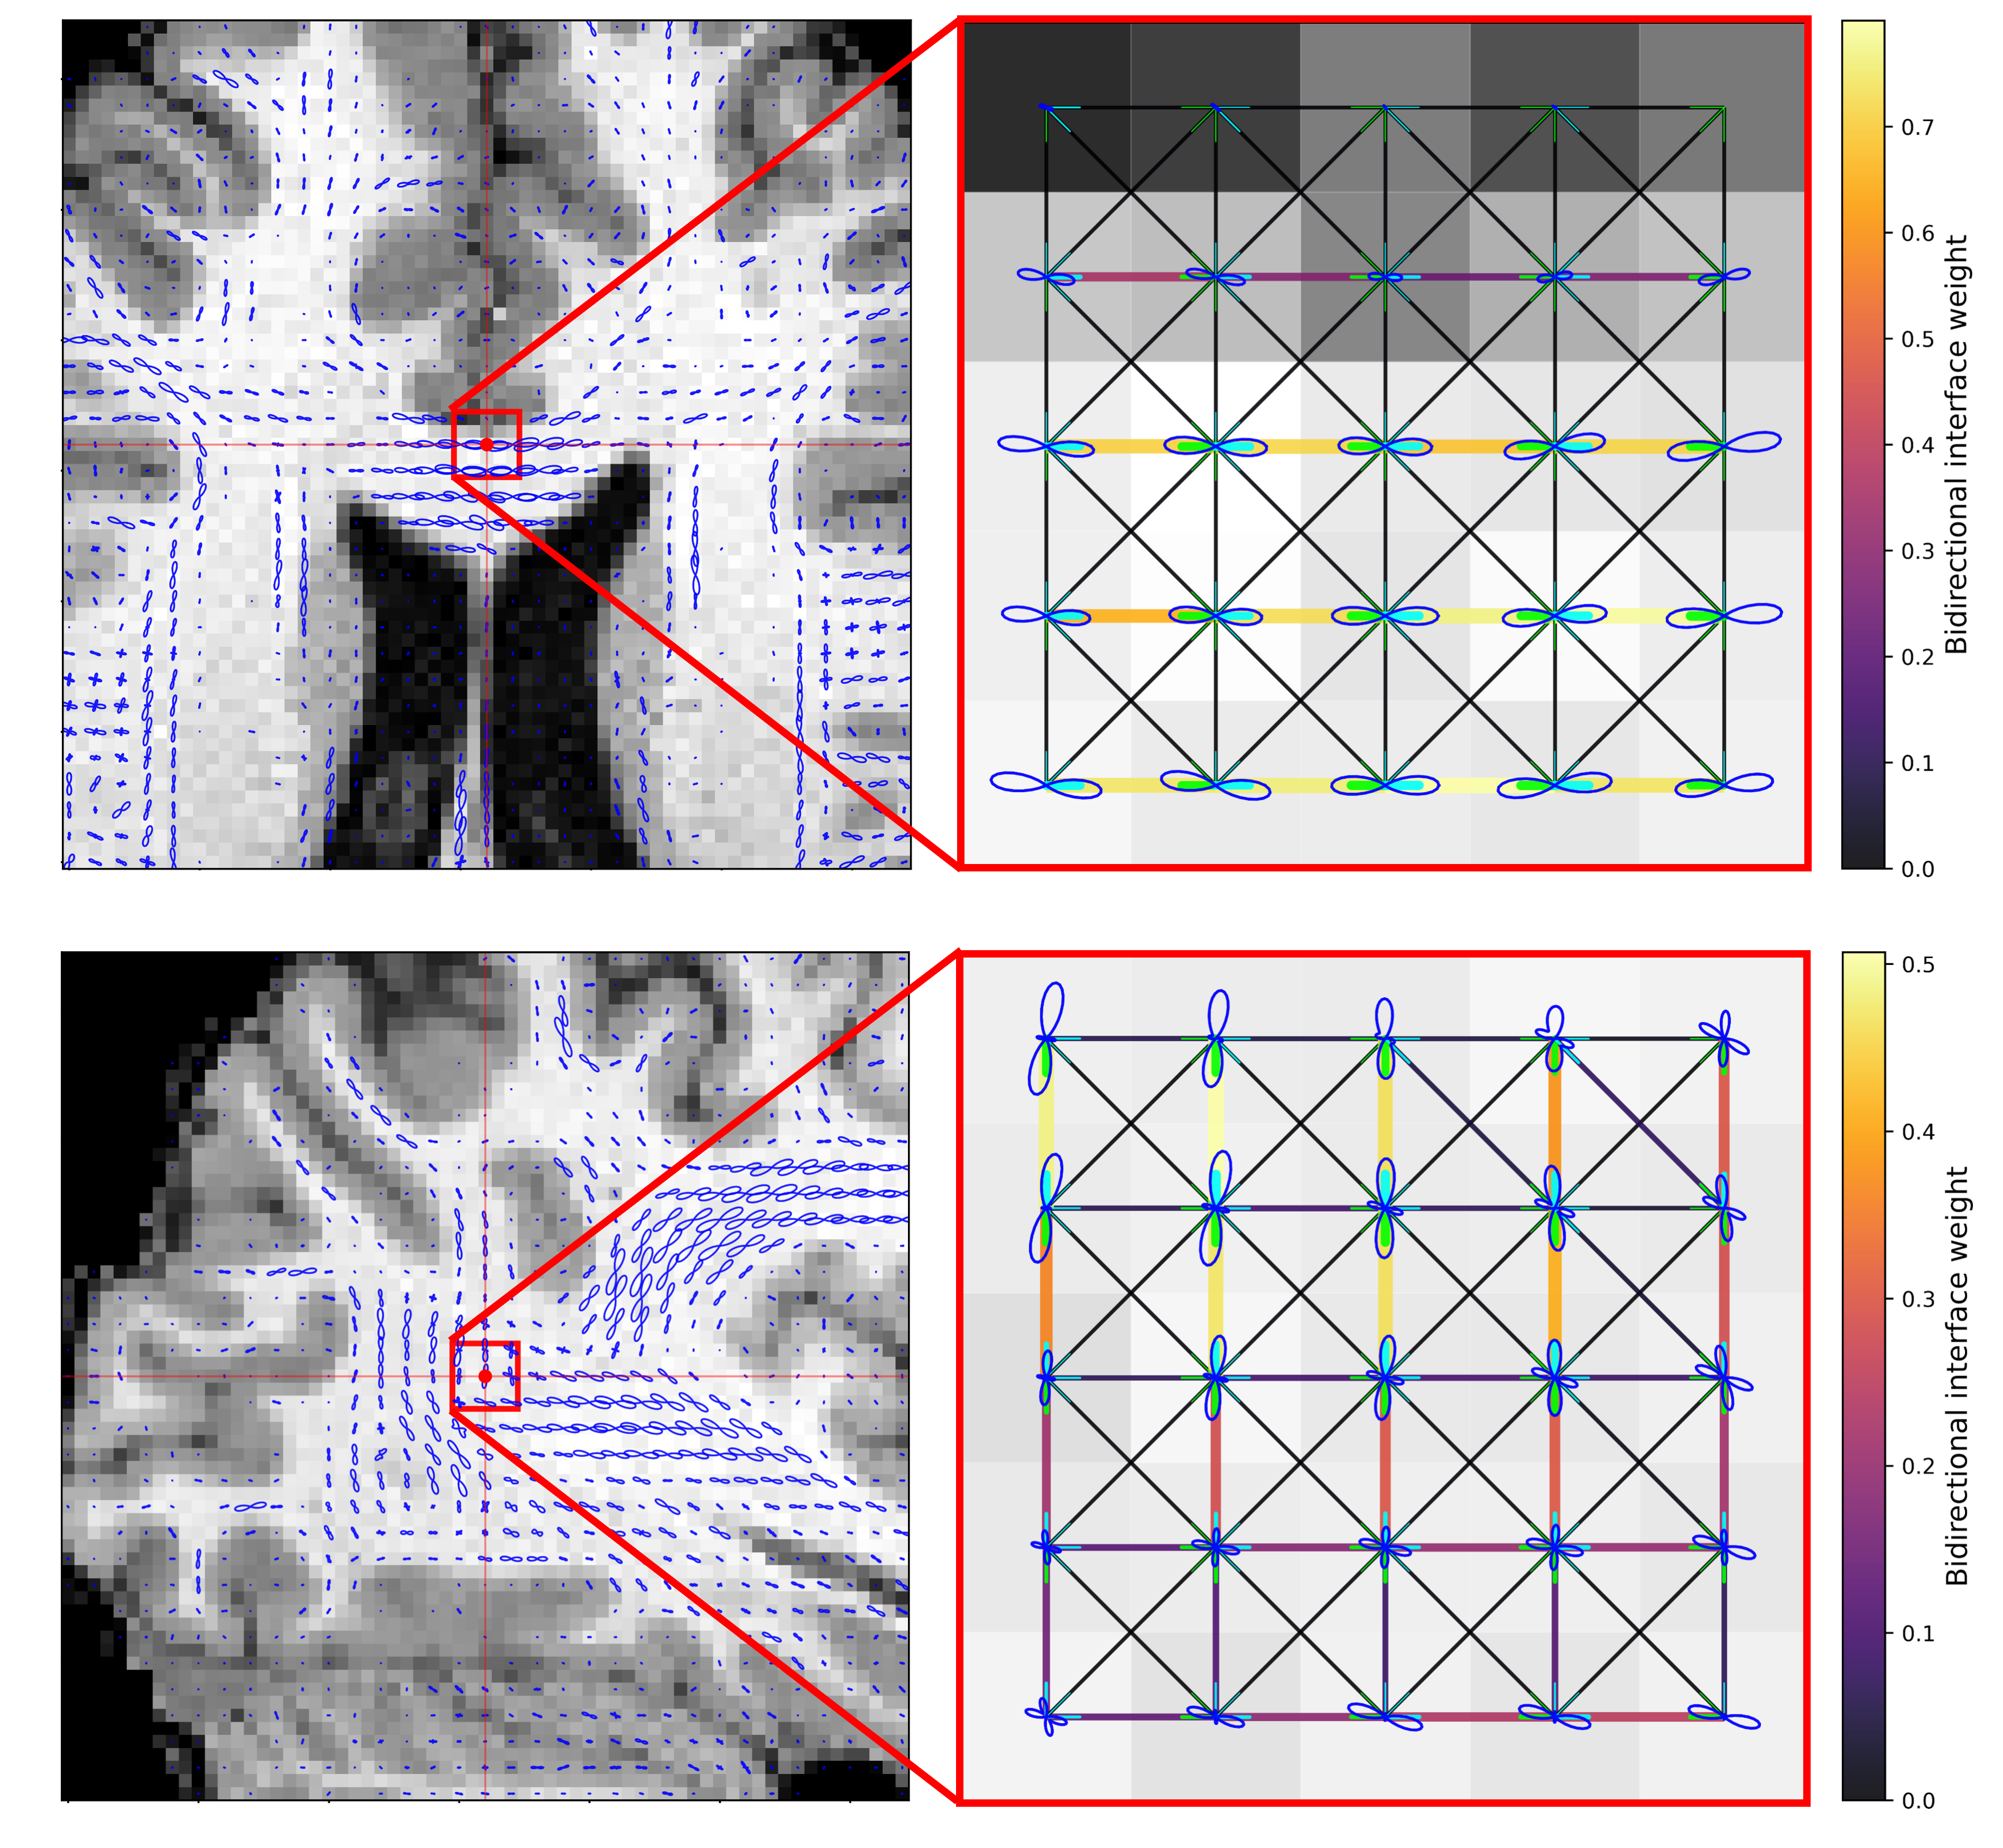
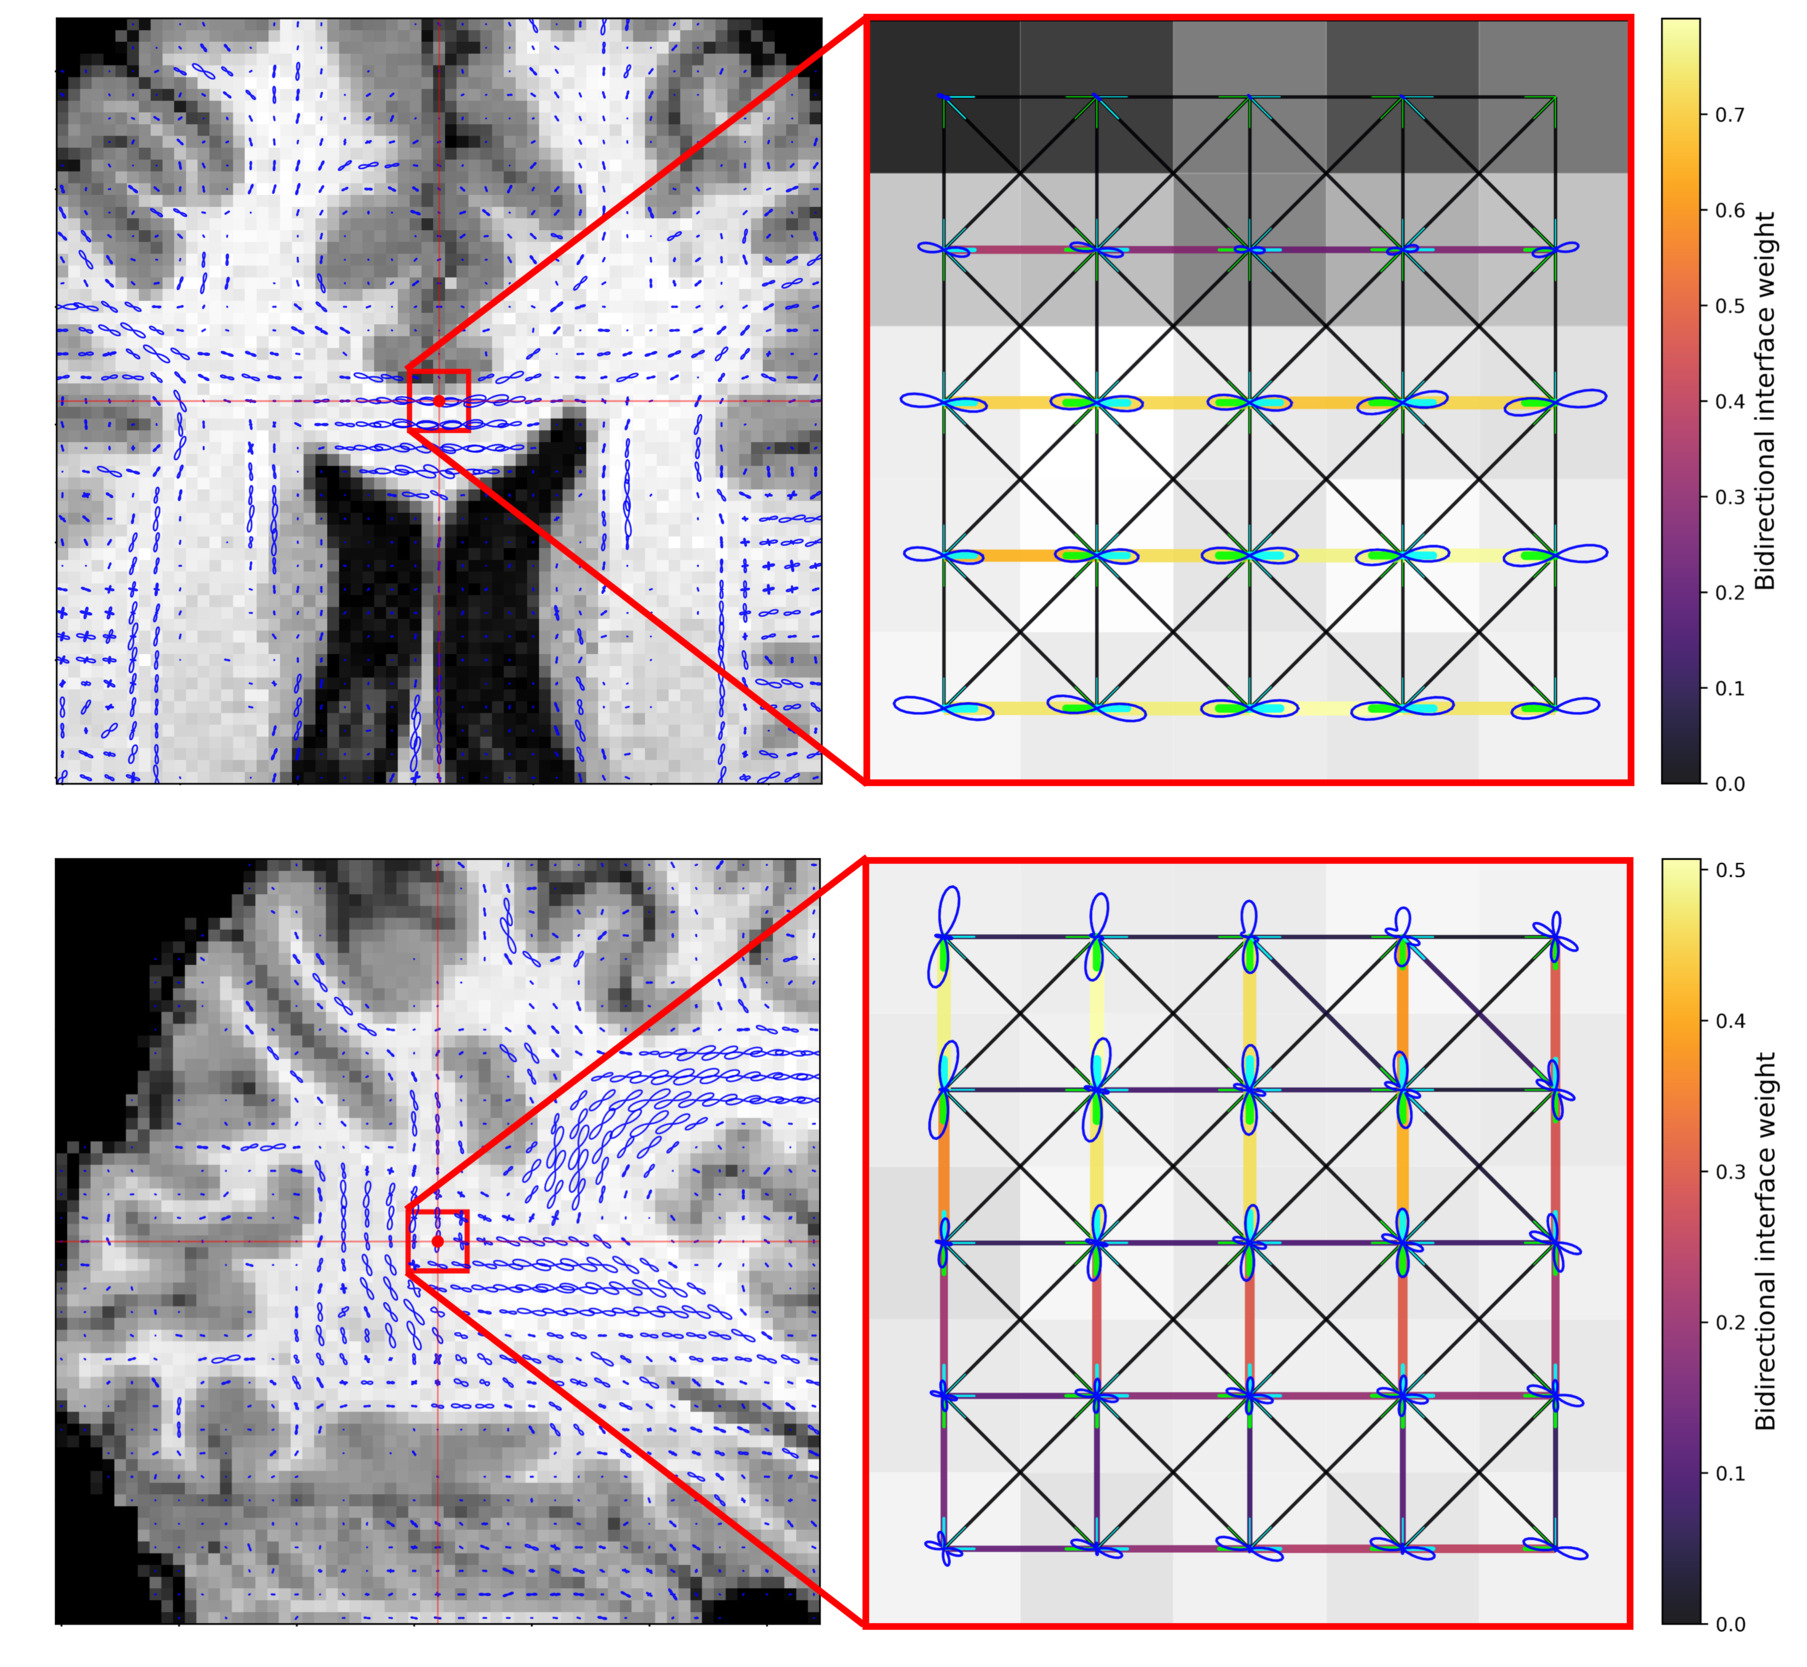
Figure 4 illustrates how the local voxel-wise graph weights followed the FOD field. In the frontal corpus callosum example, where the FODs showed a coherent dominant orientation, the strongest voxel-voxel interface weights aligned with the principal fibre direction. Interfaces not supported by the dominant orientation had weaker endpoint support and lower combined weights. In the crossing-fibre example, high-weight interfaces followed multiple FOD-supported orientations rather than a single direction. These examples show that the voxel-wise structural graph was not defined by spatial adjacency alone, but by bidirectional FOD support at neighbouring voxel interfaces.
4.3. Schaefer200 network visualizations
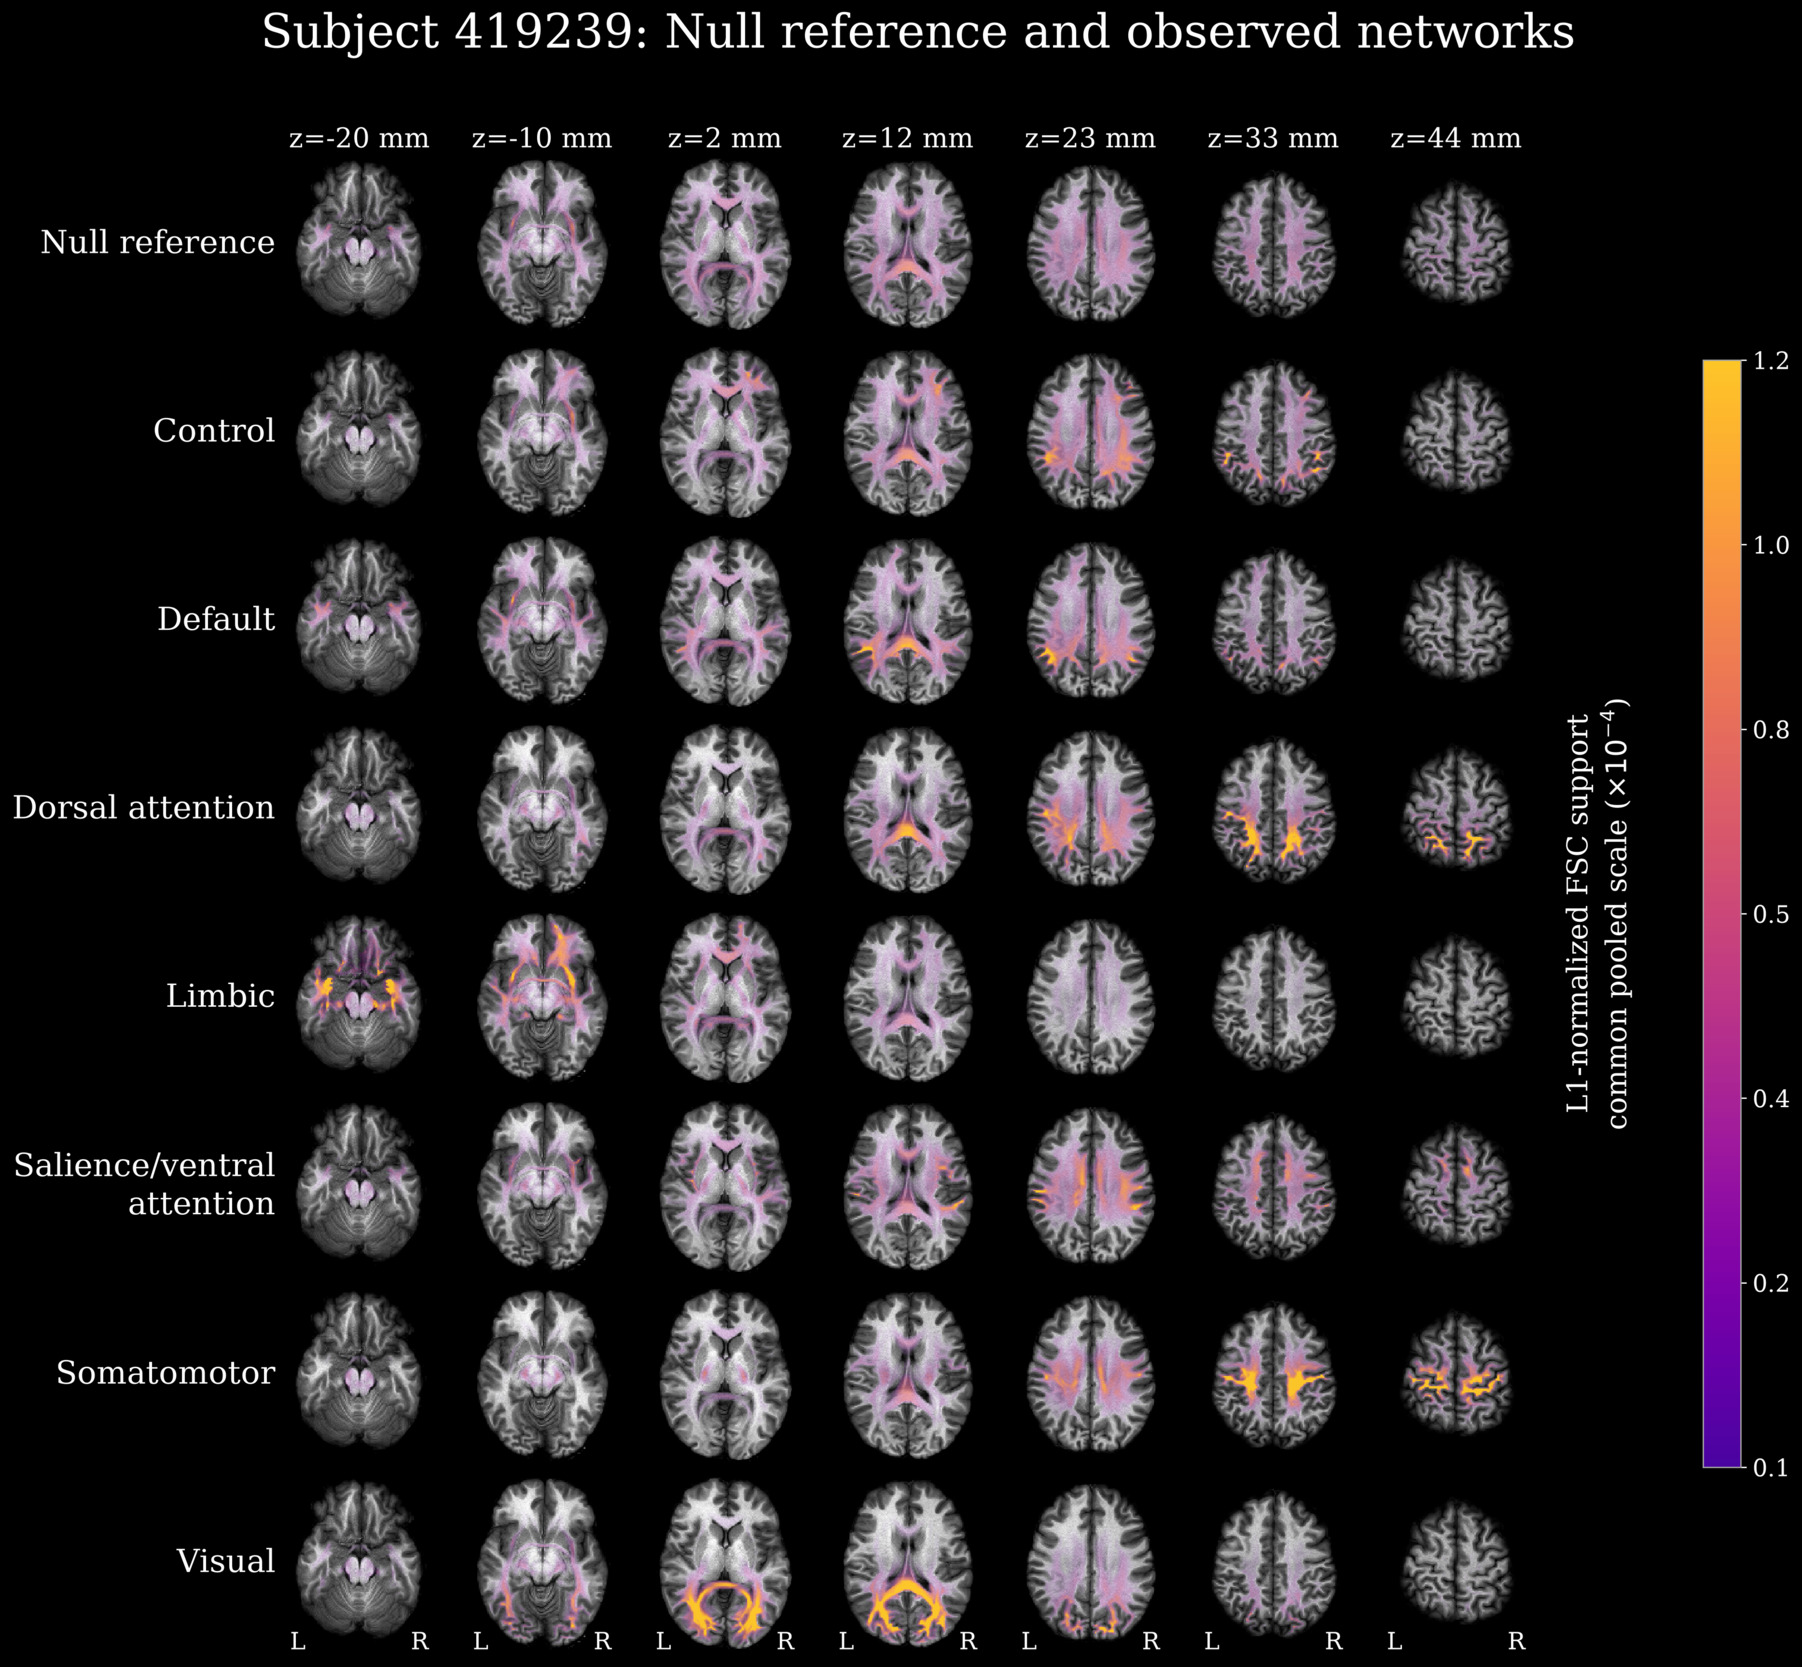
Seven network-level maps were generated separately for all three subjects from Schaefer200 parcels grouped by their Yeo network labels. Figure 5 shows subject 419239 as the detailed example. Subtracting the L1-normalized unrestricted-null reference from each observed network map produced the residual maps shown in Figure 6. These highlight regions with greater or lower relative support compared with the shared null backbone, demonstrating FC-dependent spatial variation. The corresponding figures for subjects 130013 and 106824 are provided in the supplementary material. The maps contained a prominent shared deep-white-matter backbone. Visual and limbic support showed the clearest qualitative departures from the other networks, whereas control, default mode, dorsal attention, salience/ventral attention, and somatomotor support overlapped strongly in several central regions. Parts of the network-associated features occupied spatial regions that were consistent with the expected locations of the corresponding functional networks, but this should not be read as direct evidence of anatomical network specificity.
The unrestricted reassignment analysis quantified the combination of shared and FC-location-dependent support (Fig. 7). Across-network median whole-map Pearson resemblance was 0.630 (2.5th-97.5th percentiles: 0.597-0.662) for subject 130013, 0.595 (0.559-0.630) for subject 106824, and 0.578 (0.543-0.612) for subject 419239. Median Dice overlap of the strongest 5% of graph nodes was 0.328 (0.298-0.358), 0.287 (0.260-0.320), and 0.312 (0.280-0.346), respectively. Thus, the permuted maps retained moderate resemblance to the observed maps because every realization used the same FOD-derived conductance graph, but none approached identity. The results show that the structural graph contributes a shared backbone, while reassigning the FC pairs produces substantial redistribution of voxel-wise support. Because the unrestricted destination pairs were not matched to the observed pairs by distance or hemispheric class, some of this redistribution may reflect differences in pair length or interhemispheric composition rather than FC-pair placement alone.
The somatomotor network was used to compare the voxel-wise FSC support map, a current-guided path-like display derived from the same solved edge-current field, and a conventional tractogram selected using the same network masks (Fig. 8). The three panels represent related but different quantities: a voxel-wise projection of edge-current magnitudes, a secondary path-like visualization of the graph-flow solution, and an endpoint-selected iFOD2/ACT streamline representation. No quantitative accuracy or performance comparison was made between them as the aim was to demonstrate the possibility of such visualisation of FSC output not to compare it against gold-standard tractography methods.
4.4. Combined test-retest reproducibility
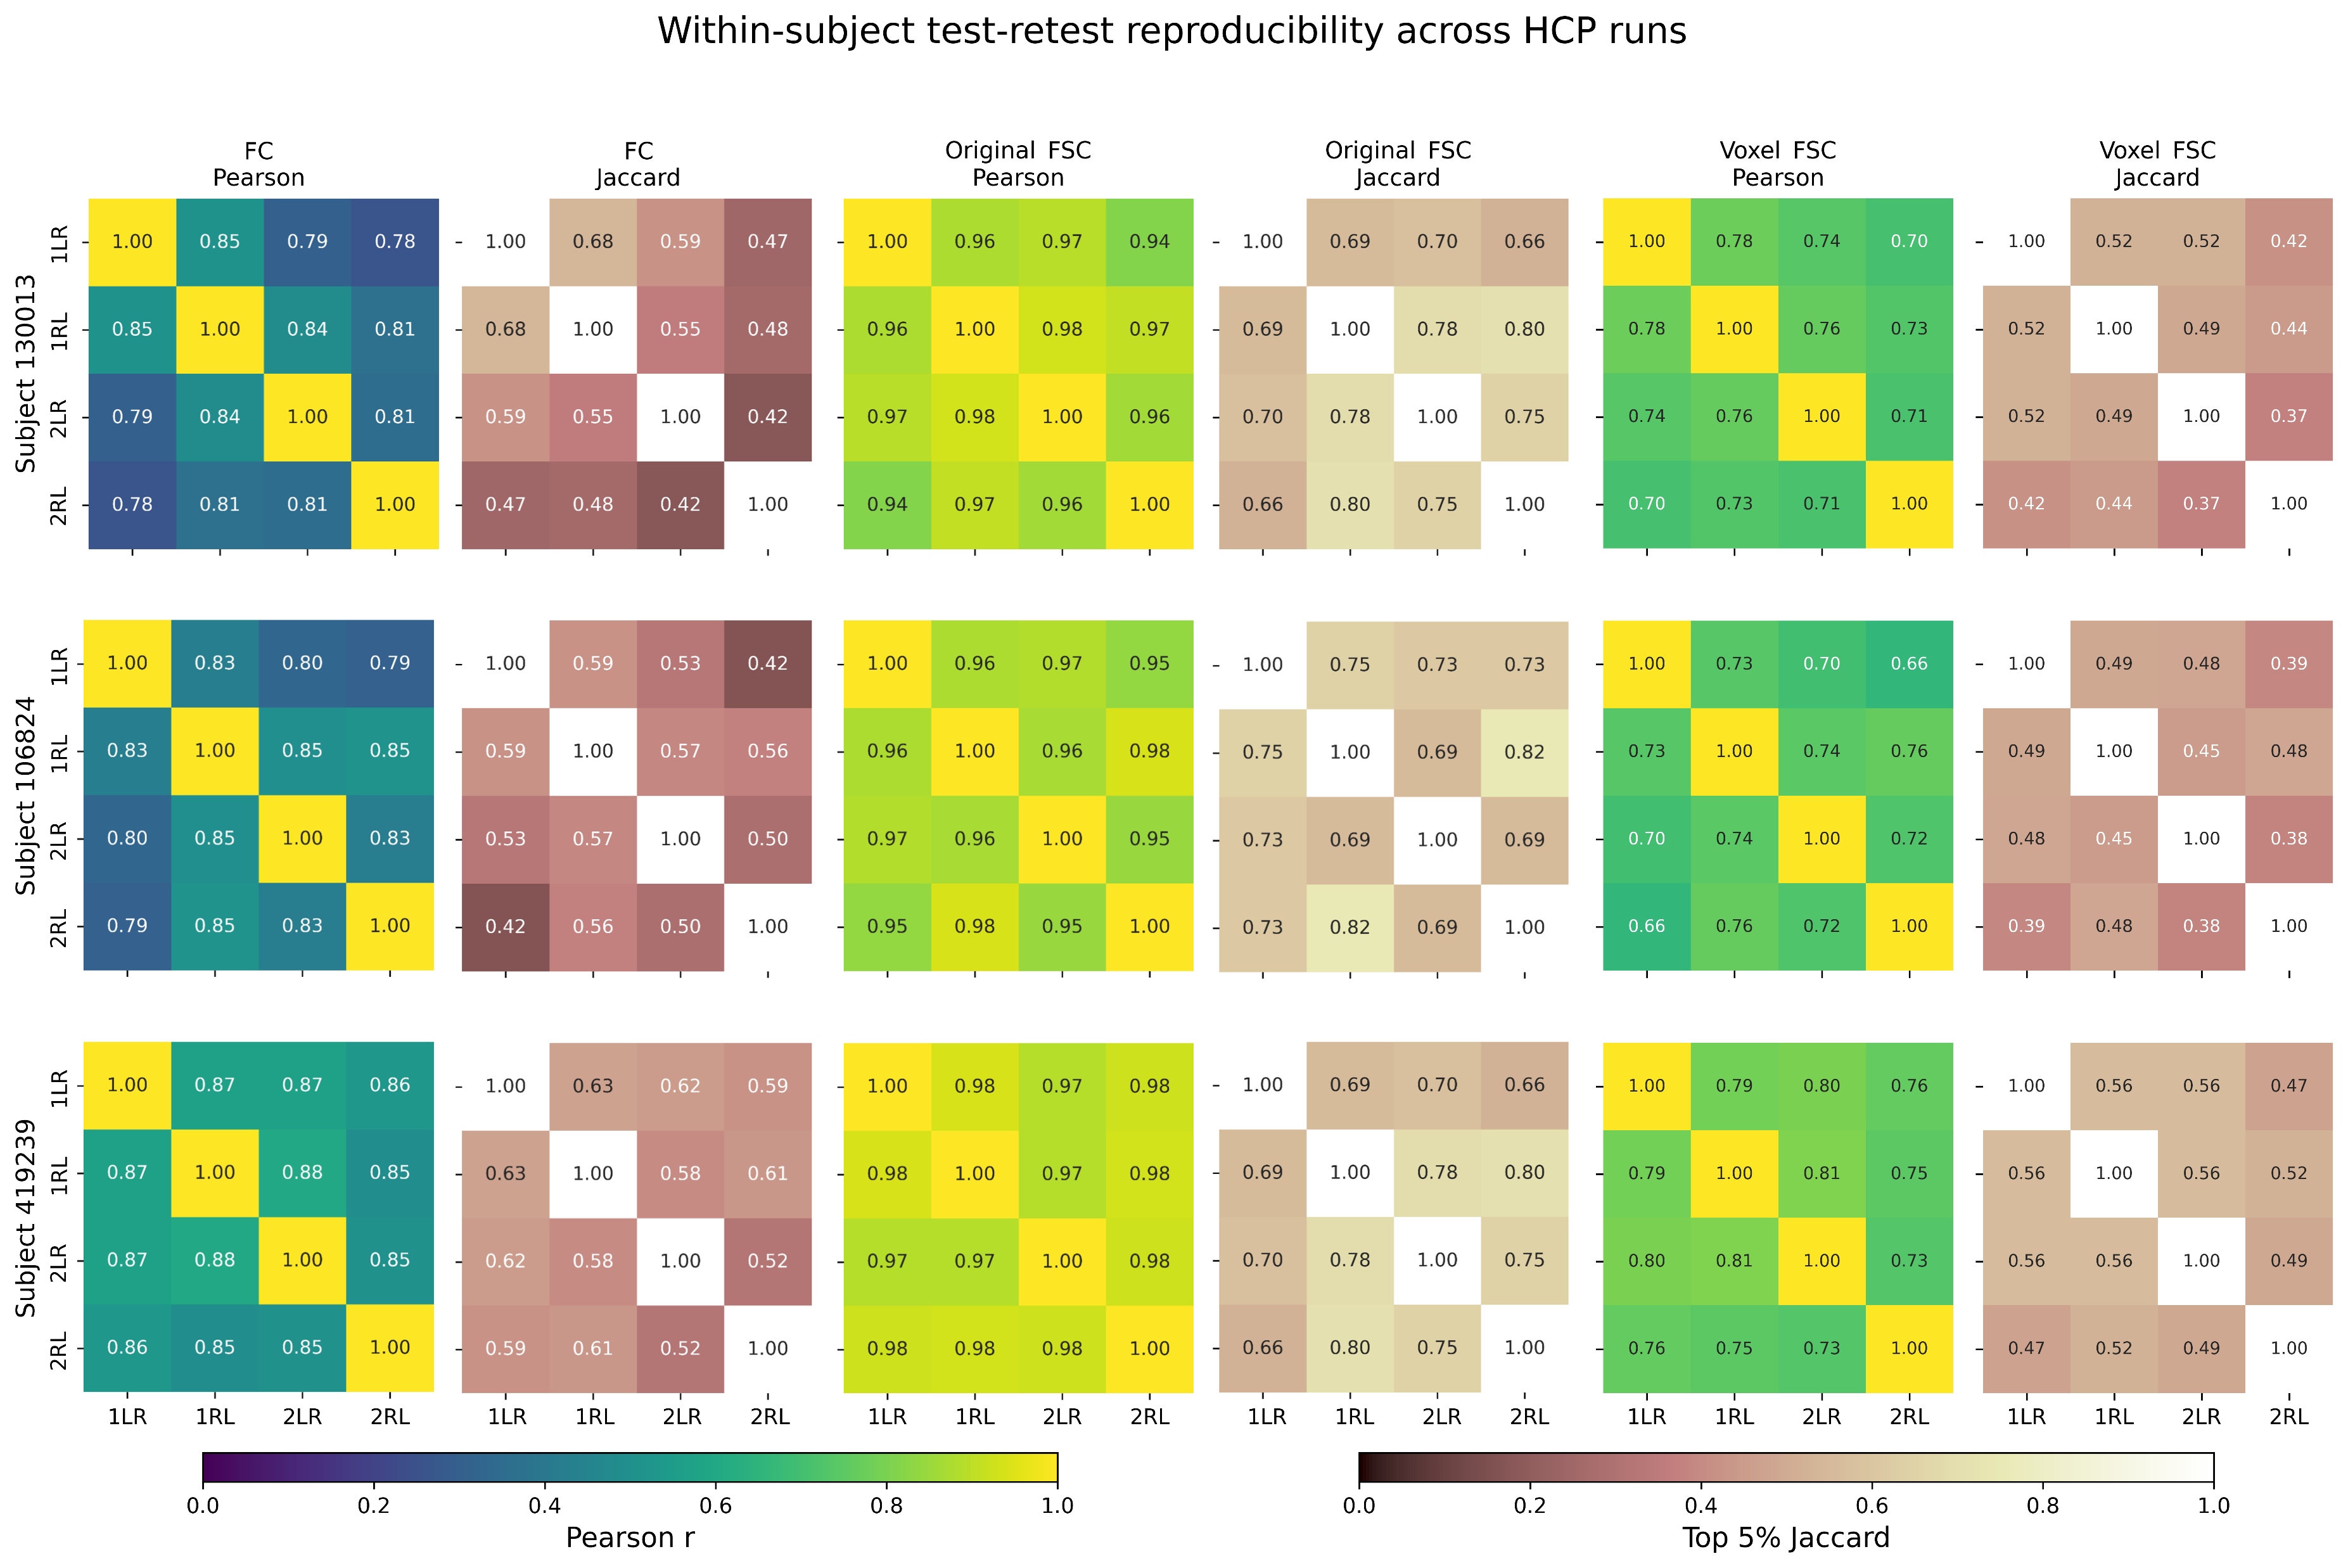
Test-retest reproducibility was evaluated using the six matched-direction comparisons defined in the Methods. In the Desikan-Killiany analysis (Fig. 9), median FC reproducibility was (interquartile range, IQR: 0.801-0.853), with a top-5% Jaccard overlap of 0.578 (0.538-0.603). Original region-level FSC had (0.985-0.991) and Jaccard overlap 0.846 (0.806-0.865). Voxel-wise FSC had (0.731-0.758) and Jaccard overlap 0.500 (0.481-0.520). These values are descriptive summaries across three subjects rather than population estimates.
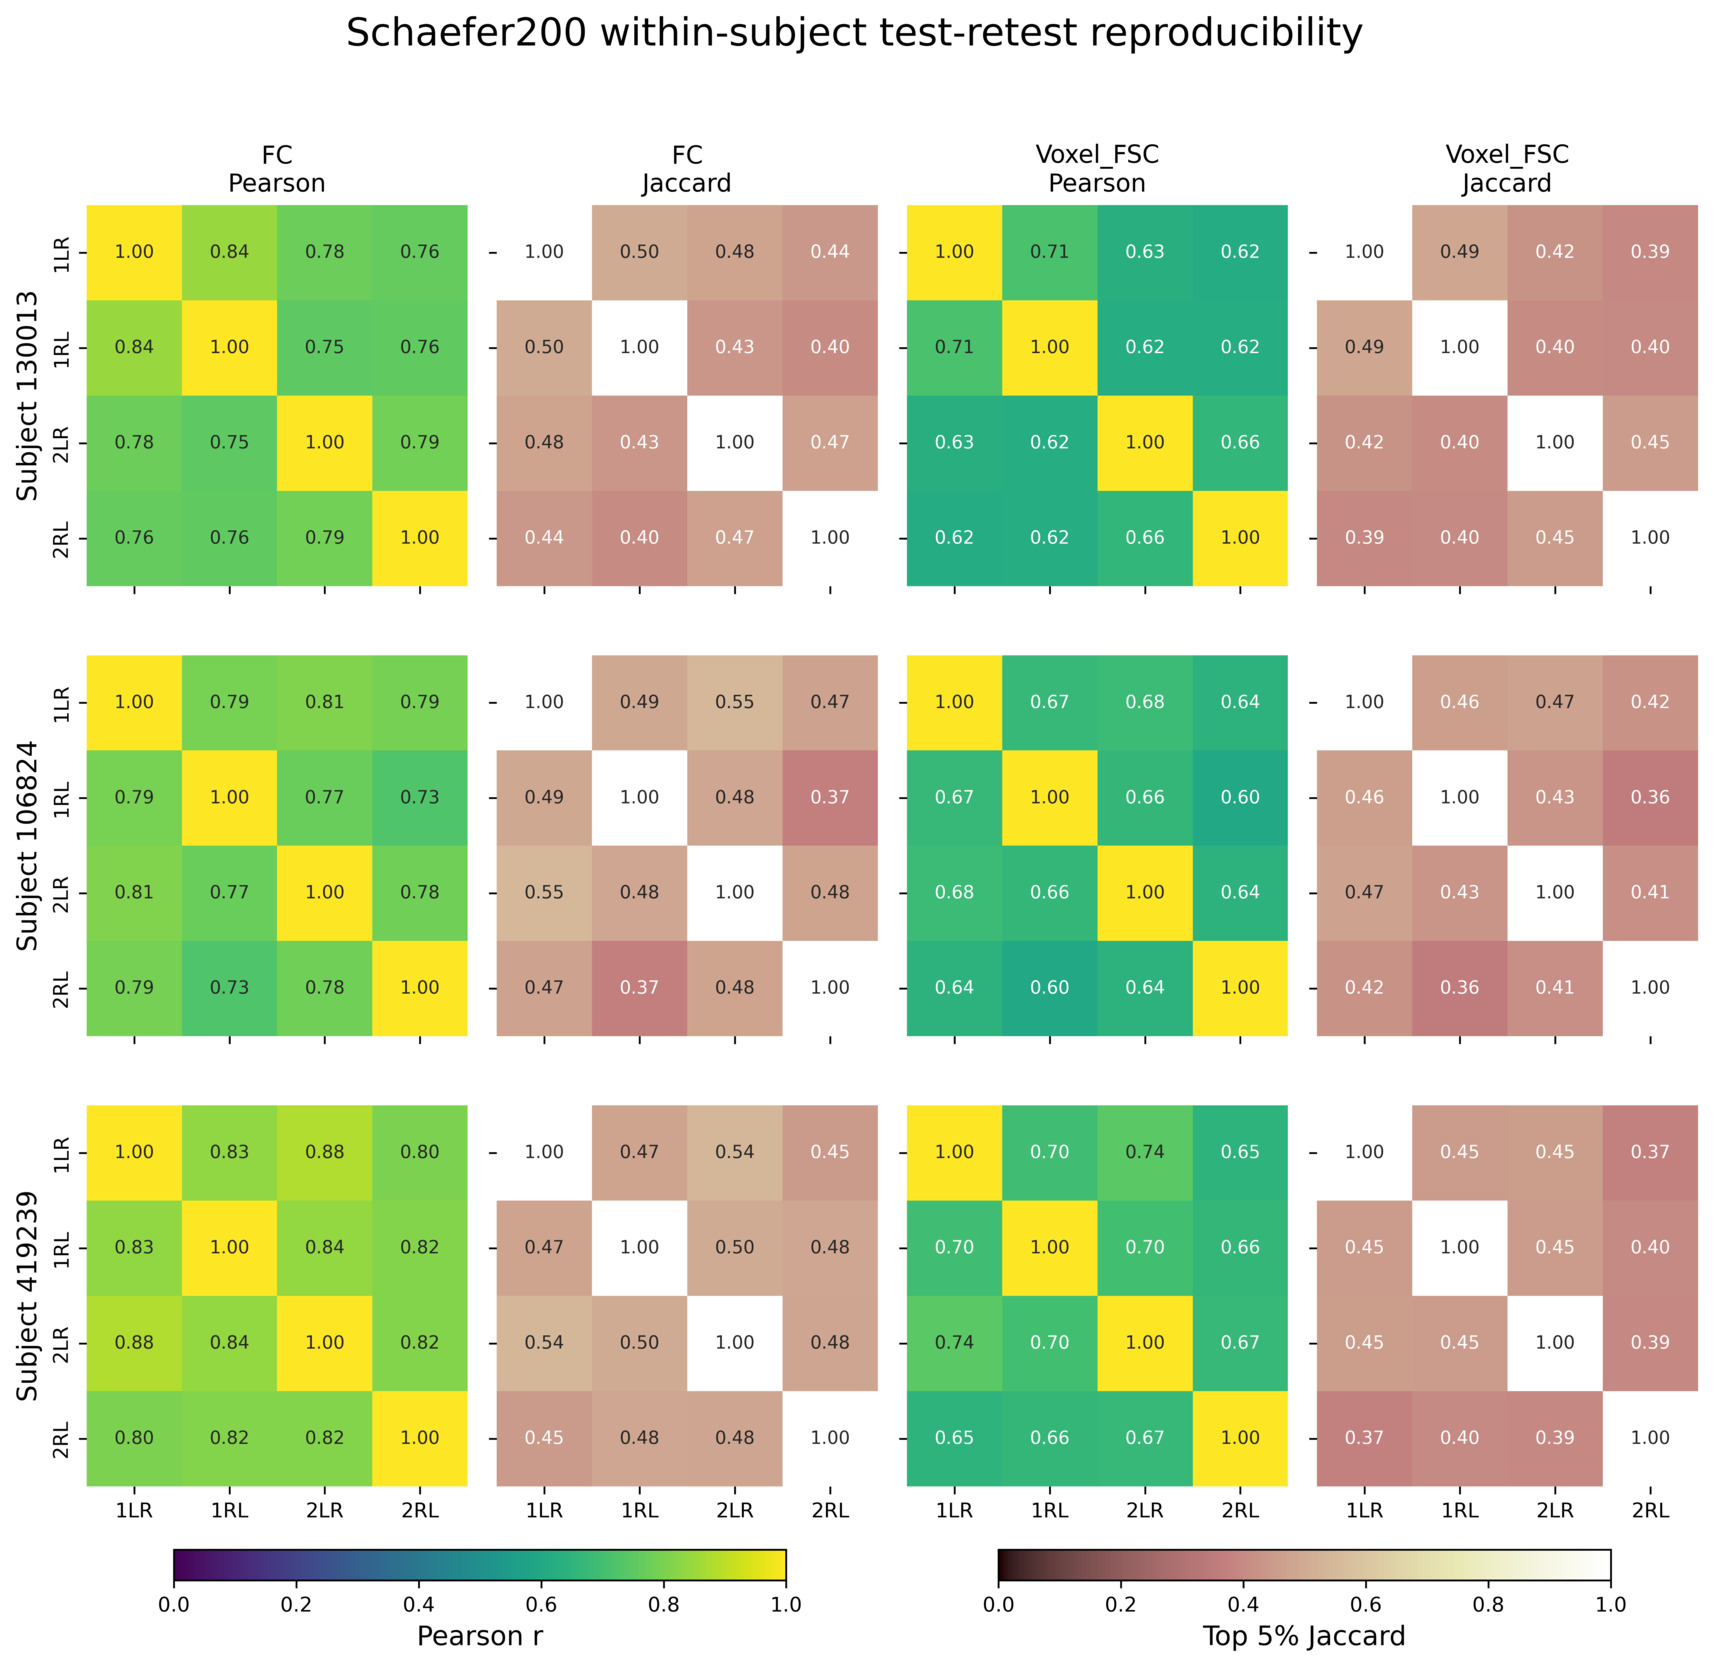
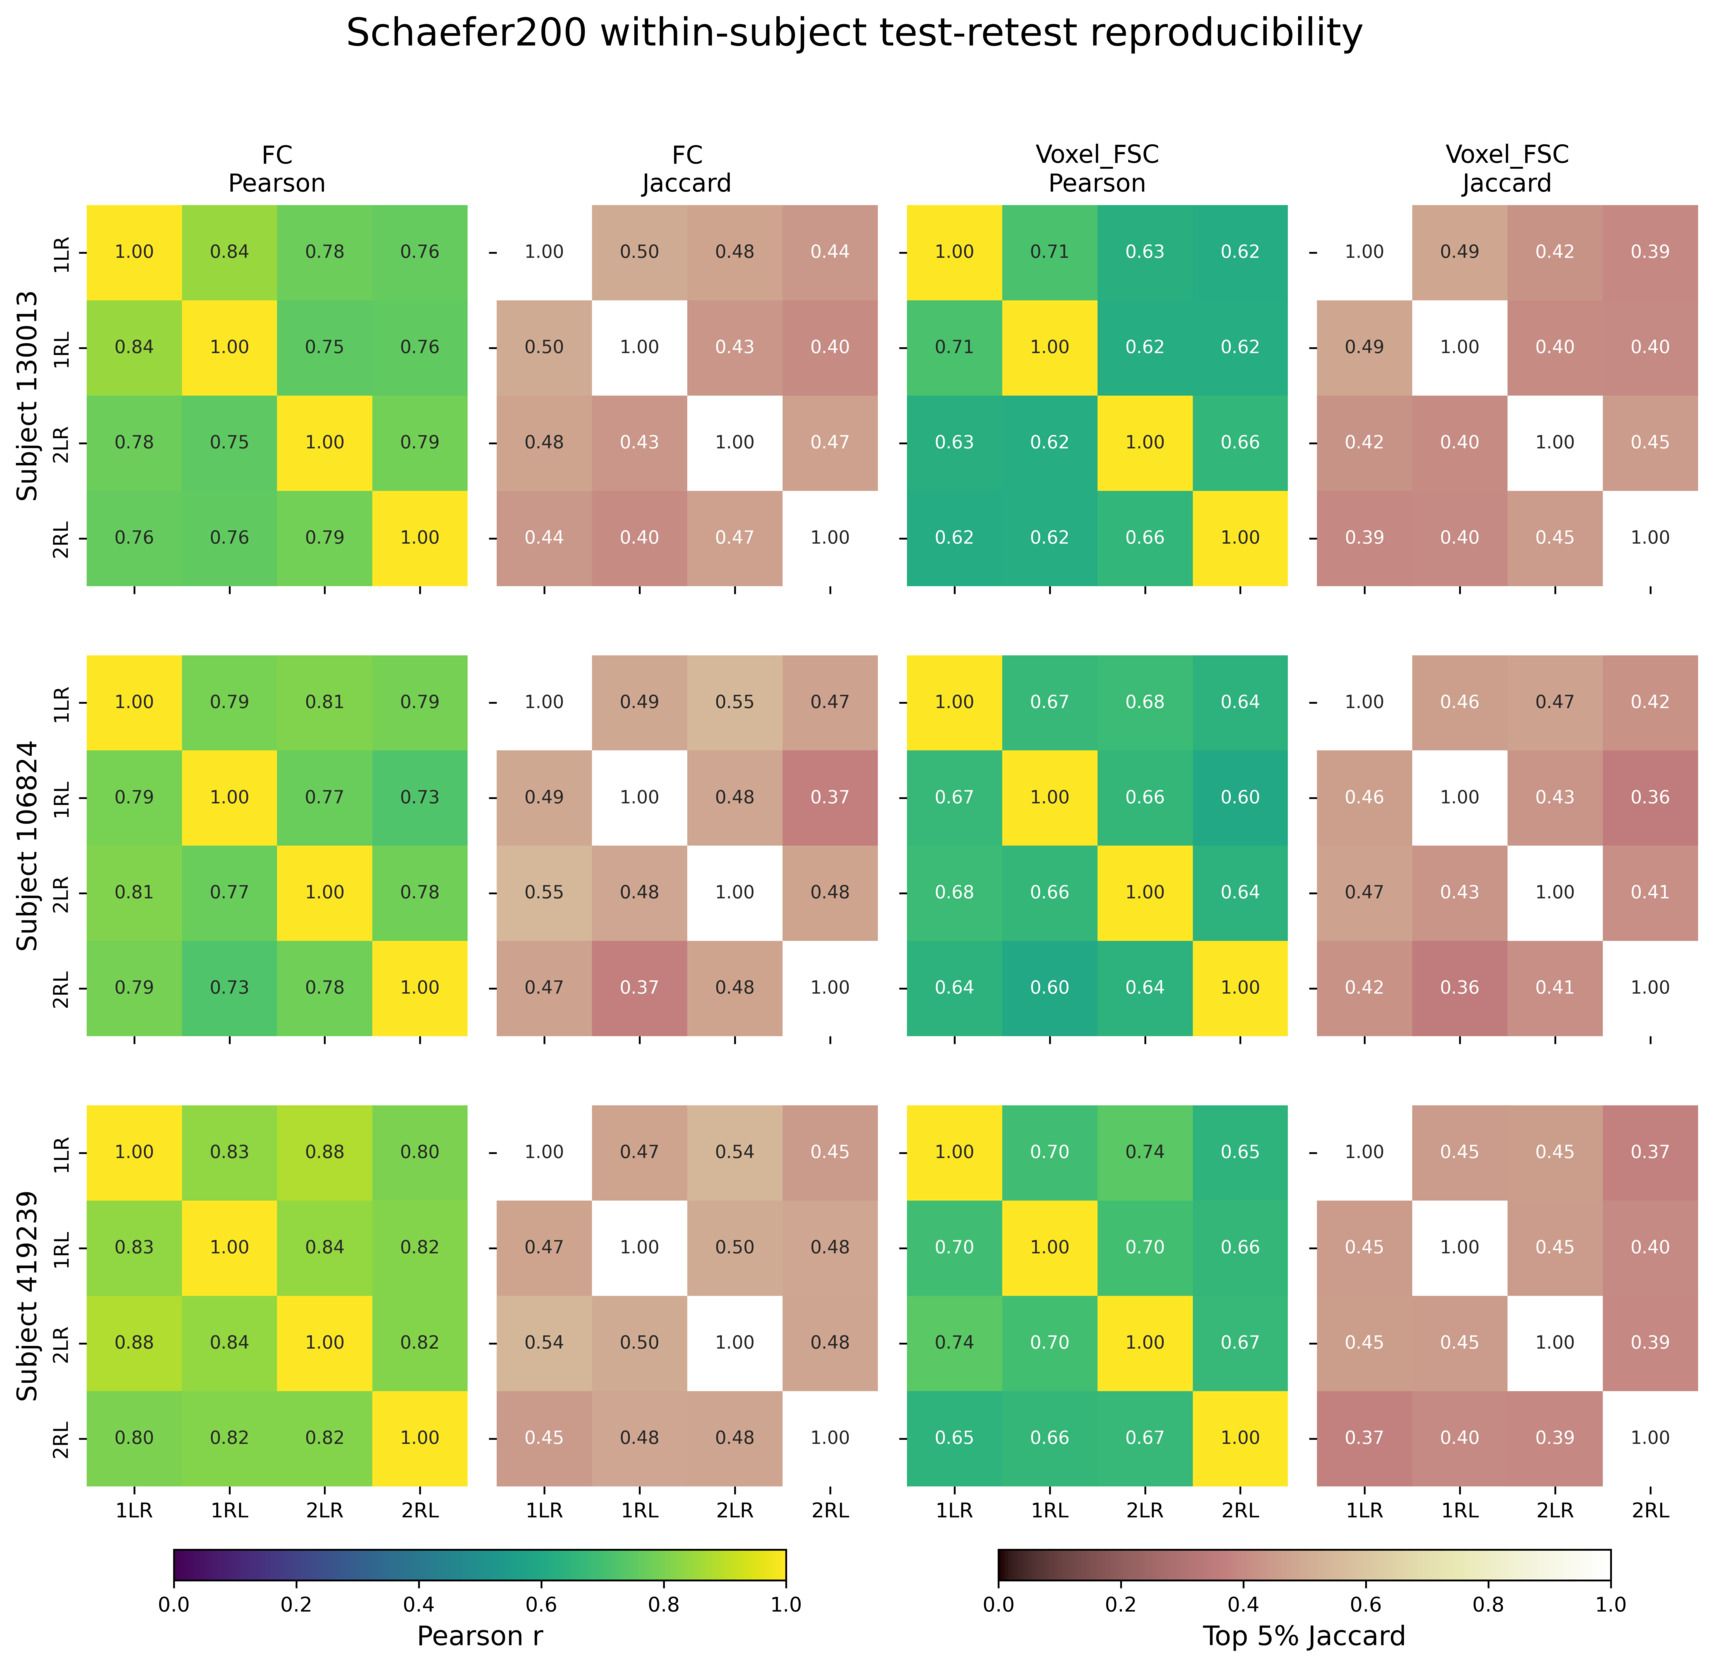
At Schaefer200 (Fig. 10), median FC reproducibility was (IQR: 0.762-0.815) and Jaccard overlap was 0.480 (0.421-0.527). Median voxel-wise FSC reproducibility was (0.621-0.678) and Jaccard overlap was 0.410 (0.396-0.447). The lower values relative to Desikan-Killiany motivated the within-atlas multiscale analysis rather than being attributed solely to a conceptual difference between the two atlases.
The Schaefer multiscale analysis showed a gradual reduction in reproducibility as parcel number increased, rather than an abrupt difference specific to Schaefer200 (Table 1). Importantly, voxel-wise FSC reproducibility closely tracked the corresponding FC reproducibility across all six parcellation scales. From Schaefer100 to Schaefer1000, median FC Pearson correlation decreased from 0.810 to 0.713, an absolute reduction of 0.097, while median voxel-wise FSC correlation decreased from 0.668 to 0.581, a similar sized reduction of 0.087. FC top-5% Jaccard overlap decreased by 0.081, from 0.492 to 0.411, while voxel-wise FSC overlap decreased by 0.073, from 0.434 to 0.361. Intermediate scales followed the same monotonic or near-monotonic trajectories. These closely corresponding trends indicate that the reduction in voxel-wise FSC reproducibility at finer parcellation scales largely mirrors the declining reproducibility of the FC constraints supplied to the model, rather than representing an abrupt instability introduced by FSC.
5. Discussion
This work introduced voxel-wise function-structure coupling as a way to study how observed functional connectivity is accommodated by local diffusion-derived structure. Reducing dMRI to a regional tractography connectome can hide spatially extended or indirect contributions between functionally connected regions. Voxel-wise FSC instead constructs a subject-specific FOD-derived graph and imposes fMRI-derived FC values on that graph, producing potentials, edge-current fields, and support maps. These outputs are quantitative within the specified graph model, but they remain conditional on the functional constraints, diffusion model, graph-construction rules, and parcellation.
5.1. Voxel-wise FOD graphs as structural networks
The role of the voxel-wise FOD graph is illustrated at three complementary levels. The overall workflow in Figure 2 shows how regional FC constraints are connected to a subject- and voxel-wise structural network through ROI supernodes. The toy examples in Figure 1 illustrate the bidirectional endpoint rule used to assign conductance to voxel interfaces. The local HCP examples in Figure 4 then show how the same rule applies in real FOD fields, where coherent single-fibre regions and crossing-fibre regions produce different local graph geometries.
Together, these examples clarify that voxel-wise FSC does not treat the white-matter mask as a uniform conductive medium. The conductance field is locally anisotropic and depends on FOD-derived directional support, following the broader use of spherical deconvolution and FODs to represent complex fibre configurations beyond the single-tensor model.9,28,46 This is important because many white-matter regions contain crossing, kissing, fanning, or otherwise complex fibre configurations that are not adequately represented by a single dominant tensor direction.6,44 The bidirectional endpoint rule also makes the graph more conservative than a one-sided orientation rule: high conductance requires compatible FOD support on both sides of the voxel interface. This neighbourhood-aware interpretation is consistent with the observation that adjacent voxels contain information about local fibre geometry that is not captured by treating each voxel independently.29
This interpretation also defines an important limitation. The voxel-wise structural network can only be as reliable as the FOD estimates from which it is built. Local uncertainty, partial-volume effects, angular resolution, response-function estimation, preprocessing choices, and FOD modelling assumptions are known to influence diffusion MRI-derived structural representations.7–9,46 Voxel-wise FSC should therefore be interpreted as FC-conditioned flow over a diffusion-derived graph, not as a direct measurement of axonal wiring or causal neural signaling.
Native voxel resolution does not necessarily imply that the resulting localization is accurate at the scale of an individual voxel. Registration errors, tissue partial volume, uncertainty in local FODs, and the mismatch between the spatial point-spread characteristics of fMRI and the diffusion grid can all perturb the graph interfaces and imposed boundary conditions. Coarser parcellations partly average these effects, whereas a voxel-wise output exposes them. The maps should therefore be interpreted as high-resolution model fields whose effective biological resolution may be coarser than the displayed grid.
5.2. Network-level support and parcellation scale
Schaefer200 provides a multi-resolution cortical parcellation derived from functional connectivity, and its parcels can be grouped by canonical Yeo functional-network assignments.37,49 Smaller parcels provide more localized interfaces between FC constraints and the FOD graph, while the network assignments provide a defined way to aggregate pairwise solutions. In all three subjects, some network-associated features occupied spatial regions that were consistent with the expected locations of the corresponding functional networks. The detailed example in Figure 5 also shows overlap among several networks in deep white matter which is expected as many white matter bundles traverse via same regions. The maps therefore demonstrate that the method produces spatially resolved, FC-conditioned fields, but they do not by themselves demonstrate anatomical network specificity.
The permutation test helps distinguish two contributions to this pattern. Moderate observed-null correlations and Dice overlaps show that the fixed conductance graph produces a shared structural backbone, whereas the substantial departure from identity shows that changing the locations of the FC constraints redistributes support. This does not reject either shared white-matter architecture or conductance dominance. Both can coexist with FC-configuration-dependent variation. The analysis therefore indicates that network-associated support maps depend on FC-pair assignment, although the unrestricted design does not separate general placement effects from differences in pair length or hemispheric composition. Anatomical network specificity needs further validation.
The result also depends on the selected within-network FC pairs, parcellation, ROI interfaces, and subject-specific FOD graph. This caution is consistent with previous work showing that parcellation choice and scale affect functional-connectivity estimates, graph measures, and connectome interpretation.50,51 The comparison between Figure 9 and Figure 10 initially suggested lower reproducibility at the finer atlas, and the Schaefer100-1000 analysis confirmed a gradual decline within a single atlas family. Test-retest reliability is known to vary with node definition and other methodological choices.52,53 The multiscale results therefore identify parcel resolution as one contributor, without excluding differences in atlas construction or ROI-interface geometry.
5.3. Task activation and pairwise functional constraints
An important limitation concerns task-fMRI activation within the present FSC formulation. A task general linear model contrast quantifies the response of individual regions to an experimental condition, whereas functional connectivity describes statistical dependence between pairs of regional time series. Regions can respond consistently to the same task without exhibiting correspondingly strong pairwise coupling. This distinction is longstanding.54–56 It also motivates separating task-evoked responses from residual or background connectivity when estimating task-related coupling.57,58
The present FSC formulation is most directly applied to pairwise inputs or to a grounded network which can be built readily from resting-state correlations. A task-fMRI extension would require additional choices about task-responsive regions, removal of evoked responses, estimation of task-dependent connectivity, and translation of node-wise activation into pairwise potential constraints. Treating activation as an externally driven nodal source would instead require a different source model and independent validation. Such an extension is methodologically substantial and outside the scope of this study.
5.4. Continuity with the original FSC framework
The Desikan-Killiany analysis evaluated voxel-wise FSC in the same regional setting as the original constrained-Laplacian FSC framework.24 This comparison is shown in Figure 9. Original FSC showed very high test-retest reproducibility, consistent with its use of a stable regional tractography-derived SC matrix. Voxel-wise FSC showed lower but still meaningful reproducibility, reflecting the central methodological change of the present work: the structural network is no longer a regional SC matrix, but a subject-wise FOD-derived voxel graph whose local conductances are defined on voxel interfaces (Figures 2 and 4).
This preserves the constrained-Laplacian logic of the original FSC framework while changing the spatial scale at which structural support is modelled. The result is consistent with previous function-structure coupling works showing that functional connectivity is shaped by structural architecture but is not a one-to-one readout of direct anatomical connections.11,12,15,59 The parcellation-level ROI-pair response vectors used in Figure 9 should therefore be interpreted as reduced summaries for reproducibility analysis. The primary outputs of voxel-wise FSC remain the spatially resolved graph potentials, voxel-edge current fields, and support maps, as illustrated by the somatomotor example in Figure 8.
5.5. Relationship to tractography and path-like displays
Voxel-wise FSC is related to graph-theoretical tractography only in the sense that dMRI is used to define a local voxel graph. Earlier graph-based and optimization-based tractography methods used diffusion information to search for likely anatomical paths through such graphs.17,18,21,23,25,26 Voxel-wise FSC uses a different operation: the graph is not searched for the most likely anatomical pathway, but is used as the structural network on which observed functional constraints are solved (Figures 2 and 4). However, this does not make FSC free of error sources related to FOD estimates and tractography.7–9,46
In voxel-wise FSC, the primary output is not a reconstructed tractogram, but the solved voxel-wise support field. Path-like displays can still be useful because they summarize high-current components of the graph-flow solution in a familiar streamline form, as shown in the FiberCup and somatomotor examples (Figures 3 and 8). However, these curves are downstream visualizations of the solved current field and should not be interpreted as edge-currents imposed onto conventional diffusion MRI tractography.
The somatomotor comparison in Figure 8 is consequently illustrative rather than a performance benchmark against state-of-the-art tractography methods. The conventional tractogram provides an endpoint-selected anatomical reference for the same cortical masks, whereas voxel-wise FSC shows where the observed somatomotor FC constraints load onto the FOD-derived graph. The two representations may overlap where strong functional constraints follow major diffusion-consistent pathways, but they need not be identical because they answer different questions: tractography asks which anatomical streamlines are reconstructed from the diffusion data, whereas voxel-wise FSC asks how observed functional relationships are accommodated by the diffusion-derived structural network.
5.6. Limitations and future work
The present analyses were methodological demonstrations rather than population-level validation. The HCP evaluation included only three subjects. Seven-network support maps were generated separately for all three subjects. The subject 419239 is presented as the detailed main-text example (Figure 5) and the corresponding maps for subjects 130013 and 106824 are provided in the supplementary material. Because the sample comprised only three subjects, no population-level statistical inference was attempted. The reported statistics and subject-conditional reassignment distributions are descriptive. Larger datasets would be needed to evaluate group-level reproducibility, inter-subject variability, stability across preprocessing choices, and feasibility for investigating different brain conditions and diseases. The FiberCup experiment provided an implementation-level sanity check for graph construction, constraint encoding, and pairwise support extraction (Figure 3), but it was not a definitive ground truth for voxel-wise anatomical routing. A connection that is indirect in a region-level tractography graph may be locally feasible in a voxel-wise FOD graph, either because such local support exists or because the spatial or angular resolution is insufficient to separate nearby fibre structures. Voxel-wise FSC streamlines should be regarded as a proof-of-concept, not an anatomically validated replacement for tractography. The anatomical validation of voxel-wise FSC remains substantially more limited than the extensive external benchmarking available for tractography.
6. Conclusion
This work proposed voxel-wise function-structure coupling as a quantitative framework for studying how observed functional connectivity is supported by local diffusion-derived structural architecture. The method constructs a subject-wise FOD-derived voxel graph, imposes observed fMRI-derived functional connectivity values on that graph, and solves for spatially resolved support maps. This allows functional relationships to be studied in relation to distributed, indirect, and crossing-fibre structural support that may be poorly represented by single parcel-to-parcel edges. The method was evaluated using in-silico simulations, local graph-construction examples, multiple brain parcellations, network-level visualisations, and within-subject test-retest analyses. Together, these results show that voxel-wise FSC provides a reproducible and spatially resolved way to map functional relationships onto diffusion-derived structural support, with possibility to produce tractogram-like visualizations for qualitative analyses.
Ethics statement
This study used previously collected, publicly available, and de-identified Human Connectome Project data. No new human participant data were collected for this work. The HCP data collection was conducted under the ethical approvals and informed-consent procedures of the original HCP study. The in-silico phantom analyses did not involve human participants or animal subjects.
Data and code availability
The voxel-wise FSC code is openly available at https://github.com/vilsaira/fscpy. The Human Connectome Project data used in this study are available through the HCP data repository under the applicable data-use terms. The FiberCup phantom data are available from the original FiberCup resource described in the cited publications.
Author contributions
Viljami Sairanen: Conceptualization, Methodology, Software, Formal analysis, Investigation, Visualization, Writing.
Funding
N/A
Declaration of competing interests
The author declares no competing interests.
Use of AI
AI tools were used for language editing, code editing, and drafting support during manuscript preparation; all scientific content, analyses, interpretation, and final text were reviewed and approved by the author.
Acknowledgements
The author thanks the anonymous reviewers for their motivating and thoughtful feedback. In particular, their suggestions to perform permutation-based analyses and evaluate multiple Schaefer parcellation scales strengthened the methodological evaluation and helped clarify the interpretation and limitations of the proposed framework.
The author is also grateful to an unnamed mentor for encouraging in pursuing independent research ideas.
The authors wish to thank the Finnish Computing Competence Infrastructure (FCCI) for supporting this project with computational and data storage resources. Open access funded by Helsinki University Library.